
Houses for Sale in Kansas City
· 5,692 homes fit this search5,692 homes fit this search · Sorted by Newest Listed
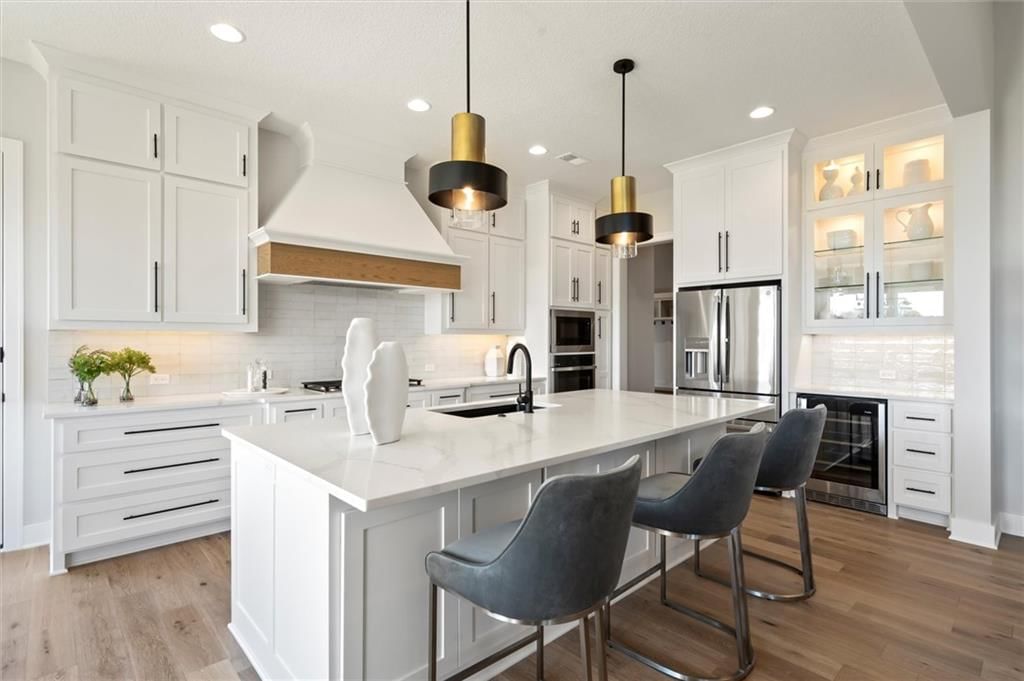
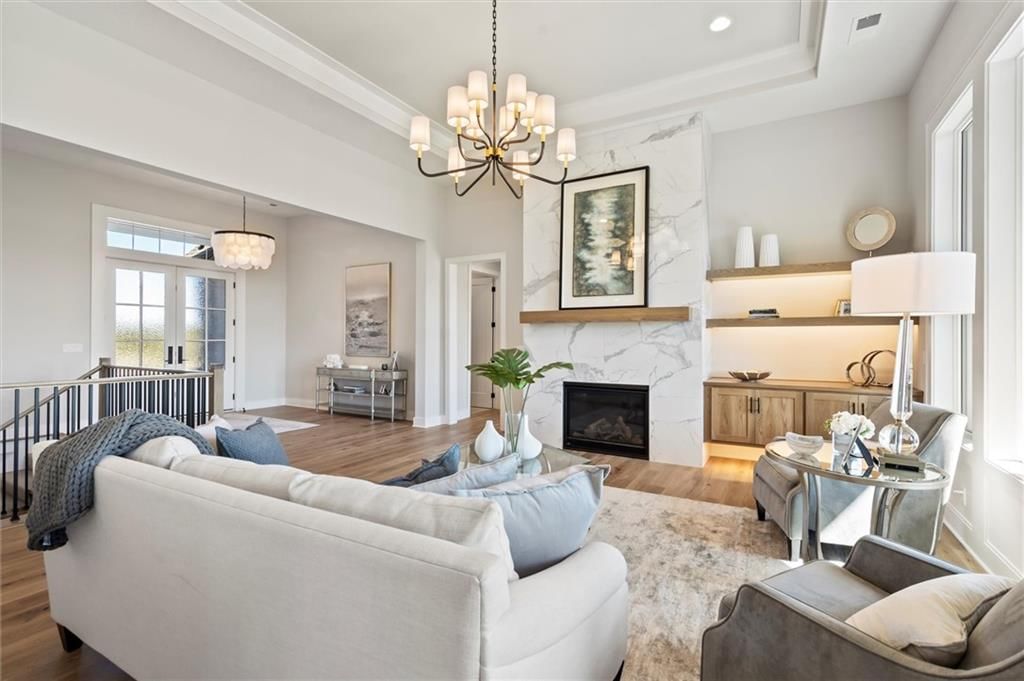
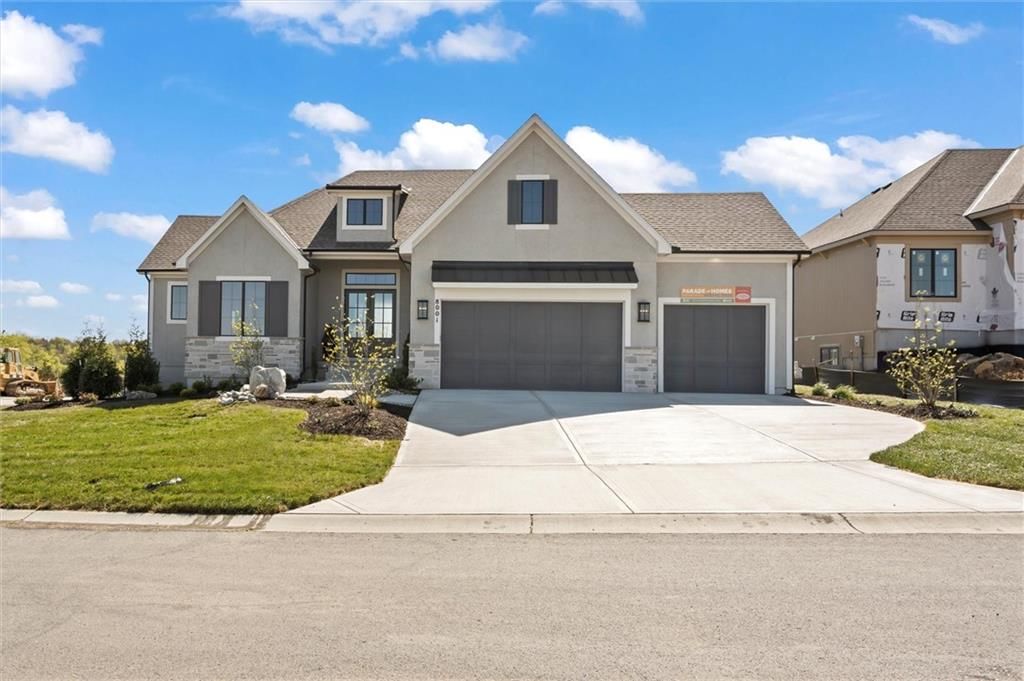
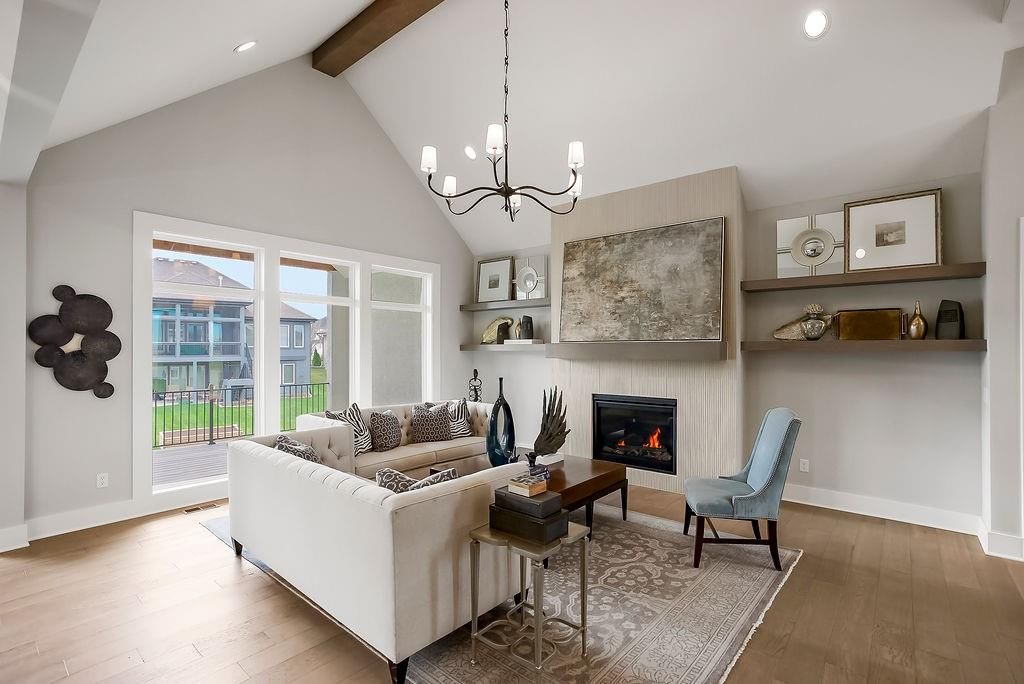
Open Fri 11 AM to 5 PM
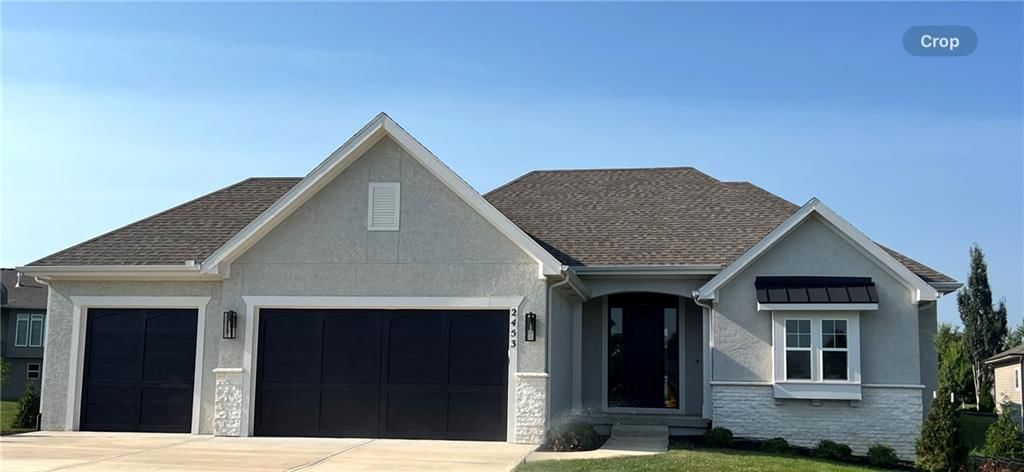
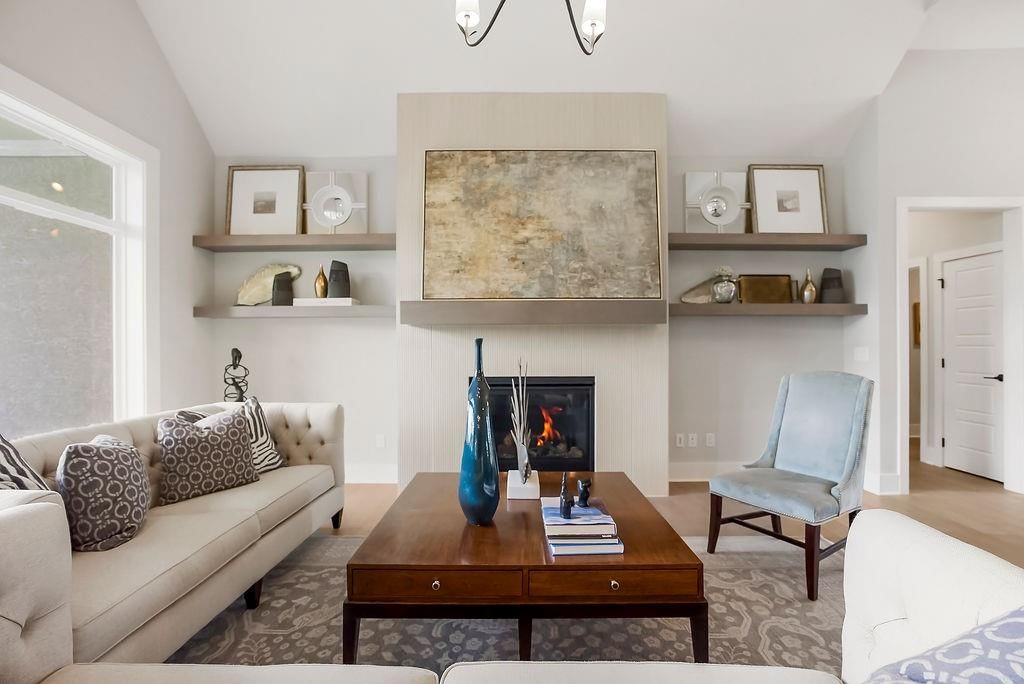
3-car garage
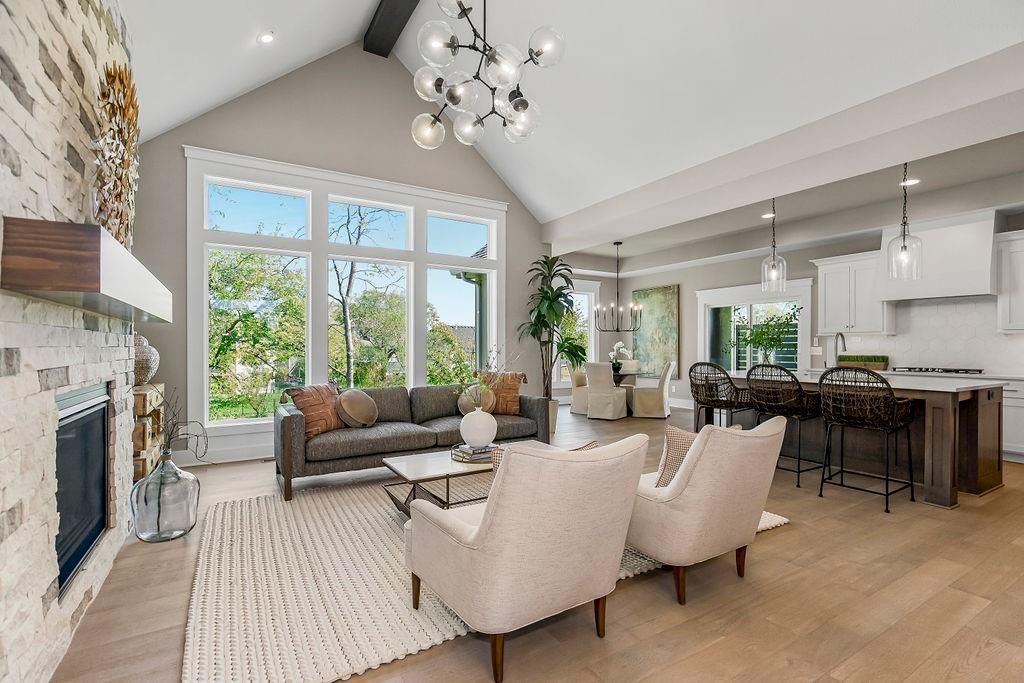
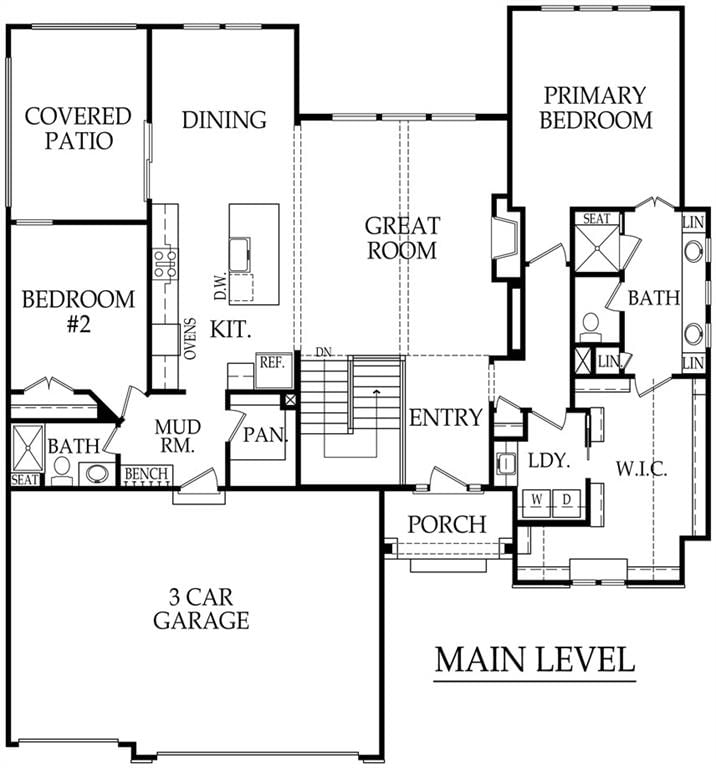
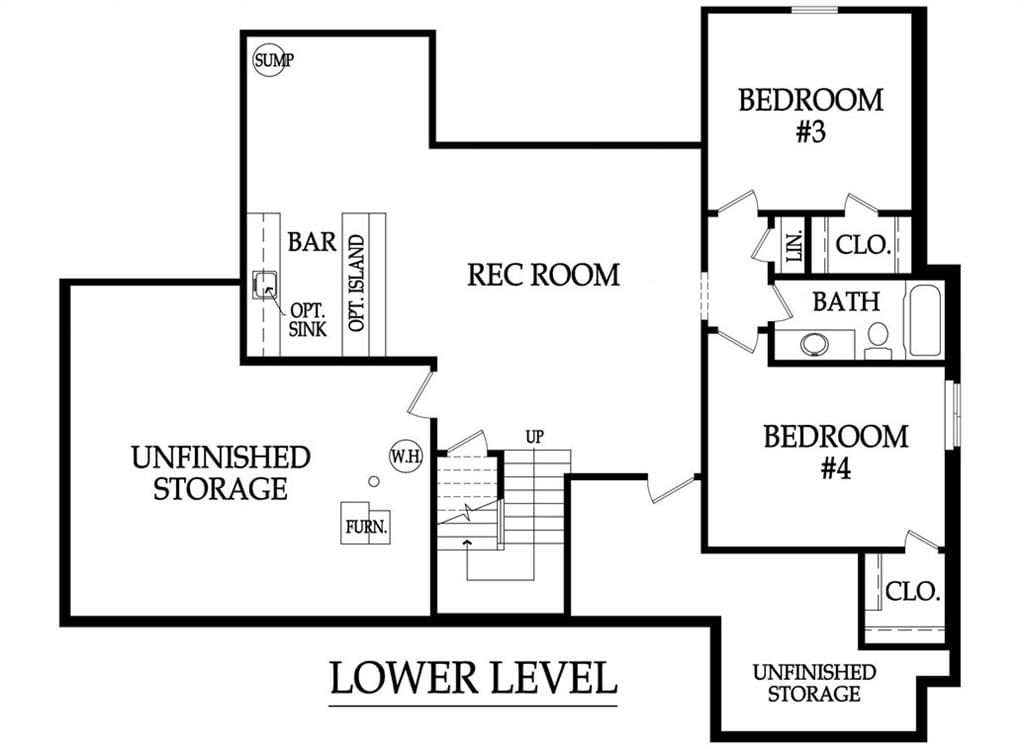
Built 2022
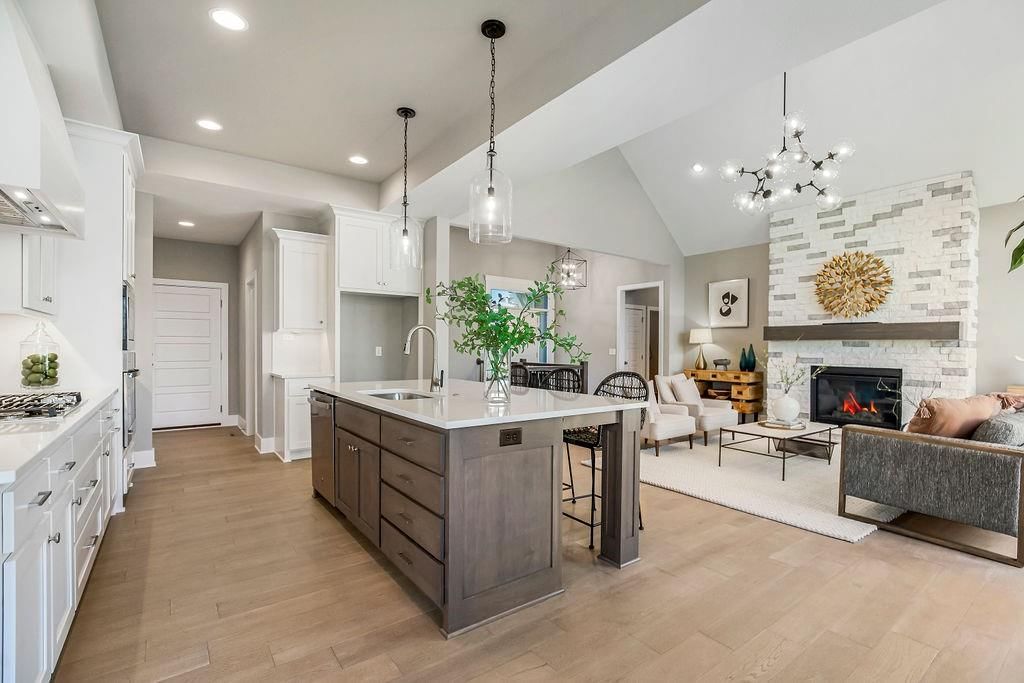
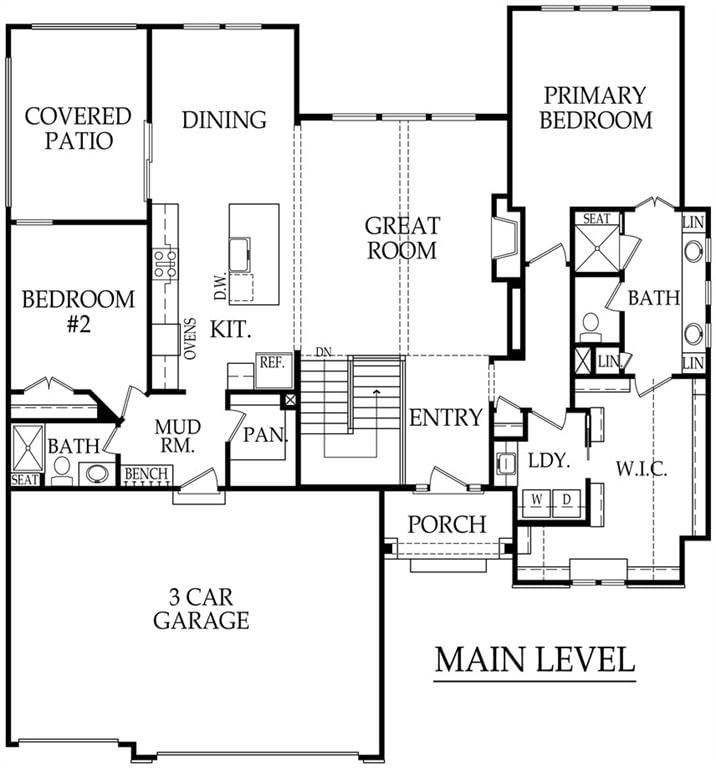
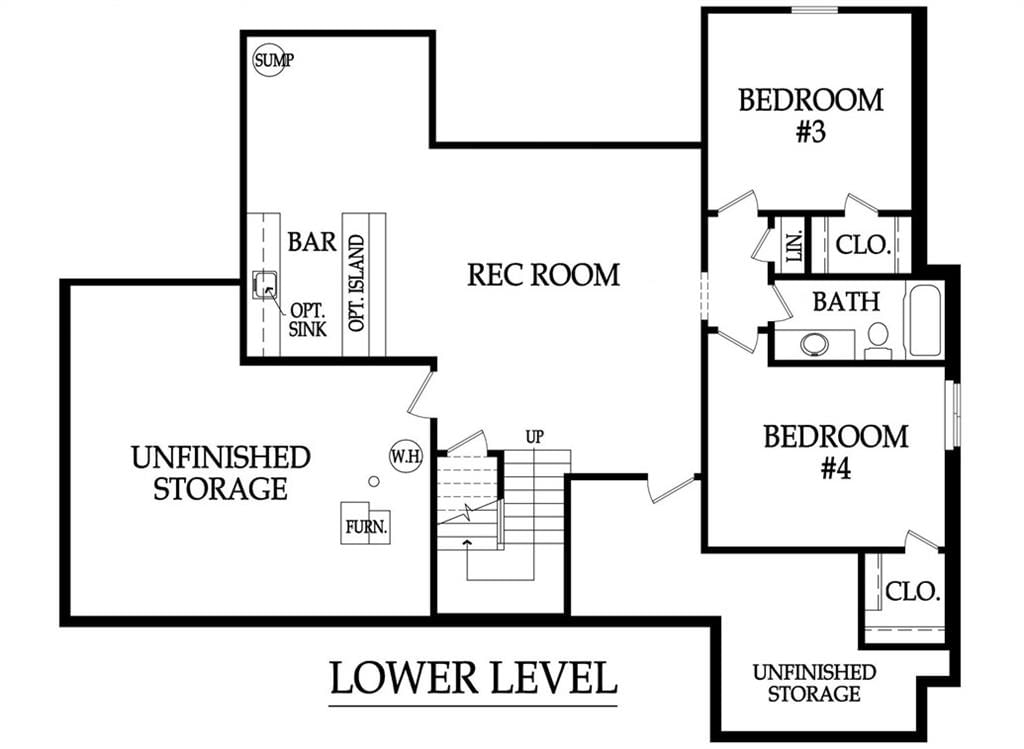
Built 2022
① Kansas City itself — the place you are on
Popular home searches in Kansas City
| Search | For sale |
|---|---|
| Homes with a pool | For sale233 |
| Waterfront homes | For sale87 |
| Open houses | For sale879 |
| Just listed homes | For sale590 |
| Price-reduced homes | For sale3,190 |
| Homes with acreage | For sale1,329 |
| Homes with a finished basement | For sale3,433 |
| Ranch homes | For sale1,672 |
| 3-car garage homes | For sale2,071 |
| Main-floor primary homes | For sale2,817 |
| Coming soon homes | For sale344 |
| Homes with a fireplace | For sale4,215 |
How we compute these
- For sale.
- Homes listed as active right now. A live count, not a monthly average.
Show all 32 popular home searches
- Homes with a pool
- Waterfront homes
- Open houses
- Just listed homes
- Price-reduced homes
- Homes with acreage
- Homes with a finished basement
- Ranch homes
- 3-car garage homes
- Main-floor primary homes
- Coming soon homes
- Homes with a fireplace
- Multi-family homes
- Homes on large lots
- Single-story homes
- Homes on a cul-de-sac
- Homes with a walk-out basement
- Homes under contract
- Homes with no HOA
- 2-bedroom homes
- 3-bedroom homes
- 4-bedroom homes
- 5+ bedroom homes
- Homes on under a quarter acre
- Homes on 1/4 to 1/2 acre
- Homes built before 1960
- Homes built 2020 or newer
- Homes with 2+ full bathrooms
- Homes with 3+ full bathrooms
- Homes with 4+ full bathrooms
- 2-car garage homes
- 4-car garage homes
Homes by price in Kansas City
| Price range | For sale |
|---|---|
| Under $200,000 | For sale1,787 |
| Under $300,000 | For sale3,204 |
| Under $400,000 | For sale4,564 |
| Under $500,000 | For sale5,500 |
| Under $600,000 | For sale6,233 |
| Under $750,000 | For sale6,934 |
| Under $1,000,000 | For sale7,585 |
| $300,000 – $400,000 | For sale1,414 |
| $400,000 – $500,000 | For sale975 |
| $500,000 – $600,000 | For sale765 |
| $600,000 – $750,000 | For sale724 |
| $1M and above | For sale580 |
How we compute these
- For sale.
- Homes listed as active right now. A live count, not a monthly average.
④ Zip codes, every city, then wider — widest
Nearby ZIP codes
| Place | Market (Market type is set by months of supply — how long it would take to sell every home for sale at the current pace. Under ~4 months favors sellers (low inventory, faster sales, homes near or above asking); over ~6 favors buyers (more choice, more negotiating room). 4–6 is balanced.) | Months supply | Median list | Sell-to-list | Days to contract | For sale | Coming soon | Under contract |
|---|---|---|---|---|---|---|---|---|
| 66062 | Seller's | 2.7 mo | Median$608,645 | 100% | 18d | 268 | 13 | 146 |
| 66061 | Seller's | 3.5 mo | Median$614,975 | 99% | 19d | 282 | 8 | 130 |
| 66048 | Balanced | 4.4 mo | Median$209,000 | 97% | 27d | 171 | 3 | 52 |
| 64083 | Balanced | 4.6 mo | Median$379,450 | 98% | 27d | 204 | 7 | 104 |
| 66221 | Seller's | 3.6 mo | Median$977,500 | 101% | 28d | 119 | 5 | 58 |
| 64152 | Seller's | 3.7 mo | Median$474,999 | 100% | 27d | 161 | 13 | 55 |
How we compute these
- Market.
- Market type is set by months of supply — how long it would take to sell every home for sale at the current pace. Under ~4 months favors sellers (low inventory, faster sales, homes near or above asking); over ~6 favors buyers (more choice, more negotiating room). 4–6 is balanced.
- Months supply.
- How many months it would take to sell every home now for sale at the pace of the last 90 days: homes for sale ÷ (closings in the last 90 days ÷ 3).
- Median list.
- The middle asking price among the homes for sale right now. Half are listed above it, half below.
- Days to contract.
- The middle number of days between a home being listed and going under contract, over the last 90 days of closings. It is not days-to-close, and it is not how long today's listings have been sitting. Newly built homes are excluded, because a build finishing is not a market moving.
- For sale.
- Homes listed as active right now. A live count, not a monthly average.
- Coming soon.
- Homes announced but not yet accepting showings. A live count.
- Under contract.
- Homes with an accepted contract that have not closed yet. A live count.
Show all 172 zip codes
- 66062
- 66061
- 66048
- 64083
- 66221
- 64152
- 66030
- 64086
- 66085
- 64130
- 64111
- 64014
- 64133
- 64064
- 64060
- 66086
- 64119
- 64157
- 66007
- 66071
- 64055
- 66104
- 66227
- 64114
- 64012
- 64156
- 64701
- 64110
- 64131
- 64078
- 64015
- 64081
- 64151
- 64109
- 64138
- 64052
- 66208
- 64127
- 66224
- 64056
- 64075
- 66212
- 64079
- 64134
- 66220
- 64080
- 64108
- 64112
- 64132
- 64063
- 66102
- 66209
- 64029
- 64154
- 64128
- 64024
- 64113
- 66213
- 66215
- 66053
- 66205
- 66226
- 64116
- 66018
- 66106
- 64057
- 66202
- 66103
- 64105
- 64106
- 64123
- 66112
- 64124
- 66064
- 66204
- 66083
- 66223
- 64129
- 66210
- 66203
- 66206
- 66101
- 64145
- 64153
- 66207
- 66219
- 66218
- 66043
- 64137
- 64747
- 64150
- 66211
- 64742
- 64136
- 64158
- 64734
- 66052
- 64034
- 64117
- 66111
- 64725
- 64146
- 64070
- 64126
- 64098
- 66214
- 64016
- 64062
- 64058
- 64048
- 64743
- 66020
- 64746
- 66012
- 64155
- 64444
- 64082
- 64125
- 66105
- 64139
- 66013
- 64739
- 64149
- 66021
- 64089
- 64163
- 64439
- 64088
- 64018
- 66054
- 66092
- 66042
- 66044
- 64028
- 64164
- 64211
- 64484
- 64492
- 66040
- 66134
- 66217
- 64030
- 64050
- 64053
- 64054
- 64061
- 64066
- 64068
- 64074
- 64084
- 64090
- 64101
- 64102
- 64115
- 64120
- 64161
- 64165
- 64172
- 64512
- 64640
- 66025
- 66072
- 66216
- 66225
- 66608
- 66742
- 64072
- 64118
- 64166
- 64167
- 66026
- 66109
Search homes for sale in every city we cover
| City | Market (Market type is set by months of supply — how long it would take to sell every home for sale at the current pace. Under ~4 months favors sellers (low inventory, faster sales, homes near or above asking); over ~6 favors buyers (more choice, more negotiating room). 4–6 is balanced.) | Months supply | Median list | Sell-to-list | Days to contract | For sale | Coming soon | Under contract |
|---|---|---|---|---|---|---|---|---|
| Archie | Seller's | 2.8 mo | Median$389,000 | 95% | 41d | 13 | 0 | 4 |
| Avondale | Strong Buyer's | 12 mo | Median— | 102% | — | 3 | 0 | 0 |
| Basehor | Seller's | 3.7 mo | Median$513,450 | 100% | 30d | 88 | 1 | 59 |
| Belton | Seller's | 2.7 mo | Median$324,900 | 100% | 23d | 78 | 2 | 38 |
| Birmingham | Strong Buyer's | 12 mo | Median— | 55% | — | 2 | 0 | 0 |
| Blue Springs | Seller's | 2.7 mo | Median$383,000 | 99% | 18d | 212 | 12 | 115 |
How we compute these
- Market.
- Market type is set by months of supply — how long it would take to sell every home for sale at the current pace. Under ~4 months favors sellers (low inventory, faster sales, homes near or above asking); over ~6 favors buyers (more choice, more negotiating room). 4–6 is balanced.
- Months supply.
- How many months it would take to sell every home now for sale at the pace of the last 90 days: homes for sale ÷ (closings in the last 90 days ÷ 3).
- Median list.
- The middle asking price among the homes for sale right now. Half are listed above it, half below.
- Days to contract.
- The middle number of days between a home being listed and going under contract, over the last 90 days of closings. It is not days-to-close, and it is not how long today's listings have been sitting. Newly built homes are excluded, because a build finishing is not a market moving.
- For sale.
- Homes listed as active right now. A live count, not a monthly average.
- Coming soon.
- Homes announced but not yet accepting showings. A live count.
- Under contract.
- Homes with an accepted contract that have not closed yet. A live count.
Show all 109 cities
- Archie
- Avondale
- Basehor
- Belton
- Birmingham
- Blue Springs
- Bonner Springs
- Buckner
- Bucyrus
- Camden Point
- Claycomo
- Cleveland
- Creighton
- De Soto
- Dearborn
- Drexel
- East Lynne
- Easton
- Edgerton
- Edgerton
- Edwardsville
- Eudora
- Excelsior Springs
- Fairway
- Farley
- Ferrelview
- Fontana
- Freeman
- Gallatin
- Garden City
- Gardner
- Gladstone
- Grain Valley
- Grandview
- Greenwood
- Harrisonville
- Holt
- Houston Lake
- Independence
- Kansas City, MO
- Kansas City
- Kearney
- Kingsville
- Lacygne
- Lake Lotawana
- Lake Quivira
- Lake Tapawingo
- Lake Waukomis
- Lake Winnebago
- Lane
- Lansing
- Lawrence
- Lawson
- Leavenworth
- Leawood
- Lee's Summit
- Lenexa
- Levasy
- Liberty
- Linwood
- Loch Lloyd
- Lone Jack
- Louisburg
- McLouth
- Merriam
- Mission
- Mission Hills
- Mission Woods
- Missouri City
- Napoleon
- North Kansas City
- Northmoor
- Oak Grove
- Oakview
- Olathe
- Osawatomie
- Overland Park
- Paola
- Parker
- Parkville
- Peculiar
- Platte City
- Platte Woods
- Pleasant Hill
- Pleasant Valley
- Prairie Village
- Prathersville
- Raymore
- Raytown
- Riverside
- Roeland Park
- Rushville
- Shawnee
- Sibley
- Smithville
- Spring Hill
- Stilwell
- Strasburg
- Sugar Creek
- Tonganoxie
- Tracy
- Trimble
- Village Of Loch Lloyd
- Village Of Oaks
- Weatherby Lake
- Wellsville
- Weston
- Westwood
- Westwood Hills
Search for homes in popular markets
| Market | For sale |
|---|---|
| Seven Bridges | For sale27 |
| Canyon Lakes | For sale27 |
| Garrett Ranch | For sale27 |
| Heritage Ranch | For sale26 |
| Falcon Lakes | For sale25 |
| Madison Valley | For sale22 |
How we compute these
- Market.
- Market type is set by months of supply — how long it would take to sell every home for sale at the current pace. Under ~4 months favors sellers (low inventory, faster sales, homes near or above asking); over ~6 favors buyers (more choice, more negotiating room). 4–6 is balanced.
- For sale.
- Homes listed as active right now. A live count, not a monthly average.
Show all 52 popular markets
- Seven Bridges
- Canyon Lakes
- Garrett Ranch
- Heritage Ranch
- Falcon Lakes
- Madison Valley
- Southern Meadows
- Wild Horse
- Parkside Reserve
- Prairie Farms
- Tapp Farms
- Woodland Hills
- Boulder Creek
- Woodmyre
- Tomahawk Valley
- Dayton Creek
- Chapel Hill
- Stonebridge Pointe
- The Meadows At Greenfield
- Ashton Farms
- Heritage Farms
- WaterCrest Landing
- Providence Pointe
- Ruskin Heights
- The View
- Marlborough Heights
- Piper Creek Estates
- Stonebridge Villas
- Prairie Canyon
- Thousand Oaks
- Bristol Highlands
- Riverstone Valley
- Oaks of Edgewood
- Vista Village
- Creekmoor - Cunningham
- Far View Heights
- Manor at Bailey Farms
- The Manhattan Condominiums
- Staley Farms
- Dwyer Farms
- East Village of Leawood
- Soho Lofts
- Wyandotte City
- Sundance Ridge- Archers Landing
- Riverstone
- Prairie Trace
- Woodlawn Estates
- Fountains of Wolf Creek
- Canyon Creek Forest
- Wiswell Farms
- Santa Fe Place
- Wolf Run
Search homes by county
| Place | Market (Market type is set by months of supply — how long it would take to sell every home for sale at the current pace. Under ~4 months favors sellers (low inventory, faster sales, homes near or above asking); over ~6 favors buyers (more choice, more negotiating room). 4–6 is balanced.) | Months supply | Median list | Sell-to-list | Days to contract | For sale | Coming soon | Under contract |
|---|---|---|---|---|---|---|---|---|
| Jackson County, MO | Seller's | 3.8 mo | Median$270,000 | 98% | 22d | 3,043 | 113 | 1,046 |
| Clay County, MO | Seller's | 2.8 mo | Median$375,000 | 98% | 20d | 902 | 34 | 423 |
| Cass County, MO | Balanced | 4.5 mo | Median$358,968 | 99% | 28d | 680 | 18 | 225 |
| Platte County, MO | Seller's | 3.7 mo | Median$439,950 | 98% | 23d | 513 | 29 | 183 |
| Johnson County, KS | Seller's | 2.8 mo | Median$599,000 | 100% | 17d | 2,114 | 109 | 1,043 |
| Wyandotte County, KS | Seller's | 3.8 mo | Median$247,900 | 96% | 23d | 518 | 23 | 179 |
| Leavenworth County, KS | Balanced | 4.7 mo | Median$284,900 | 97% | 28d | 472 | 10 | 155 |
| Miami County, KS | Balanced | 5 mo | Median$314,900 | 97% | 34d | 255 | 9 | 74 |
How we compute these
- Market.
- Market type is set by months of supply — how long it would take to sell every home for sale at the current pace. Under ~4 months favors sellers (low inventory, faster sales, homes near or above asking); over ~6 favors buyers (more choice, more negotiating room). 4–6 is balanced.
- Months supply.
- How many months it would take to sell every home now for sale at the pace of the last 90 days: homes for sale ÷ (closings in the last 90 days ÷ 3).
- Median list.
- The middle asking price among the homes for sale right now. Half are listed above it, half below.
- Days to contract.
- The middle number of days between a home being listed and going under contract, over the last 90 days of closings. It is not days-to-close, and it is not how long today's listings have been sitting. Newly built homes are excluded, because a build finishing is not a market moving.
- For sale.
- Homes listed as active right now. A live count, not a monthly average.
- Coming soon.
- Homes announced but not yet accepting showings. A live count.
- Under contract.
- Homes with an accepted contract that have not closed yet. A live count.