
64150 (Riverside, MO) Real Estate & Homes For Sale
· 26 homes for sale in 64150HouseLoop Vision identified 15 homes for sale in 64150 with white kitchen cabinets, 7 with a freestanding tub, 1 with a pool, 1 with a home gym, 20 with a big backyard and 13 with a finished basement, plus 4 more features. See what HouseLoop Vision found
26 homes for sale in 64150 · Sorted by Newest Listed
Real estate in 64150 in Riverside, Missouri
Riverside 64150 has about 1,714 households and a median household income of $58,846. Roughly 45% of homes are owner-occupied, the median owner's home value is $394,000, 36% of adults hold a bachelor's degree or higher. The average commute runs 21.1 minutes. About 4,463 people live in Riverside 64150, per the U.S. Census Bureau's American Community Survey 5-year estimate (2020–2024).
Riverside 64150 has 26 homes for sale right now, with a median list price of $742,450. These homes were built between 1952 and 2026. They range from 1,612 to 4,200 square feet.
Housing market trends in 64150 in Riverside, Missouri
| Measure | Aug–Oct 2026 | May–Jul 2026 | Aug–Oct 2025 |
|---|---|---|---|
| Median sale price | $820,335 | $547,500 | $750,000 |
| Median price per sq ft | $252 | $202 | $206 |
| Sell-to-list ratio | 100% | 100% | 98% |
| Homes sold, three months | 17 | 23 | 19 |
| New listings | 18 | 19 | 20 |
| Went under contract | 12 | 20 | 12 |
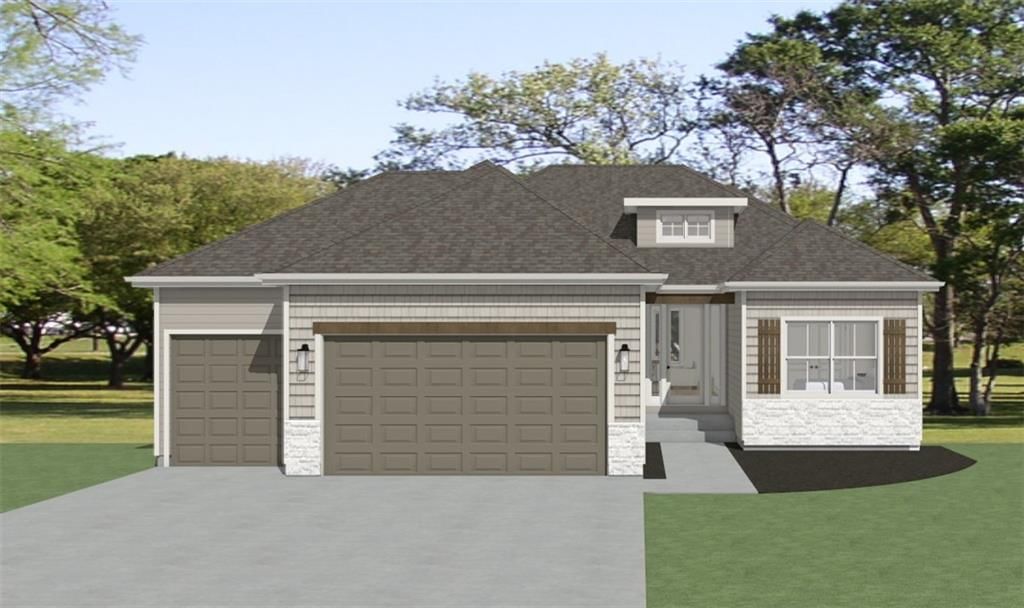
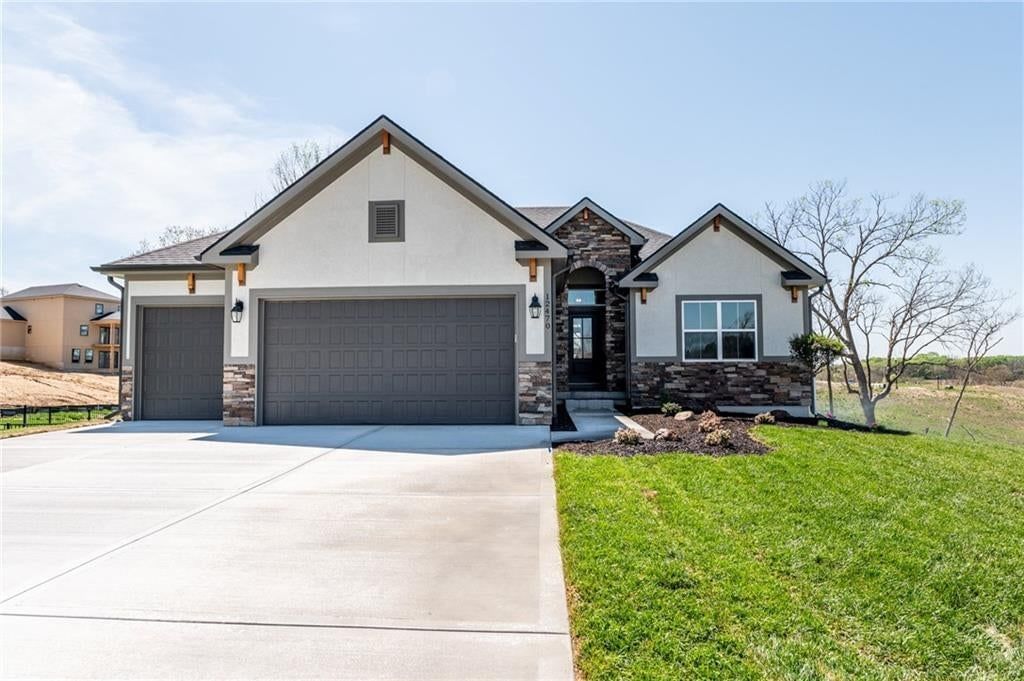
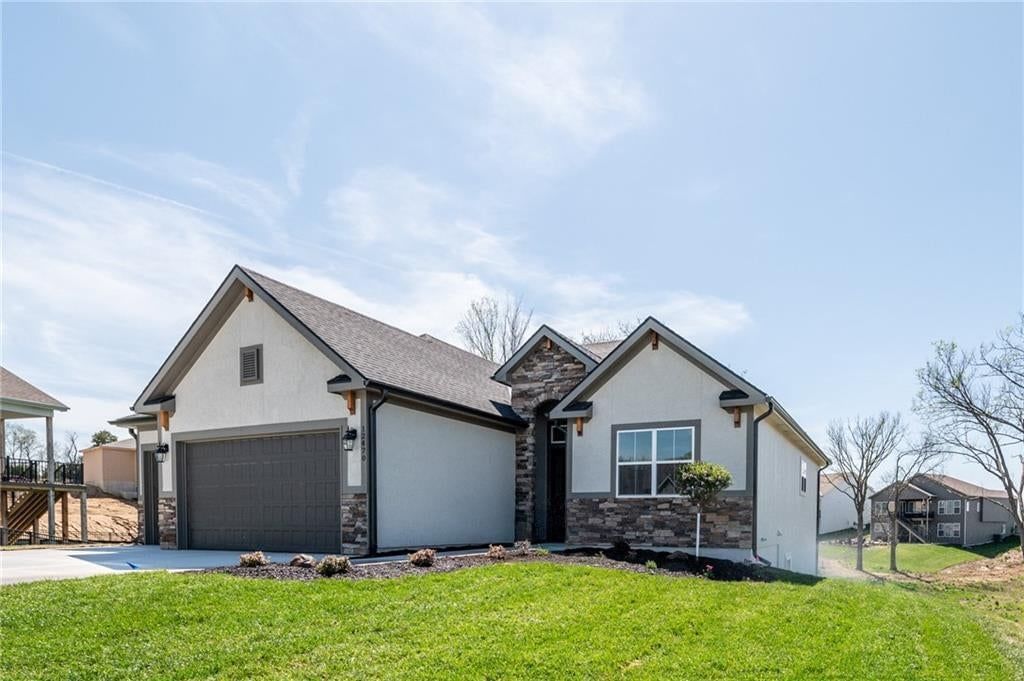
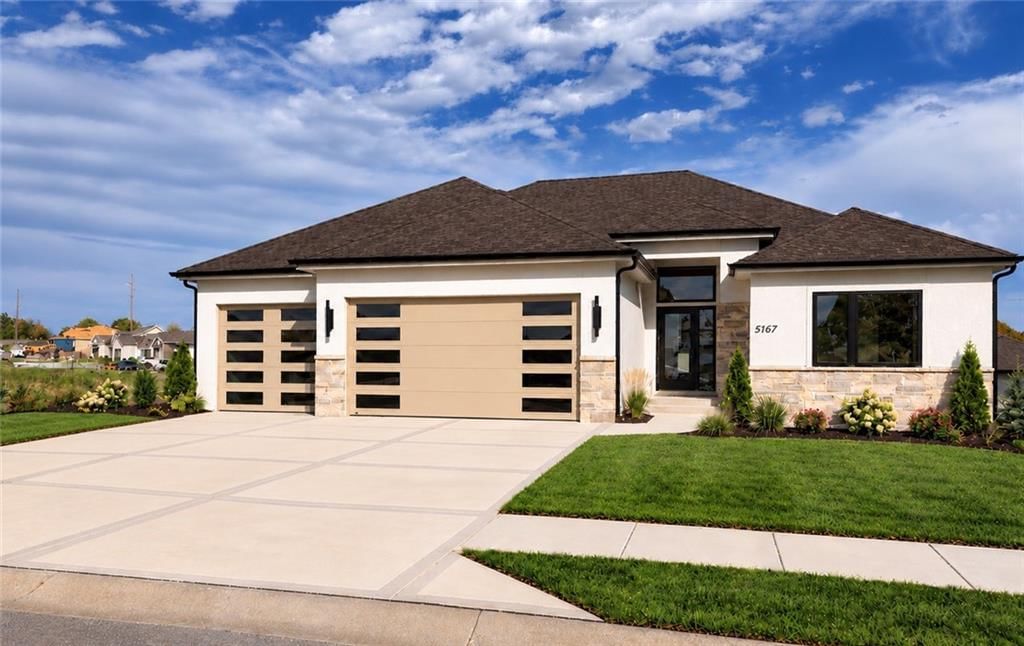
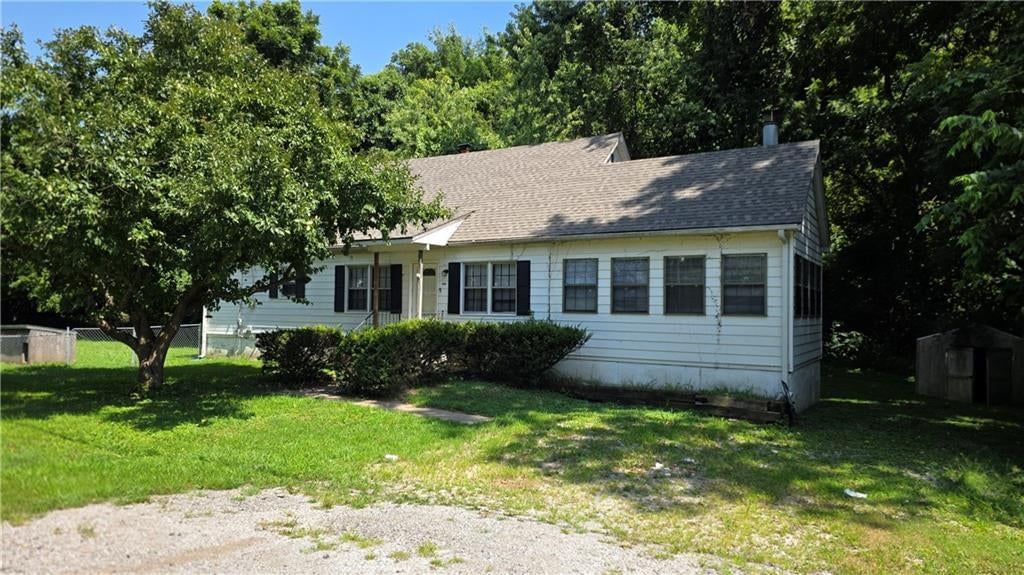
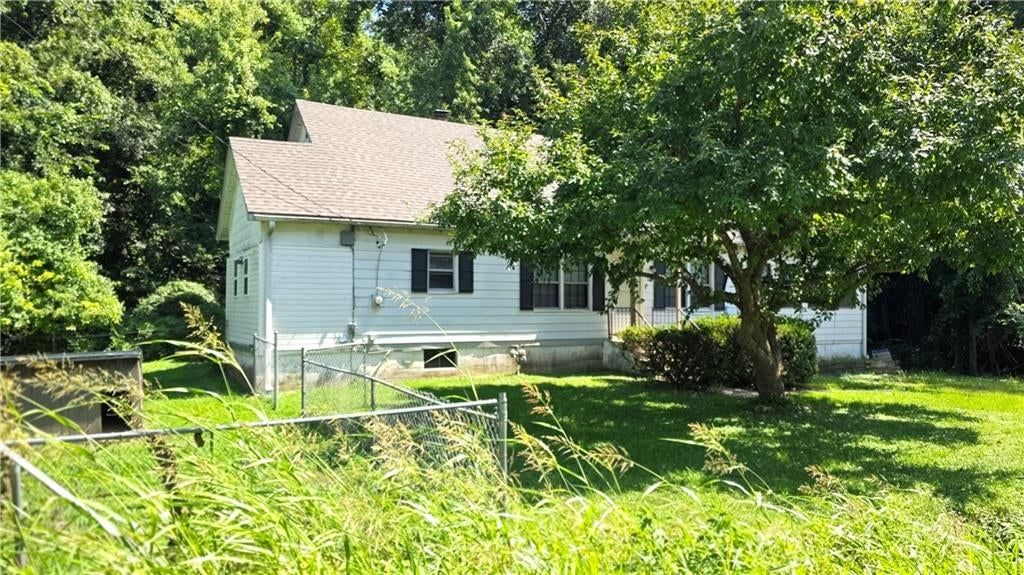
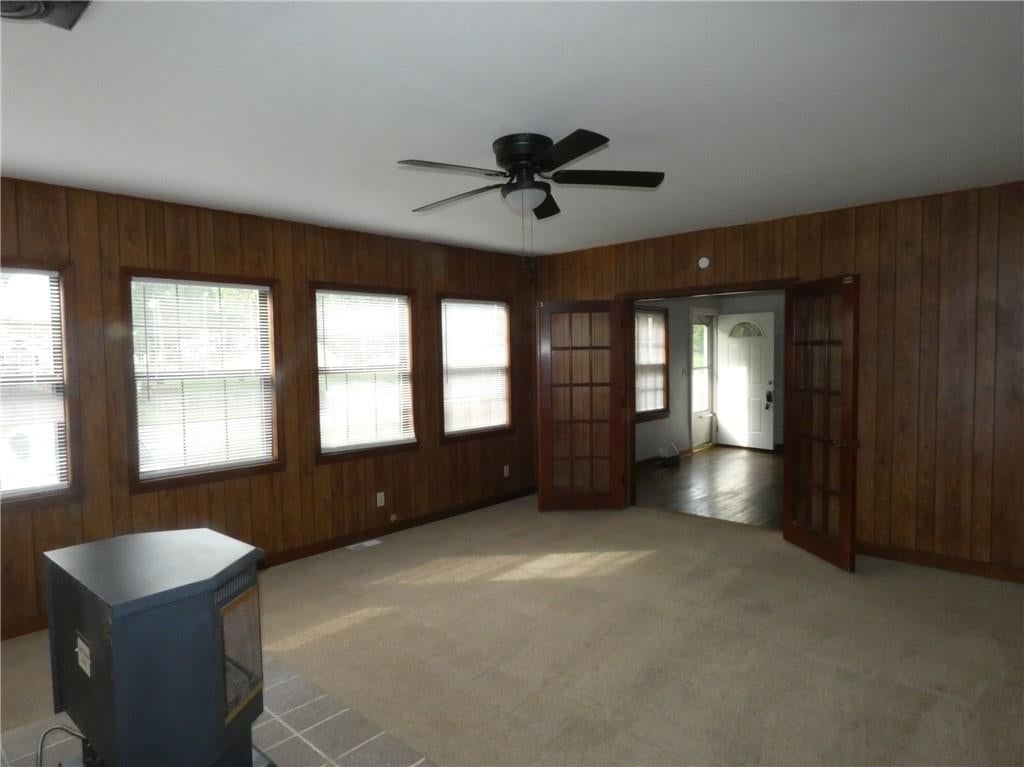
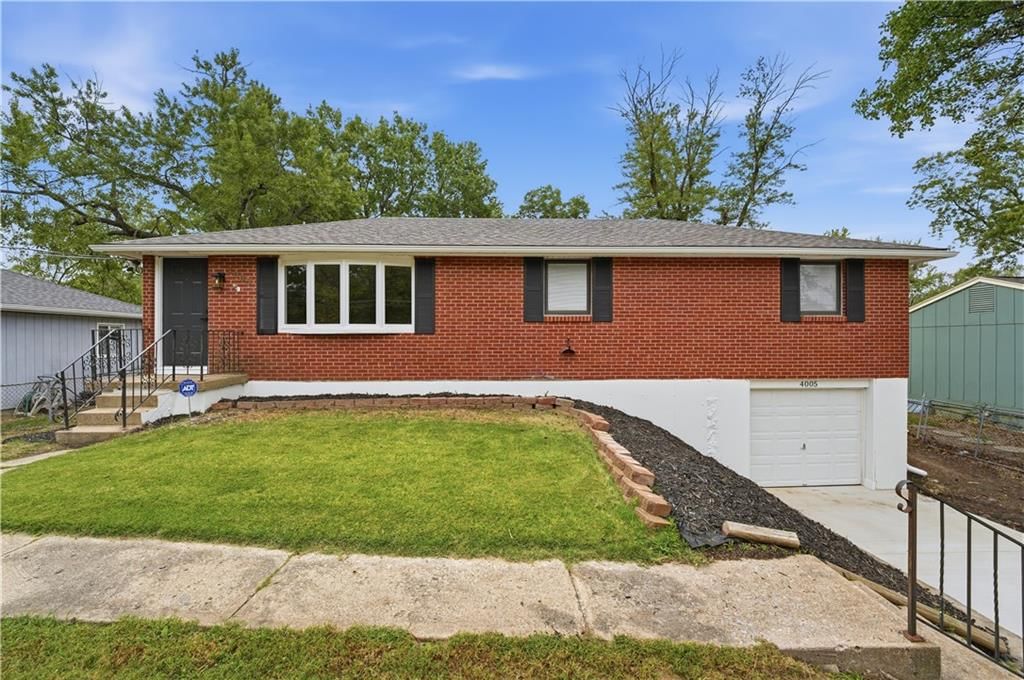
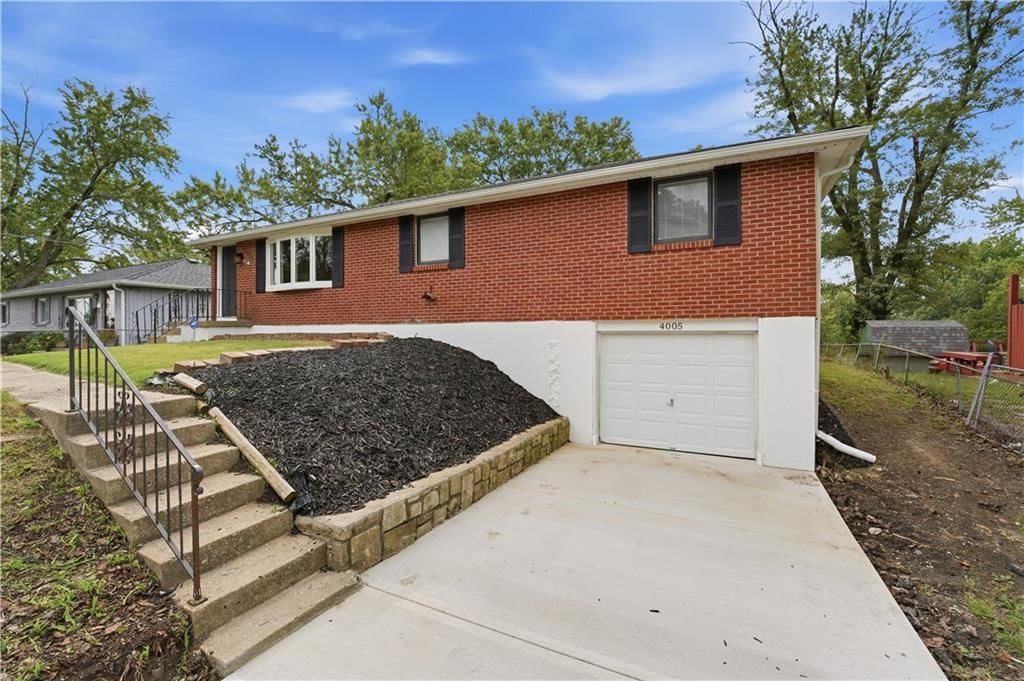
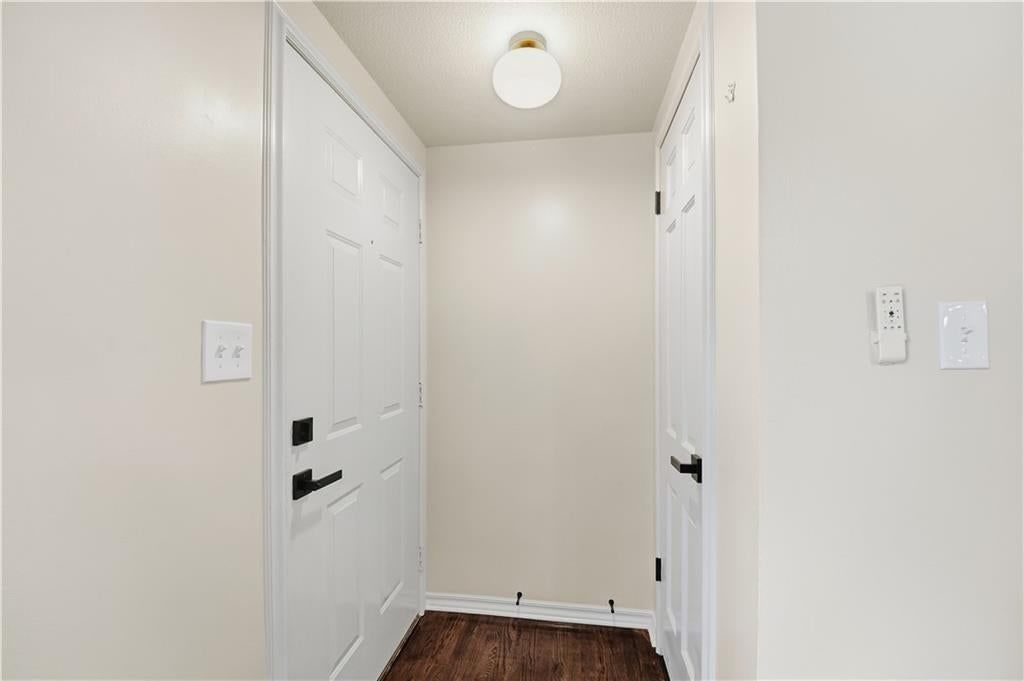
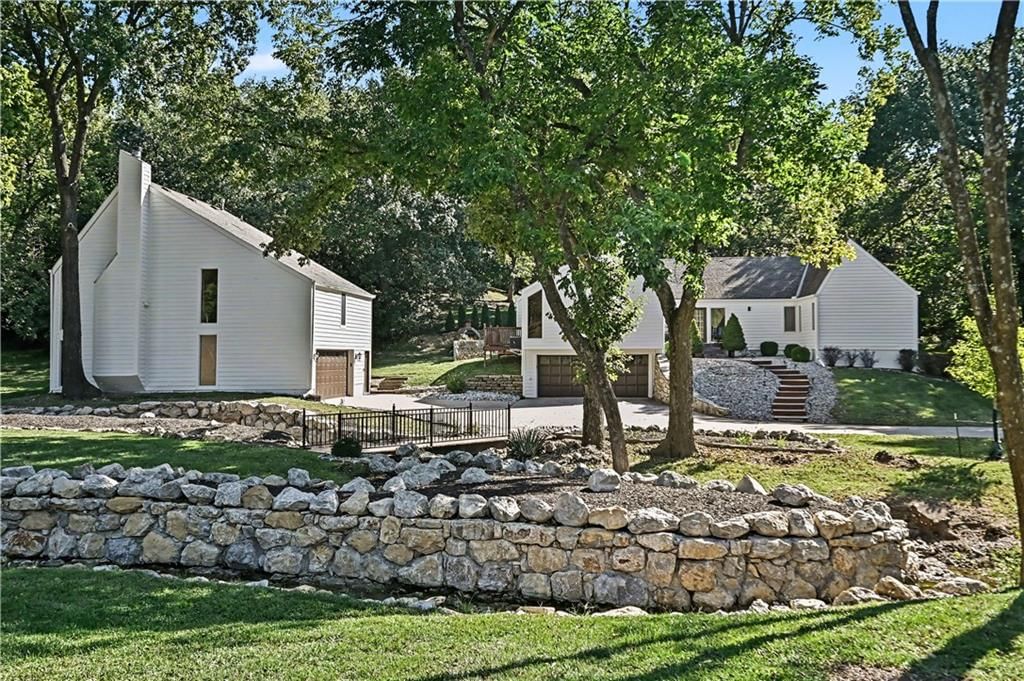
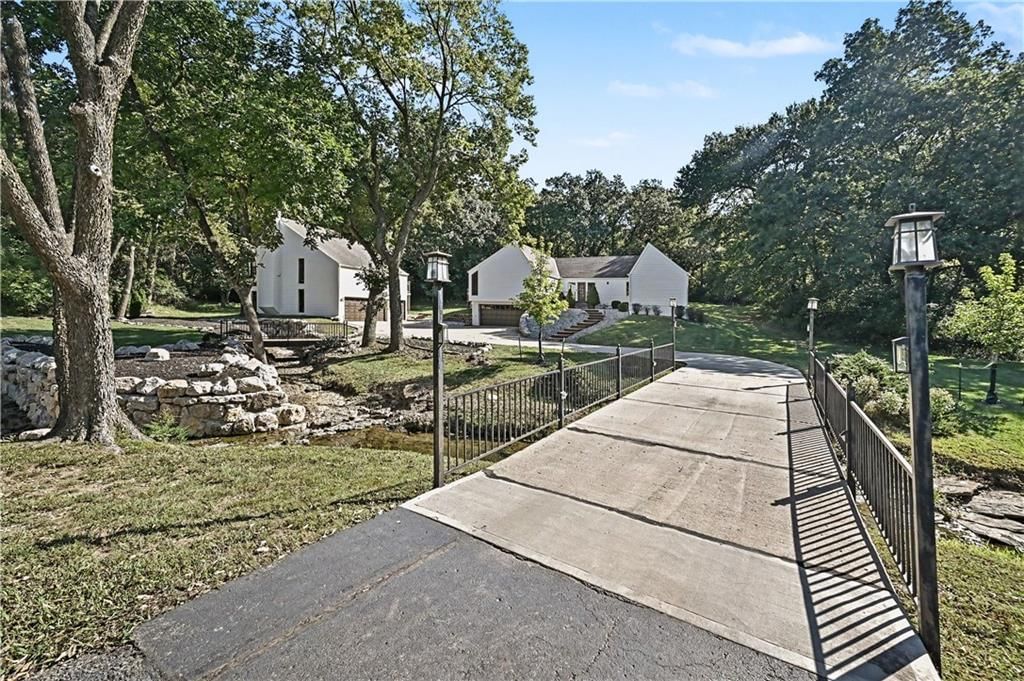
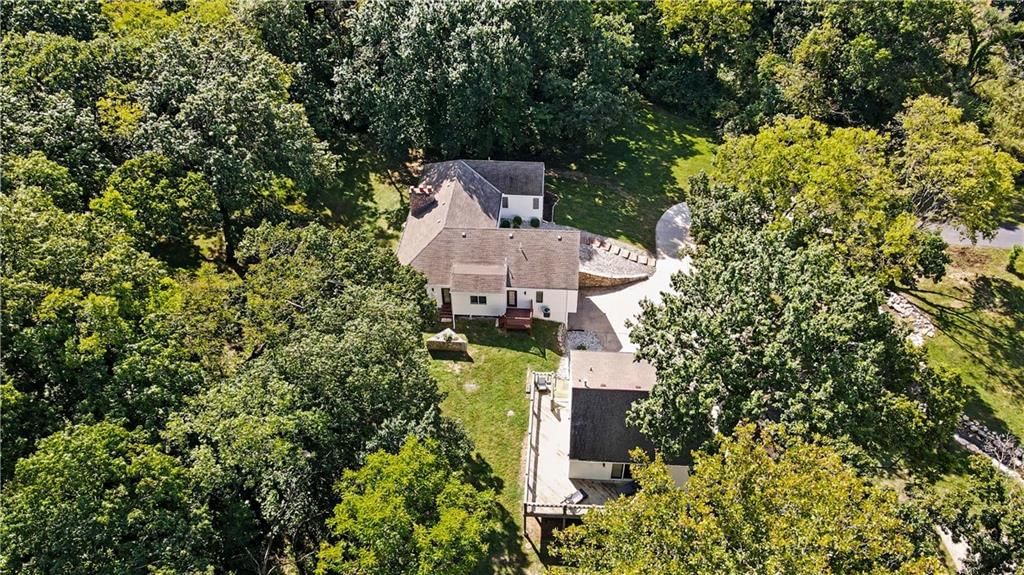
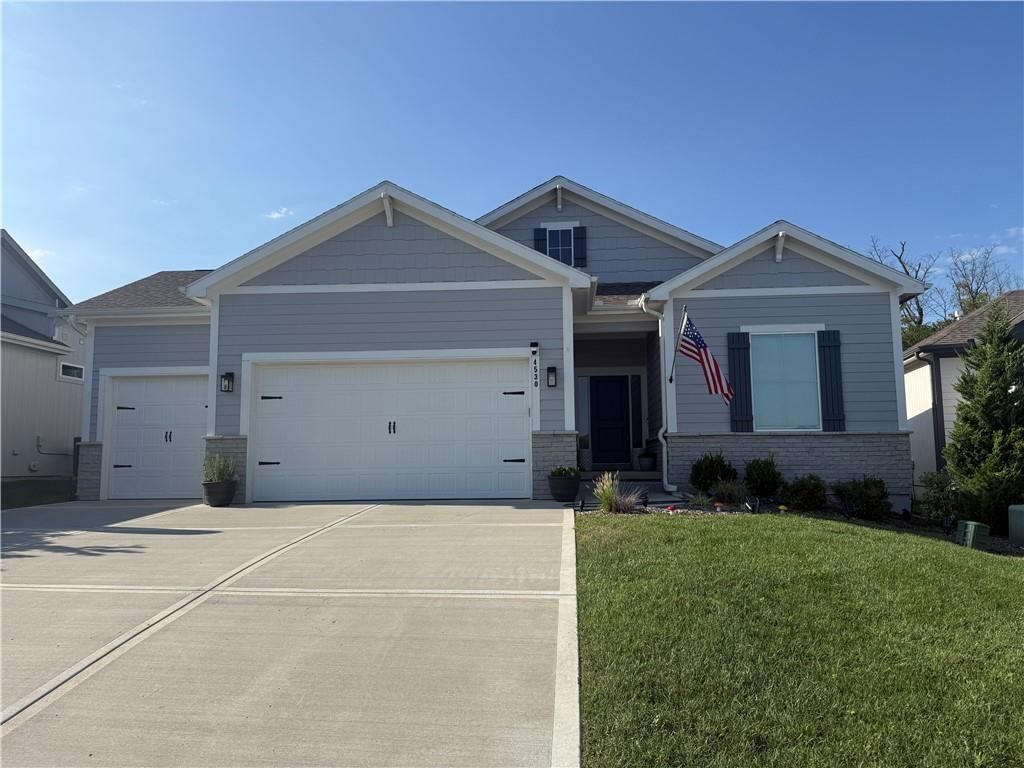
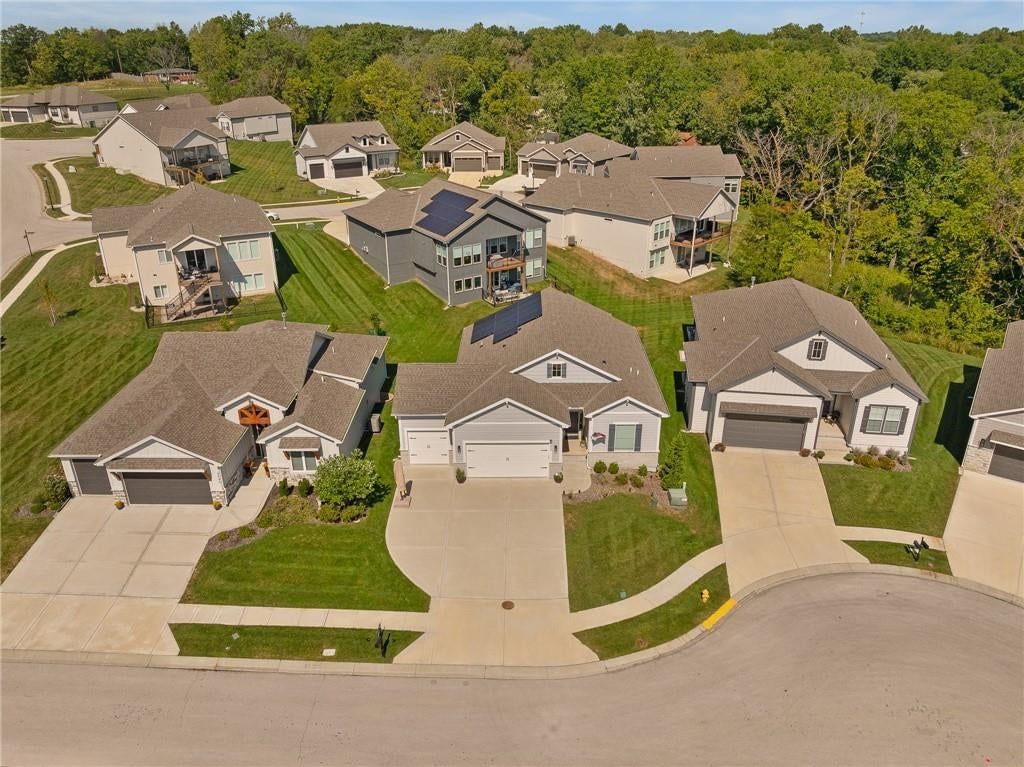
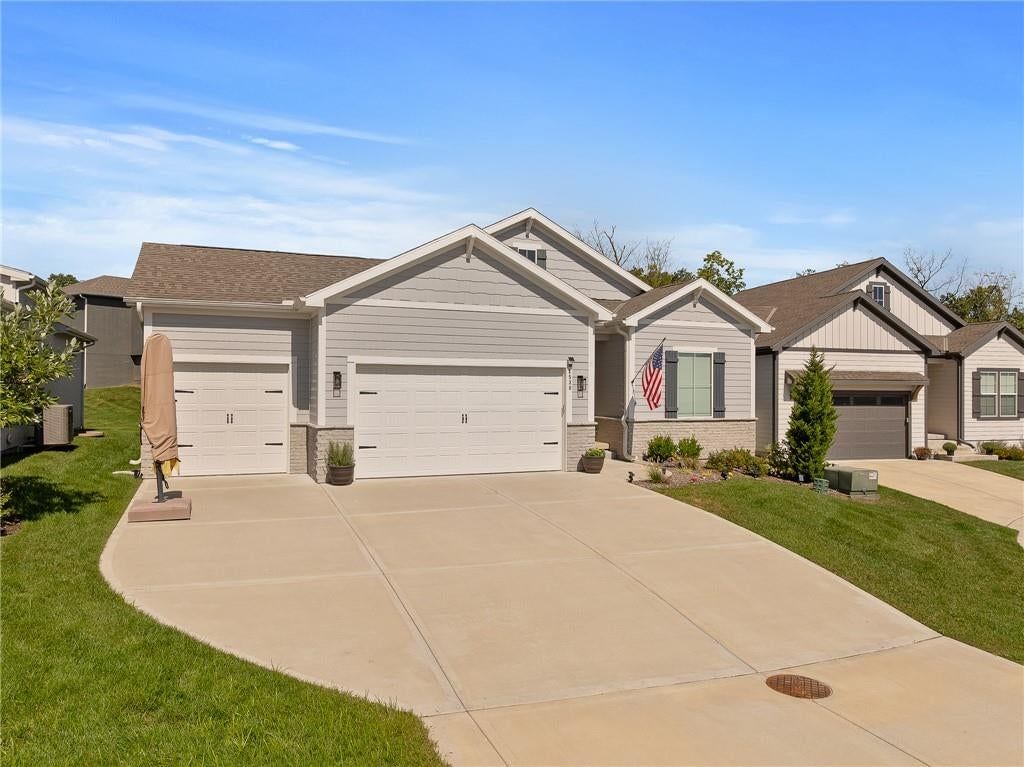
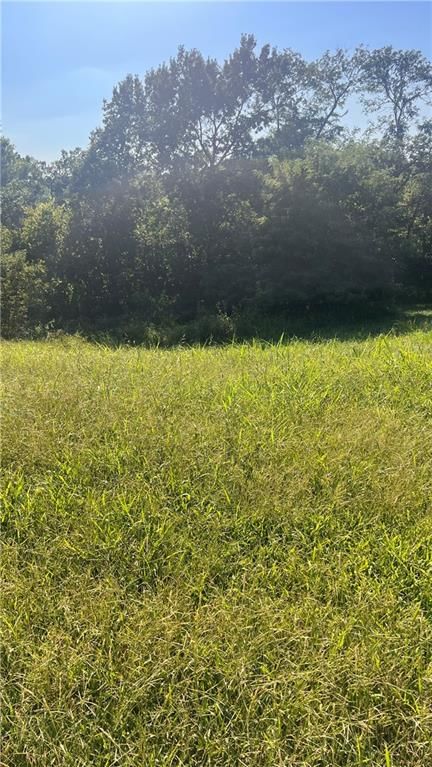
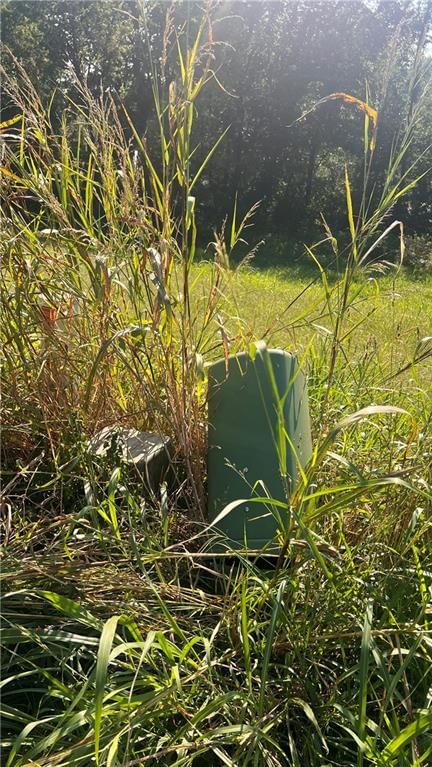
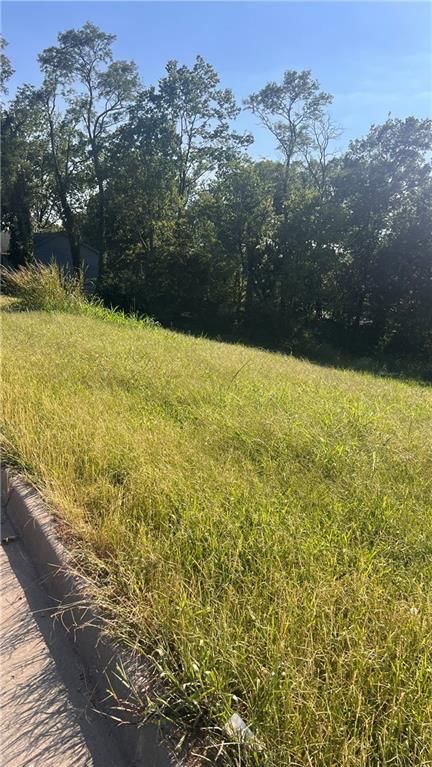
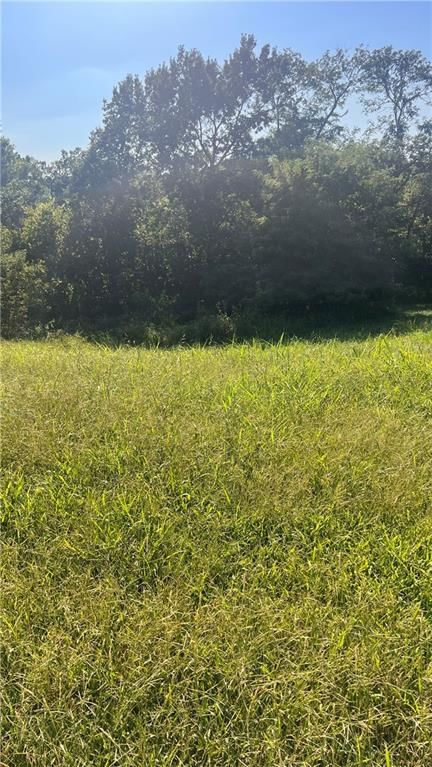
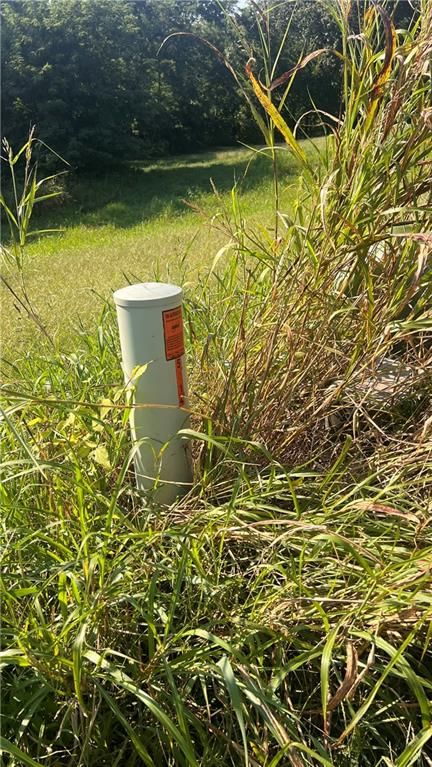
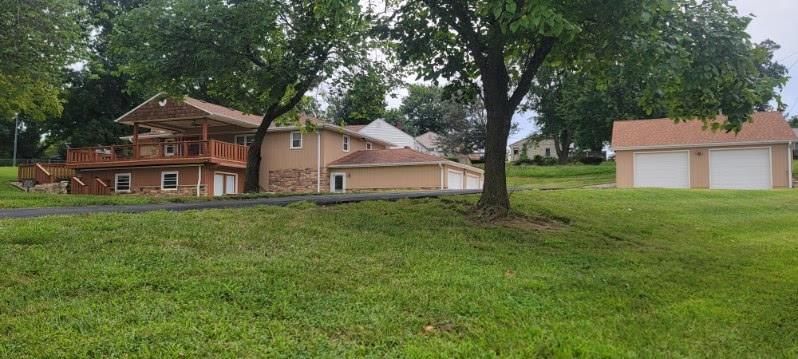
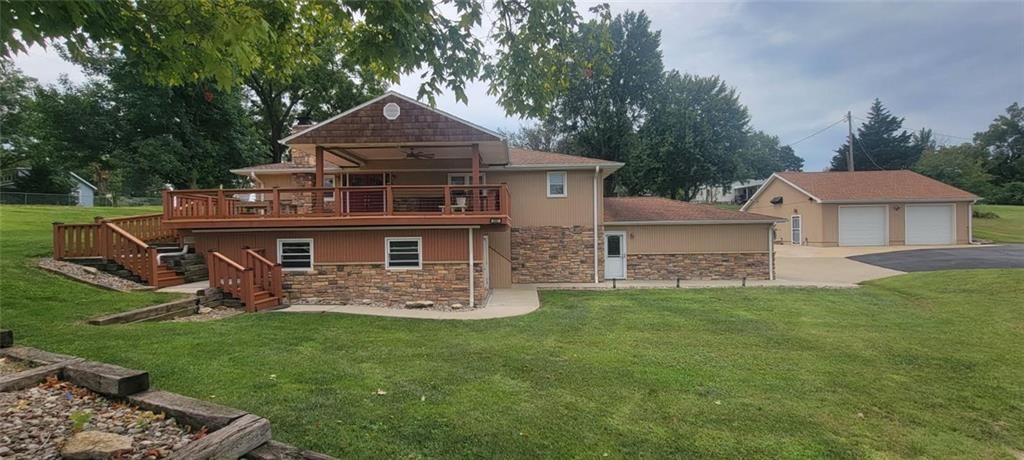
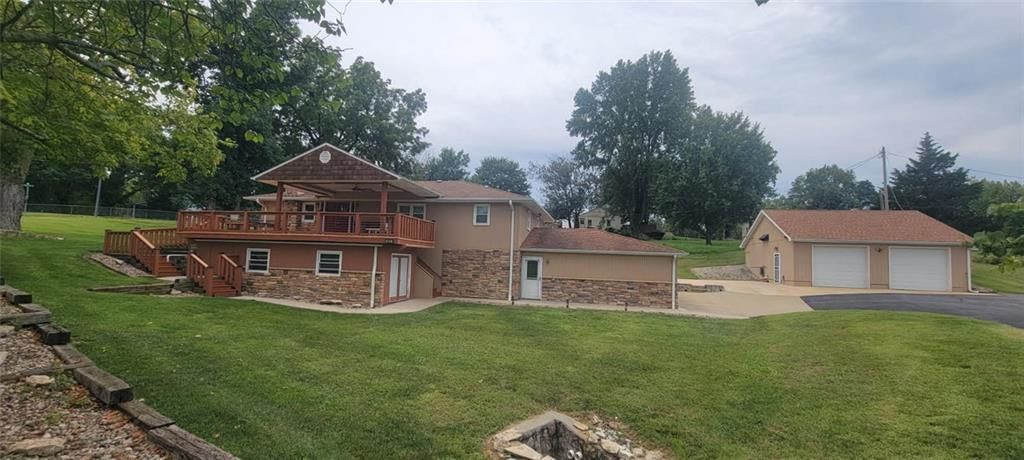

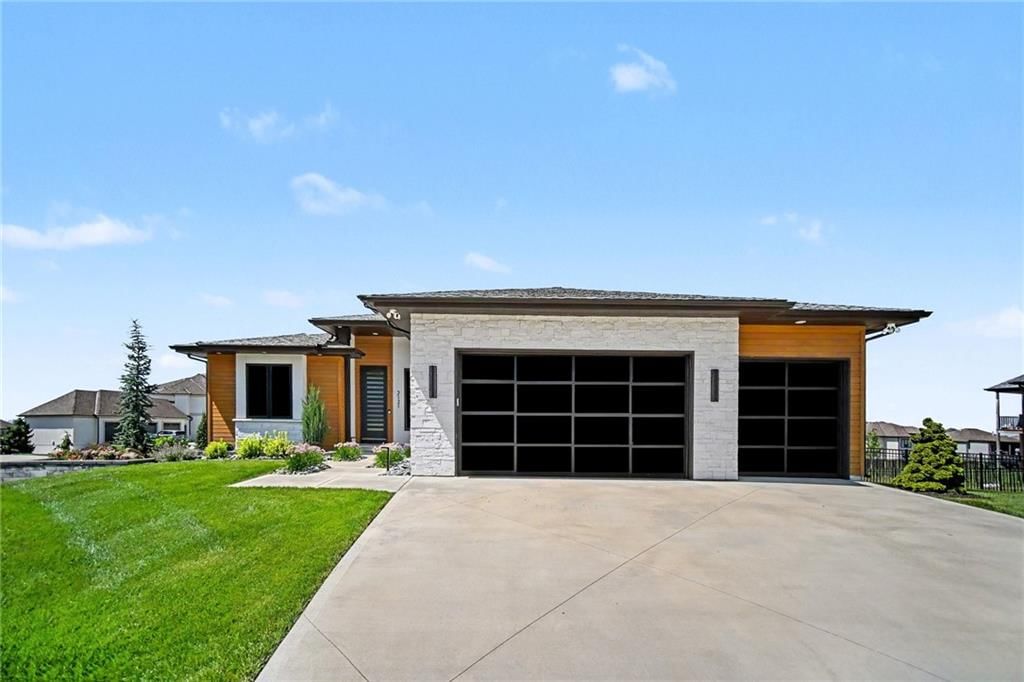
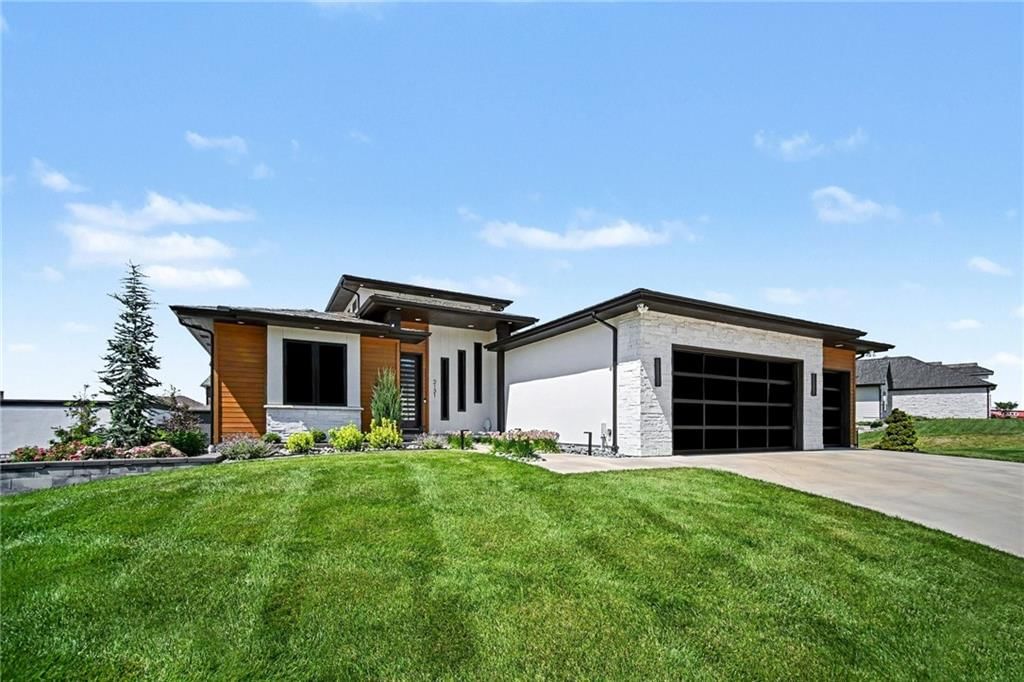
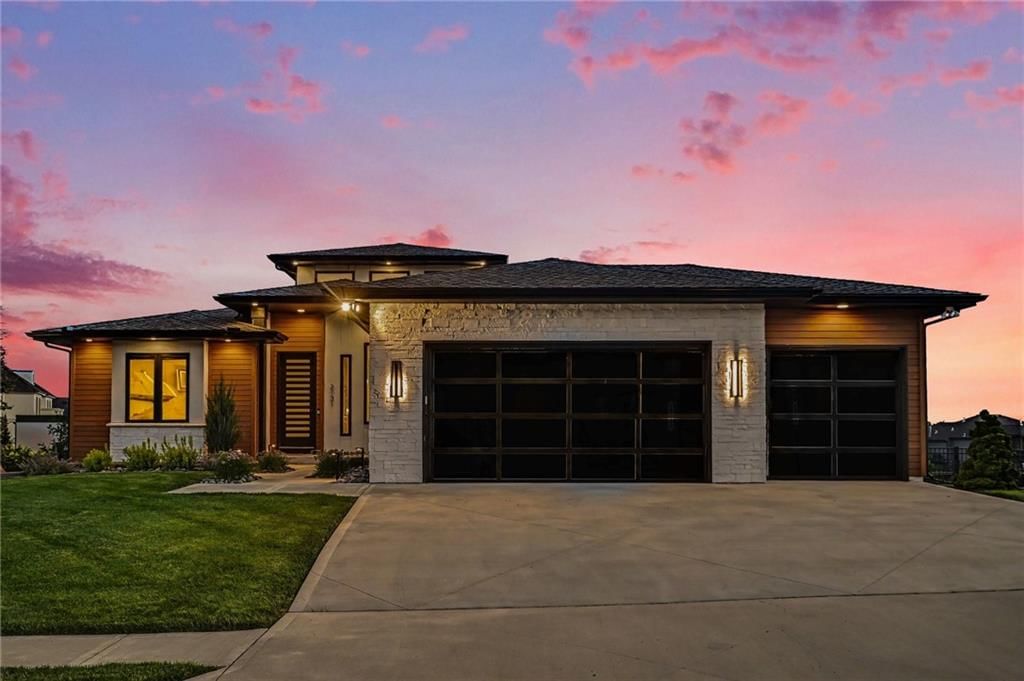


HouseLoop Vision in 64150
As of Nov 13, 2026
HouseLoop Vision identified 15 homes for sale in 64150 with white kitchen cabinets, 7 with a freestanding tub, 1 with a pool, 1 with a home gym, 20 with a big backyard and 13 with a finished basement, plus 4 more features.
HouseLoop Vision has looked at the photos of all 26 homes for sale in 64150.
| HouseLoop Vision feature | Homes for sale | Where HouseLoop Vision saw it |
|---|---|---|
| White kitchen cabinets | 15 | 4867 NW Vicolo Dellamore Way (photo 12) |
| Freestanding tub | 7 | 5163 NW 47th Terrace (photo 29) |
| Pool | 1 | |
| Home gym | 1 | |
| Big backyard | 20 | 4813 NW Northwood Road (photo 3) |
| Finished basement | 13 | |
| Kitchen island | 17 | |
| Two-story living room | 9 | |
| Fenced yard | 3 | 4701 NW Green Hills Road (photo 2) |
| 3-car garage | 10 |
Key HouseLoop Vision features
- White kitchen cabinets
- Freestanding tub
- Pool
- Home gym
- Big backyard
- Finished basement
- Kitchen island
- Two-story living room
- Fenced yard
- 3-car garage
Questions buyers ask about 64150
- How many homes for sale in 64150 have white kitchen cabinets?
- HouseLoop Vision identified 15 homes for sale in 64150 with white kitchen cabinets. One is 4867 NW Vicolo Dellamore Way (photo 12).
- How many homes for sale in 64150 have a freestanding tub?
- HouseLoop Vision identified 7 homes for sale in 64150 with a freestanding tub. One is 5163 NW 47th Terrace (photo 29).
- How many homes for sale in 64150 have a pool?
- HouseLoop Vision identified 1 home for sale in 64150 with a pool.
- How many homes for sale in 64150 have a home gym?
- HouseLoop Vision identified 1 home for sale in 64150 with a home gym.
- How many homes for sale in 64150 have a big backyard?
- HouseLoop Vision identified 20 homes for sale in 64150 with a big backyard. One is 4813 NW Northwood Road (photo 3).
Schools serving 64150
| School | Median list | For sale |
|---|---|---|
| School districts | ||
| Park Hill School District | Median— | — |
| High schools | ||
| Park Hill South | Median— | — |
| Middle schools | ||
| Walden | Median— | — |
| Elementary schools | ||
| South East | Median— | — |
| Southeast | Median— | — |
| Line Creek | Median— | — |
How we compute these
- Median list.
- The middle asking price among the homes for sale right now. Half are listed above it, half below.
- For sale.
- Homes listed as active right now. A live count, not a monthly average.
Homes by feature in 64150
| Feature | For sale |
|---|---|
| Homes with a public sewer | For sale24 |
| Homes with public water | For sale23 |
| Two or more stories | For sale21 |
| 2+ full bathrooms | For sale21 |
How we compute these
- For sale.
- Homes listed as active right now. A live count, not a monthly average.
Nearby neighborhoods to Riverside
| Neighborhood | Market (Market type is set by months of supply — how long it would take to sell every home for sale at the current pace. Under ~4 months favors sellers (low inventory, faster sales, homes near or above asking); over ~6 favors buyers (more choice, more negotiating room). 4–6 is balanced.) | Months supply | For sale | Median sale | Sell-to-list | Days to contract | Coming soon | Under contract |
|---|---|---|---|---|---|---|---|---|
| Montebella | Seller's | 3.2 mo | 7 | Median$771,135 | 100% | 49d | 0 | 5 |
| BELLA RIDGE | Strong Buyer's | 9.6 mo | 8 | Median$717,220 | 101% | 4d | 0 | 0 |
How we compute these
- Market.
- Market type is set by months of supply — how long it would take to sell every home for sale at the current pace. Under ~4 months favors sellers (low inventory, faster sales, homes near or above asking); over ~6 favors buyers (more choice, more negotiating room). 4–6 is balanced.
- Months supply.
- How many months it would take to sell every home now for sale at the pace of the last 90 days: homes for sale ÷ (closings in the last 90 days ÷ 3).
- For sale.
- Homes listed as active right now. A live count, not a monthly average.
- Days to contract.
- The middle number of days between a home being listed and going under contract, over the last 90 days of closings. It is not days-to-close, and it is not how long today's listings have been sitting. Newly built homes are excluded, because a build finishing is not a market moving.
- Coming soon.
- Homes announced but not yet accepting showings. A live count.
- Under contract.
- Homes with an accepted contract that have not closed yet. A live count.
Search homes nearby 64150
| Place | Market (Market type is set by months of supply — how long it would take to sell every home for sale at the current pace. Under ~4 months favors sellers (low inventory, faster sales, homes near or above asking); over ~6 favors buyers (more choice, more negotiating room). 4–6 is balanced.) | Months supply | Median list | Sell-to-list | Days to contract | For sale | Coming soon | Under contract |
|---|---|---|---|---|---|---|---|---|
| Riverside | Balanced | 5.1 mo | Median$735,000 | 101% | 22d | 27 | 0 | 10 |
| Kansas City | Seller's | 3.9 mo | Median$259,000 | 100% | 21d | 2,180 | 86 | 767 |
| Parkville | Seller's | 3.9 mo | Median$536,950 | 97% | 35d | 101 | 6 | 30 |
| Platte City | Balanced | 4.3 mo | Median$525,000 | 97% | 25d | 82 | 2 | 26 |
| Weston | Balanced | 5 mo | Median$430,000 | 96% | 28d | 12 | 0 | 7 |
How we compute these
- Market.
- Market type is set by months of supply — how long it would take to sell every home for sale at the current pace. Under ~4 months favors sellers (low inventory, faster sales, homes near or above asking); over ~6 favors buyers (more choice, more negotiating room). 4–6 is balanced.
- Months supply.
- How many months it would take to sell every home now for sale at the pace of the last 90 days: homes for sale ÷ (closings in the last 90 days ÷ 3).
- Median list.
- The middle asking price among the homes for sale right now. Half are listed above it, half below.
- Days to contract.
- The middle number of days between a home being listed and going under contract, over the last 90 days of closings. It is not days-to-close, and it is not how long today's listings have been sitting. Newly built homes are excluded, because a build finishing is not a market moving.
- For sale.
- Homes listed as active right now. A live count, not a monthly average.
- Coming soon.
- Homes announced but not yet accepting showings. A live count.
- Under contract.
- Homes with an accepted contract that have not closed yet. A live count.
Nearby ZIP codes
| Place | Market (Market type is set by months of supply — how long it would take to sell every home for sale at the current pace. Under ~4 months favors sellers (low inventory, faster sales, homes near or above asking); over ~6 favors buyers (more choice, more negotiating room). 4–6 is balanced.) | Months supply | Median list | Sell-to-list | Days to contract | For sale | Coming soon | Under contract |
|---|---|---|---|---|---|---|---|---|
| 64050 | Seller's | 3.6 mo | Median$175,000 | 97% | 21d | 75 | 0 | 34 |
How we compute these
- Market.
- Market type is set by months of supply — how long it would take to sell every home for sale at the current pace. Under ~4 months favors sellers (low inventory, faster sales, homes near or above asking); over ~6 favors buyers (more choice, more negotiating room). 4–6 is balanced.
- Months supply.
- How many months it would take to sell every home now for sale at the pace of the last 90 days: homes for sale ÷ (closings in the last 90 days ÷ 3).
- Median list.
- The middle asking price among the homes for sale right now. Half are listed above it, half below.
- Days to contract.
- The middle number of days between a home being listed and going under contract, over the last 90 days of closings. It is not days-to-close, and it is not how long today's listings have been sitting. Newly built homes are excluded, because a build finishing is not a market moving.
- For sale.
- Homes listed as active right now. A live count, not a monthly average.
- Coming soon.
- Homes announced but not yet accepting showings. A live count.
- Under contract.
- Homes with an accepted contract that have not closed yet. A live count.