
Meet Myli.
Your home search companion
The smarter way to find your next home.
Meet Myliyour home search companion.
She helps youfind homesget insightsbook tours
She knows the block
Schools, the commute, and what sold two doors down.


Your journey with Myli
0 of 5 2,090 homes for sale
Kansas City
Most homes $170K–$500KDowntown KC508,090 people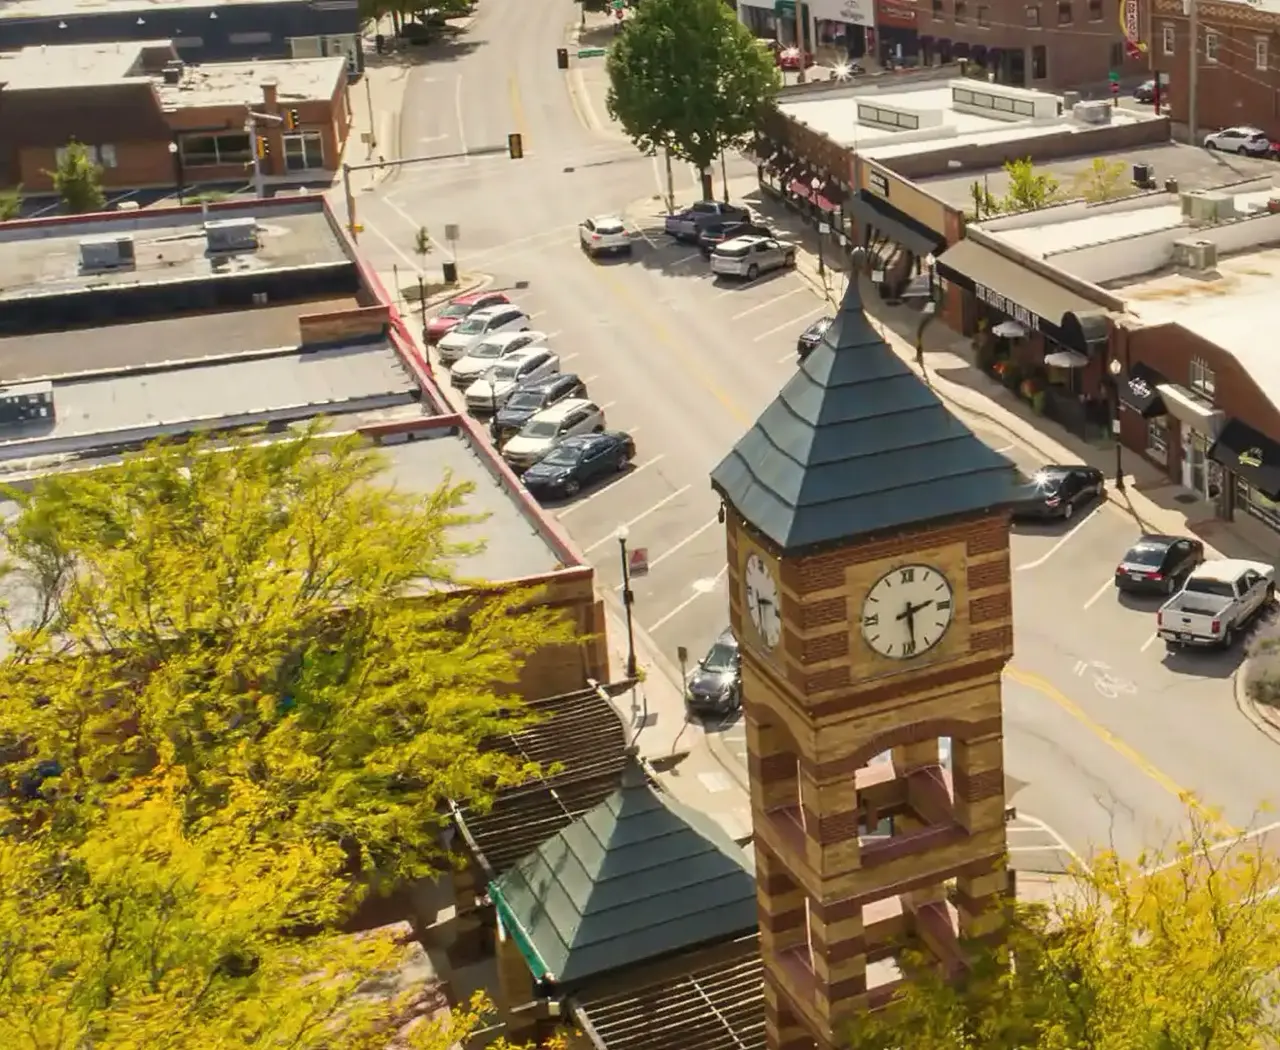 494 homes for sale
Overland Park
Most homes $525K–$1.3M24 min to downtown KC197,238 people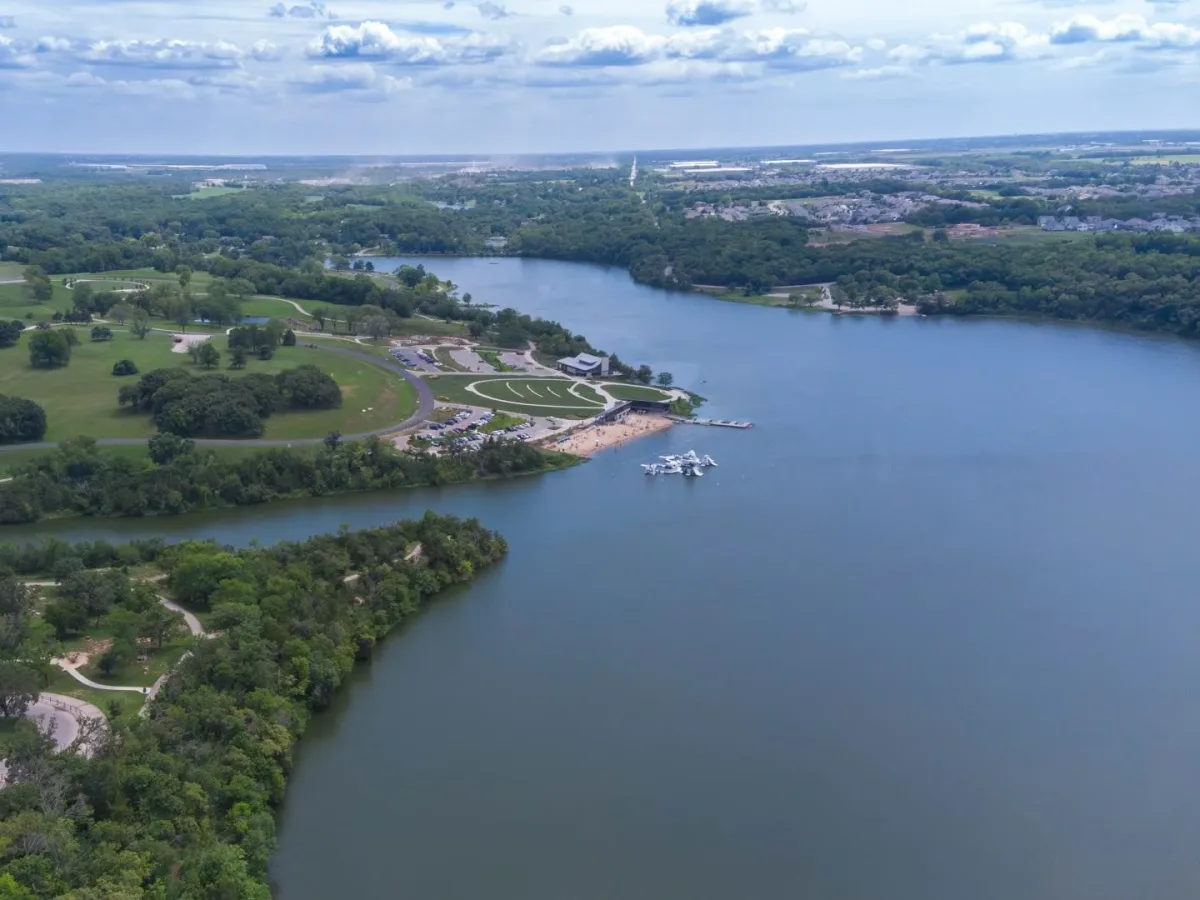 526 homes for sale
Olathe
Most homes $500K–$770K28 min to downtown KC141,290 people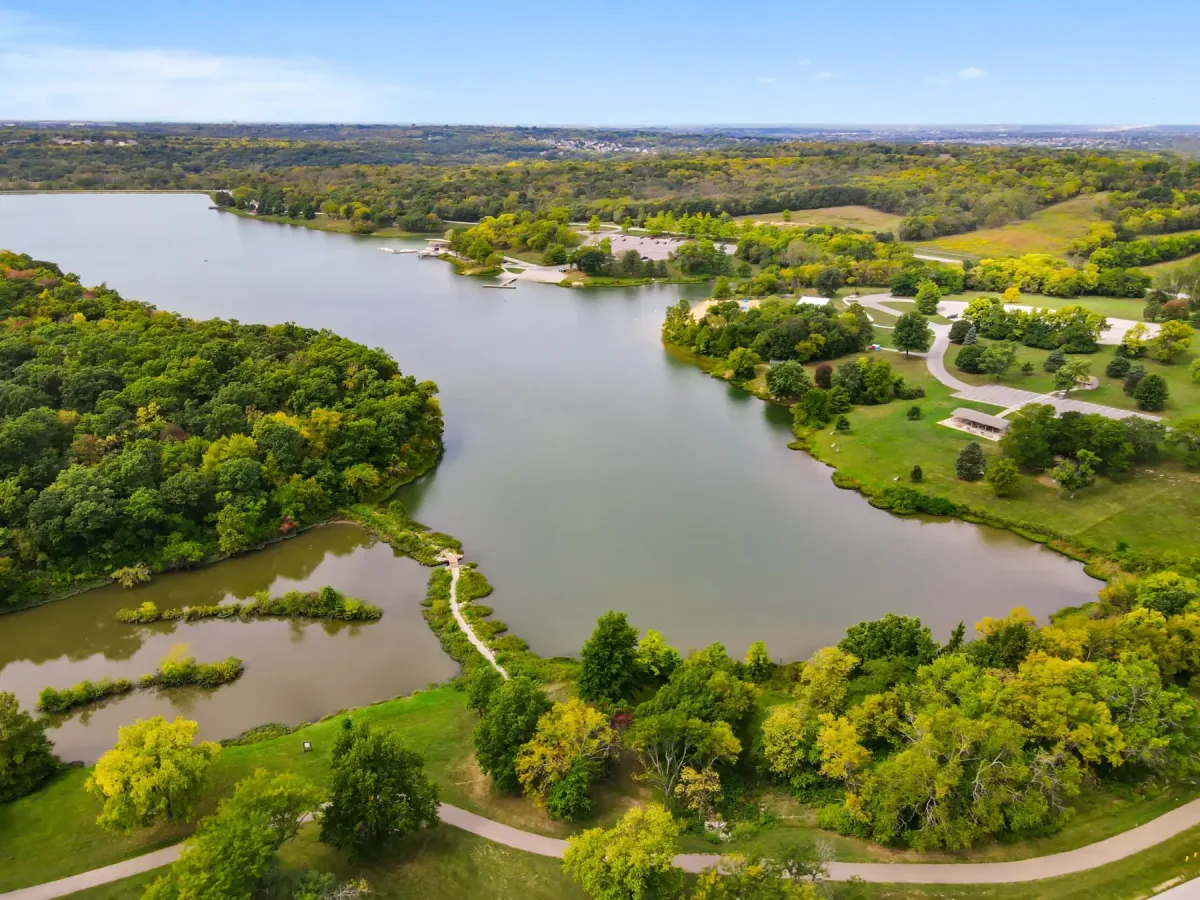 175 homes for sale
Shawnee
Most homes $410K–$850K25 min to downtown KC67,311 people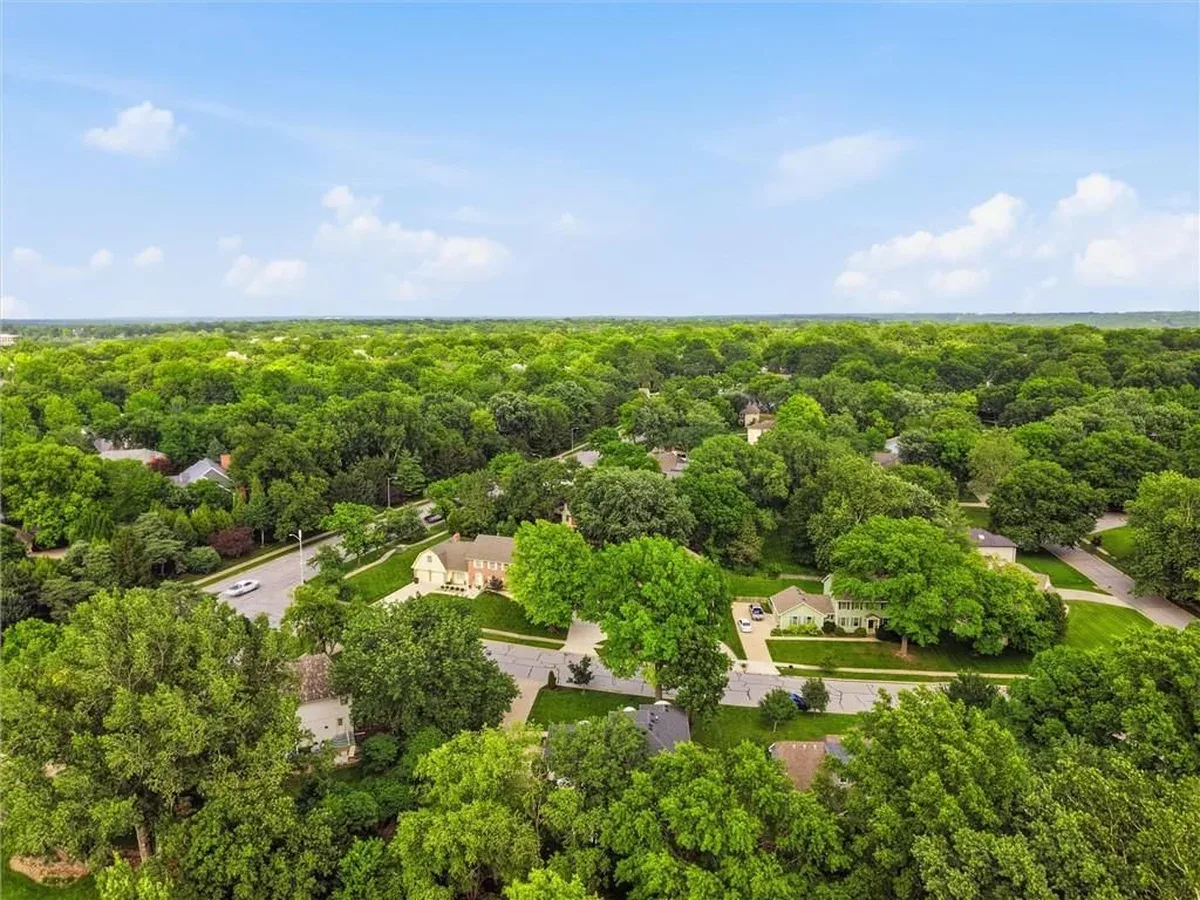 126 homes for sale
Leawood
Most homes $735K–$2.0M26 min to downtown KC33,902 people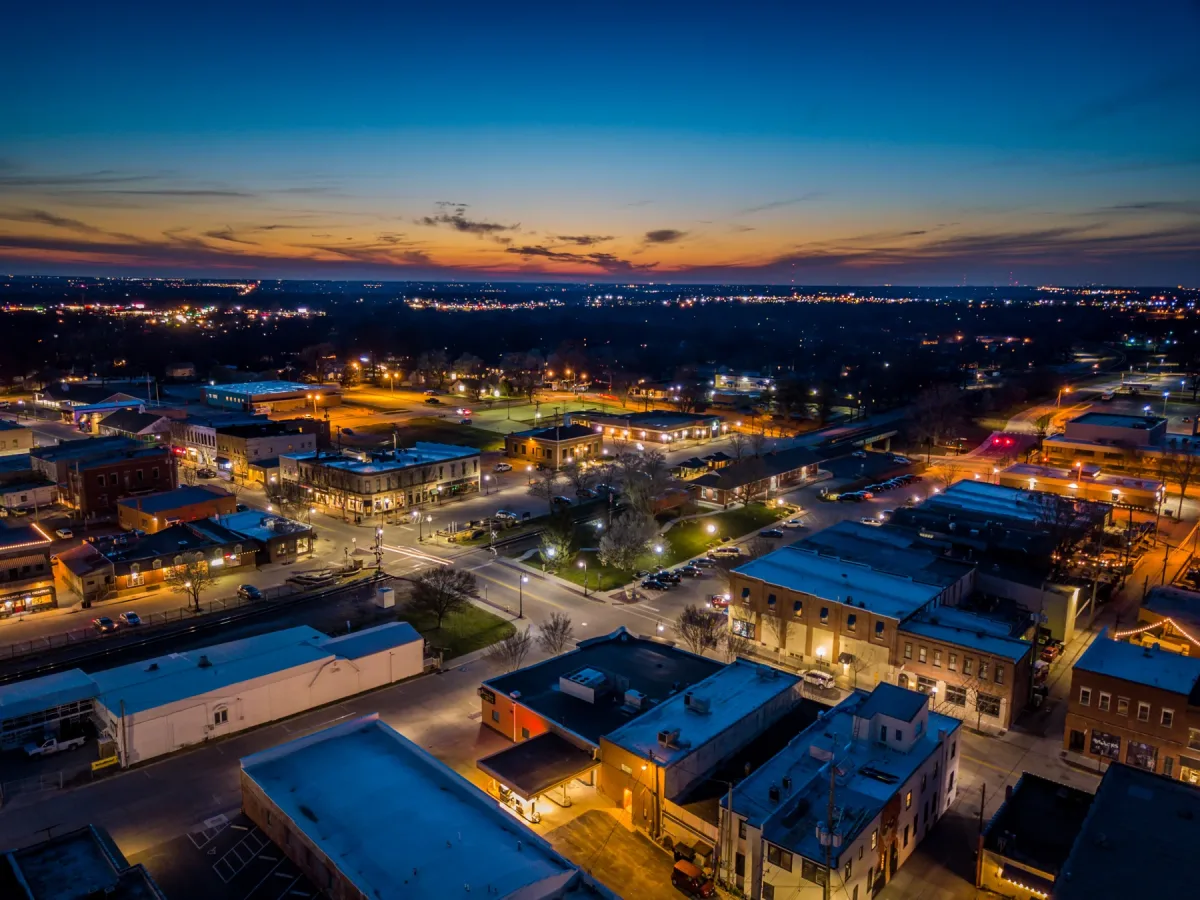 397 homes for sale
Lee's Summit
Most homes $365K–$740K27 min to downtown KC101,108 people


Explore cities and neighborhoods



The housing market
As of Oct 15, 2026, The Kansas City metro: 8,098 homes for sale · 724 new in the last 7 days · median asking $374,999 · 3,085 price reductions · a median of 19 days to contract. 2,380 homes closed in the last 30 days, at a median of $370,000. At the pace of the last 90 days that is 2.94 months of supply. Inventory is up 2% from four weeks ago. Homes sold in Sep 2026: 2,563, up 18.3% from Sep 2025.
- 8,098Homes for saleBrowse cities →
- 19Median days on marketBrowse neighborhoods →
- +3.1%Price change, Sep 2026 vs Sep 2025Browse by price →
- 724New listings, last 7 daysBrowse by features →
The Kansas City metropolitan area straddles the Kansas–Missouri state line. HouseLoop covers the 8 counties at its core — four in Kansas, four in Missouri — as one market, because that is how people here actually shop: a buyer comparing Overland Park with Lee's Summit is comparing two states, two school systems and two property-tax regimes in the same afternoon.
Browse homes by city
Real estate in the Kansas City metro
The Kansas side, south of the Kansas River
Johnson County, KS (2,025) · Miami County, KS (236)
Olathe (526) · Overland Park (494) · Lenexa (192) · Shawnee (175) · Spring Hill (155) · Leawood (126) · Tonganoxie (111) · Gardner (101)
The Kansas side, north of the Kansas River
Wyandotte County, KS (495) · Leavenworth County, KS (449)
Kansas City, KS (464) · Shawnee (175) · Leavenworth (141) · Tonganoxie (111) · Basehor (89) · Bonner Springs (40) · Linwood (31) · Lansing (24)
The Missouri side, north of the Missouri River
Clay County, MO (862) · Platte County, MO (472)
Kansas City, MO (2,090) · Independence (419) · Kearney (108) · Liberty (100) · Parkville (90) · Platte City (80) · Smithville (77) · Gladstone (50)
The Missouri side, south of the Missouri River
Jackson County, MO (2,885) · Cass County, MO (651)
Kansas City, MO (2,090) · Independence (419) · Lee's Summit (397) · Blue Springs (202) · Raymore (180) · Raytown (108) · Harrisonville (82) · Pleasant Hill (81)
Popular home searches in Kansas City
| Search | For sale |
|---|---|
| Homes with a pool | For sale212 |
| Waterfront homes | For sale84 |
| Open houses | For sale783 |
| Just listed homes | For sale724 |
| Price-reduced homes | For sale3,091 |
| Homes with acreage | For sale1,330 |
| Homes with a finished basement | For sale3,438 |
| Ranch homes | For sale1,482 |
| 3-car garage homes | For sale2,109 |
| Main-floor primary homes | For sale2,944 |
| Coming soon homes | For sale472 |
| Homes with a fireplace | For sale4,226 |
How we compute these
- For sale.
- Homes listed as active right now. A live count, not a monthly average.
Show all 32 popular home searches
- Homes with a pool
- Waterfront homes
- Open houses
- Just listed homes
- Price-reduced homes
- Homes with acreage
- Homes with a finished basement
- Ranch homes
- 3-car garage homes
- Main-floor primary homes
- Coming soon homes
- Homes with a fireplace
- Multi-family homes
- Homes on large lots
- Single-story homes
- Homes on a cul-de-sac
- Homes with a walk-out basement
- Homes under contract
- Homes with no HOA
- 2-bedroom homes
- 3-bedroom homes
- 4-bedroom homes
- 5+ bedroom homes
- Homes on under a quarter acre
- Homes on 1/4 to 1/2 acre
- Homes built before 1960
- Homes built 2020 or newer
- Homes with 2+ full bathrooms
- Homes with 3+ full bathrooms
- Homes with 4+ full bathrooms
- 2-car garage homes
- 4-car garage homes
Browse by county
The eight counties of the Kansas City metro
| Place | Market (Market type is set by months of supply — how long it would take to sell every home for sale at the current pace. Under ~4 months favors sellers (low inventory, faster sales, homes near or above asking); over ~6 favors buyers (more choice, more negotiating room). 4–6 is balanced.) | Months supply | Median list | Sell-to-list | Days to contract | For sale | Coming soon | Under contract |
|---|---|---|---|---|---|---|---|---|
| Jackson County, MO | Seller's | 3.8 mo | Median$273,000 | 100% | 19d | 2,885 | 146 | 1,118 |
| Clay County, MO | Seller's | 2.9 mo | Median$389,900 | 100% | 15d | 862 | 53 | 468 |
| Cass County, MO | Balanced | 4.6 mo | Median$352,450 | 100% | 27d | 651 | 28 | 252 |
| Platte County, MO | Seller's | 3.9 mo | Median$469,000 | 102% | 20d | 472 | 21 | 211 |
| Johnson County, KS | Seller's | 3 mo | Median$600,000 | 101% | 7d | 2,025 | 166 | 1,125 |
| Wyandotte County, KS | Seller's | 3.8 mo | Median$245,000 | 100% | 21d | 495 | 30 | 188 |
| Leavenworth County, KS | Balanced | 4.7 mo | Median$299,640 | 100% | 26d | 449 | 17 | 141 |
| Miami County, KS | Balanced | 4.9 mo | Median$326,250 | 99% | 36d | 236 | 7 | 85 |
How we compute these
- Market.
- Market type is set by months of supply — how long it would take to sell every home for sale at the current pace. Under ~4 months favors sellers (low inventory, faster sales, homes near or above asking); over ~6 favors buyers (more choice, more negotiating room). 4–6 is balanced.
- Months supply.
- How many months it would take to sell every home now for sale at the pace of the last 90 days: homes for sale ÷ (closings in the last 90 days ÷ 3).
- Median list.
- The middle asking price among the homes for sale right now. Half are listed above it, half below.
- Days to contract.
- The middle number of days between a home being listed and going under contract, over the last 90 days of closings. It is not days-to-close, and it is not how long today's listings have been sitting. Newly built homes are excluded, because a build finishing is not a market moving.
- For sale.
- Homes listed as active right now. A live count, not a monthly average.
- Coming soon.
- Homes announced but not yet accepting showings. A live count.
- Under contract.
- Homes with an accepted contract that have not closed yet. A live count.
Kansas City market data
| Measure | Sep 2026 | Aug 2026 | Sep 2025 | Change |
|---|---|---|---|---|
| Median sale price | $362,500 | $374,000 | $351,770 | +3.1% |
| Median price per sq ft | $183 | $188 | $180 | +1.7% |
| Median days to contract | 22 | 19 | 20 | +2 days |
| Sell-to-list ratio | 100% | 100% | 100% | 0 pts |
| Homes sold | 2,563 | 2,703 | 2,166 | +18.3% |
| New listings | 3,473 | 3,388 | 2,681 | +29.5% |
| Went under contract | 2,400 | 2,636 | 1,986 | +20.8% |
Schools & neighborhoods
School districts across the Kansas City metro
How we compute these
- Median list.
- The middle asking price among the homes for sale right now. Half are listed above it, half below.
- For sale.
- Homes listed as active right now. A live count, not a monthly average.
Show all 40 school districts
- Kansas City MO School District
- Olathe School District
- Blue Valley School District
- Shawnee Mission School District
- Lee's Summit School District
- North Kansas City School District
- Independence School District
- Kansas City KS School District
- Spring Hill School District
- Raymore-Peculiar School District
- Park Hill School District
- Blue Springs School District
- Raytown School District
- Liberty School District
- De Soto School District
- Platte County R-III School District
- Hickman Mills School District
- Gardner Edgerton School District
- Tonganoxie School District
- Basehor-Linwood School District
- Kearney School District
- Leavenworth School District
- Grain Valley School District
- Piper School District
- Belton School District
- Center School District
- Grandview School District
- Paola School District
- Smithville School District
- Pleasant Hill School District
- Harrisonville School District
- Louisburg School District
- Fort Osage School District
- Excelsior Springs School District
- Oak Grove School District
- Lone Jack School District
- Lansing School District
- Osawatomie School District
- Bonner Springs School District
- Sherwood School District
Common questions
Real-estate FAQ for the Kansas City metro
What is the median home price in the Kansas City metro?
How many homes are currently for sale in the Kansas City area?
Is the Kansas City housing market favoring buyers or sellers right now?
How do property taxes differ between Kansas and Missouri?
How do home prices compare across Johnson County, Wyandotte County and the Missouri side of the metro?
How do Overland Park, Olathe, Lenexa, Leawood, Shawnee, Lee's Summit, Liberty and Parkville compare for housing costs?
Which school district serves a particular Kansas City-area address?
How long does it typically take Kansas City-area homes to go under contract?
Where is new construction concentrated in the Kansas City metro?
What should buyers know about commuting between the Kansas and Missouri sides of the metro?
| State | Assessed at | Fixed by |
|---|---|---|
| Kansas | 11.5% of market value | Kansas Constitution, Article 11 § 1 (residential real property) |
| Missouri | 19% of market value | Missouri Revised Statutes § 137.115 (residential real property) |
Mill levies are set locally and are not published here.