
Leavenworth County KS Real Estate & Homes For Sale
· 465 homes for sale in Leavenworth CountyHouseLoop Vision identified 103 homes for sale in Leavenworth County, KS with white kitchen cabinets, 47 with a freestanding tub, 13 with a pool, 18 with a home gym, 214 with a big backyard and 102 with a finished basement, plus 4 more features. See what HouseLoop Vision found
465 homes for sale in Leavenworth County · Sorted by Newest Listed
Real estate in Leavenworth County, Kansas
Leavenworth County, KS has about 30,164 households and a median household income of $89,218. Roughly 69% of homes are owner-occupied, the median owner's home value is $282,900, 36% of adults hold a bachelor's degree or higher. The average commute runs 23.9 minutes. About 83,123 people live in Leavenworth County, KS, per the U.S. Census Bureau's American Community Survey 5-year estimate (2020–2024). New construction is still adding supply: 36 building permits were issued in September 2026.
The core question every buyer and seller in Leavenworth County faces right now is the same one: is this a patient market or a slow market? Sellers who price honestly and show well still move. Sellers who test the ceiling tend to feed that days-on-market average.
Leavenworth itself is the county seat and its most layered city — a 19th-century river town with Fort Leavenworth anchoring a steady base of military families, federal employment, and the kind of brick-and-stone architecture you don't find in new suburbs. Lansing sits just south of Leavenworth and draws buyers who want newer construction and quieter streets while staying close to post amenities and the highway. Both cities feed into the Leavenworth USD 453 district, which has strong community ties and serves a population used to transition and reinvestment.
Basehor and Tonganoxie are the county's growth corridor and the clearest answer for families prioritizing schools. Basehor-Linwood USD 458 consistently ranks among the stronger rural-suburban districts in northeast Kansas, and the area's newer subdivisions attract buyers priced out of De Soto or Olathe who still want that small-town-with-good-schools combination. Tonganoxie has its own tight-knit identity — Friday night football is not a cliché there, it's the social calendar — and home inventory tends to move faster than the county average because demand is real and supply is limited. Bonner Springs straddles the Wyandotte County line and offers some of the county's most accessible price points, making it a genuine first-time buyer market with direct access to I-70 and the Kansas Speedway corridor.
Commute math matters here. Basehor to downtown Kansas City is roughly 35 minutes on a normal morning via I-70. Leavenworth to the Plaza runs closer to 45-50 minutes, which is the honest tradeoff for the price differential versus the Johnson County suburbs. Fort Leavenworth employment eliminates the commute equation entirely for military and civilian post workers, which creates a reliable, repeat buyer pool that stabilizes demand even when the broader market softens. Lawrence appears in the city list as a fringe overlap — homes near the county's southern edge occasionally pull buyers considering KU employment or Douglas County who want more land for the dollar.
It is not stagnant. Preparation and pricing discipline matter more than they did three years ago. For buyers, the inventory depth and longer market times create leverage that simply does not exist in Overland Park or Leawood right now. Leavenworth County rewards buyers who do the work — touring broadly, understanding the city-by-city differences, and moving decisively when the right home surfaces.
Housing market trends in Leavenworth County, Kansas
| Measure | Oct 2026 | Sep 2026 | Oct 2025 |
|---|---|---|---|
| Median sale price | $327,500 | $345,425 | $385,000 |
| Median price per sq ft | $176 | $182 | $182 |
| Median days to contract | 28 | 27 | 41 |
| Sell-to-list ratio | 99% | 100% | 100% |
| Homes sold | 86 | 106 | 70 |
| New listings | 143 | 126 | 113 |
| Went under contract | 93 | 80 | 94 |
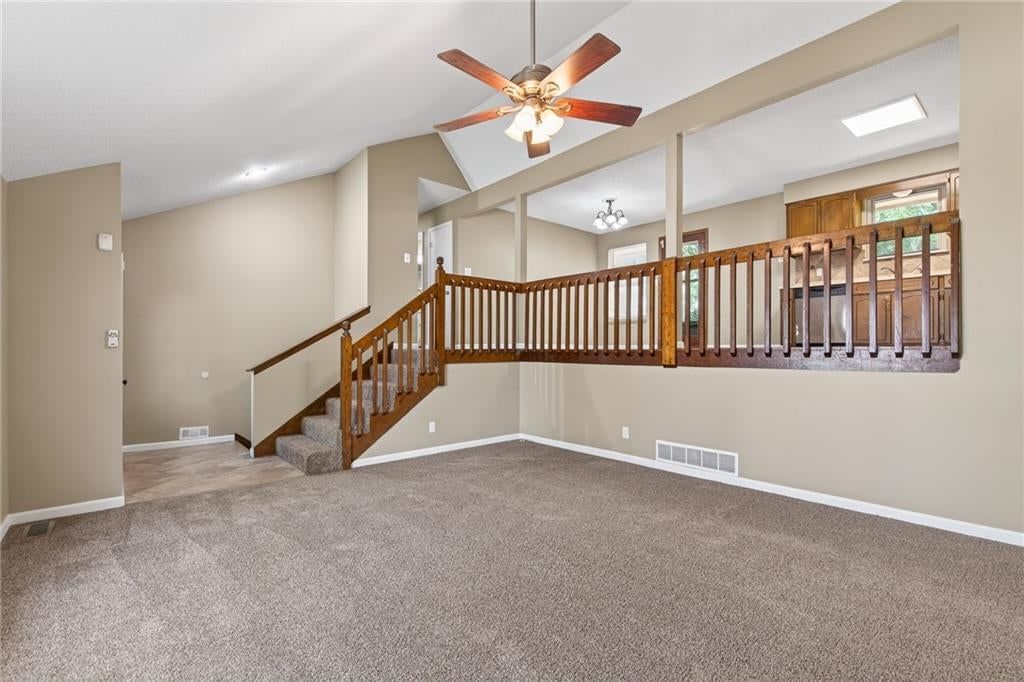
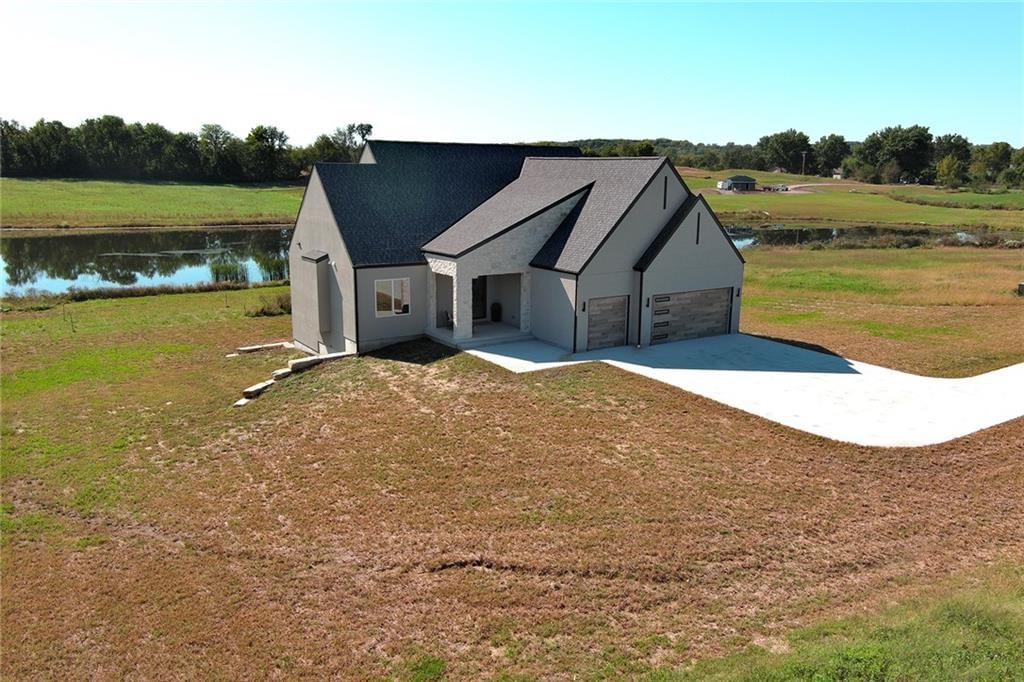
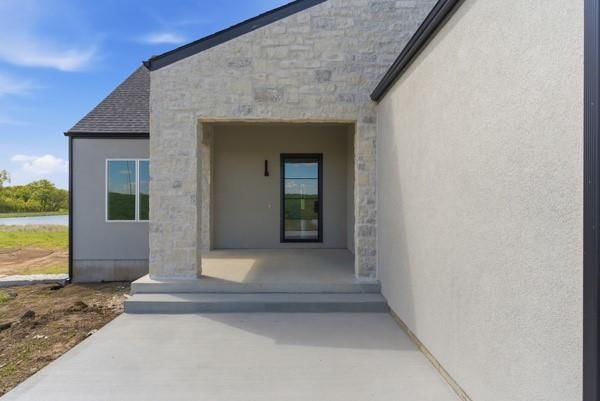
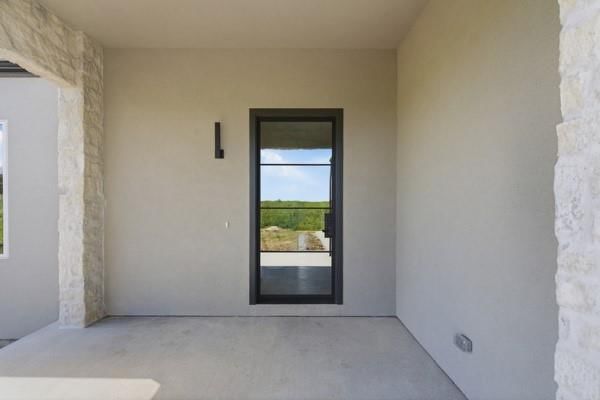
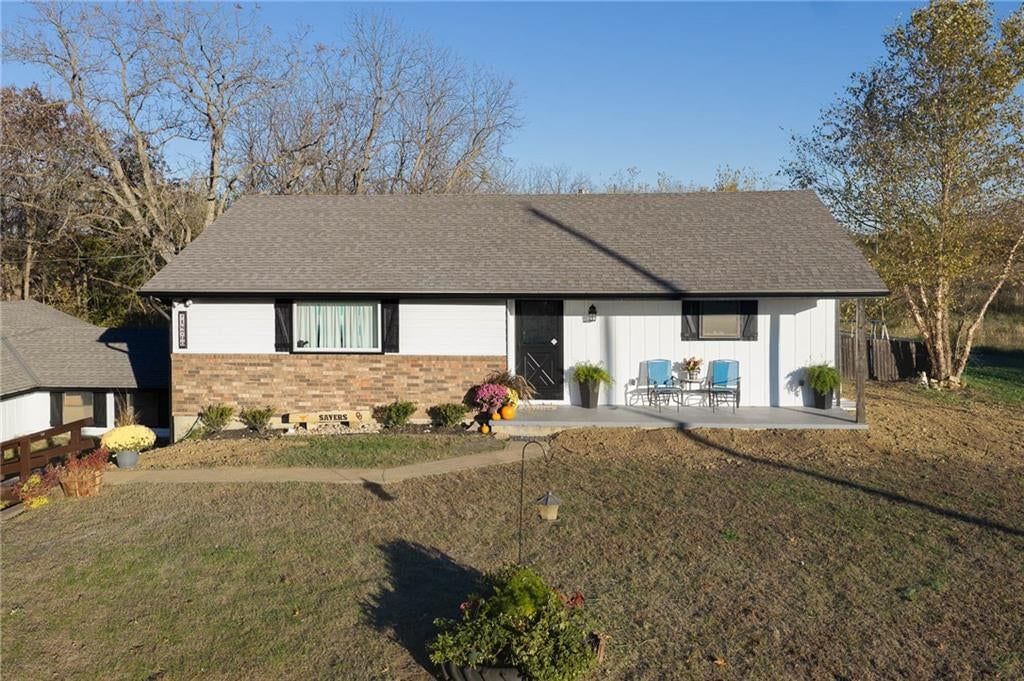
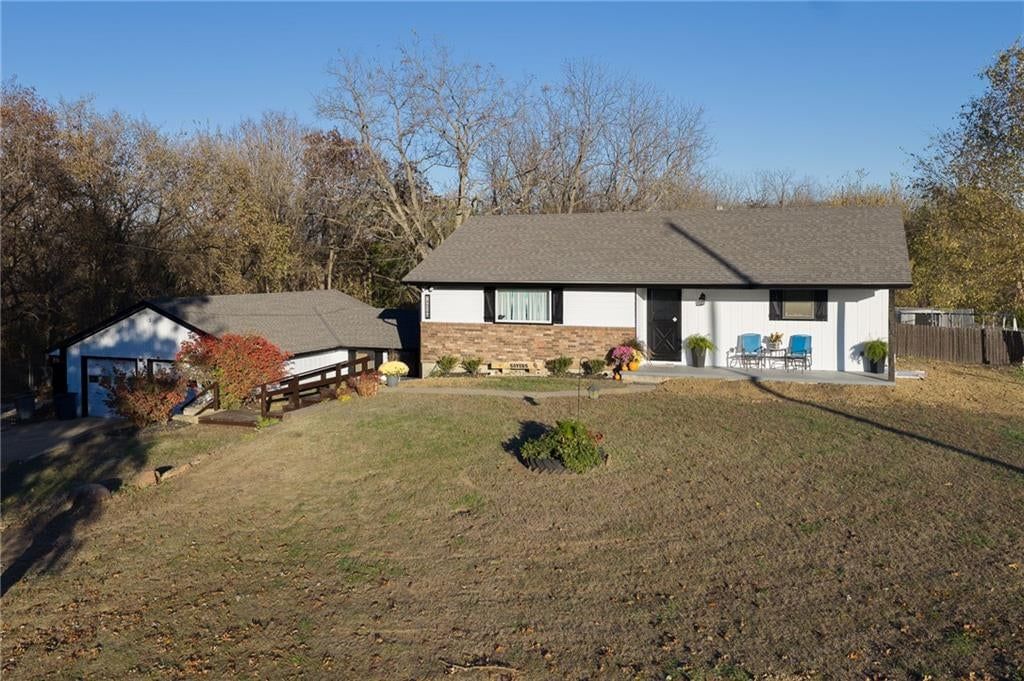
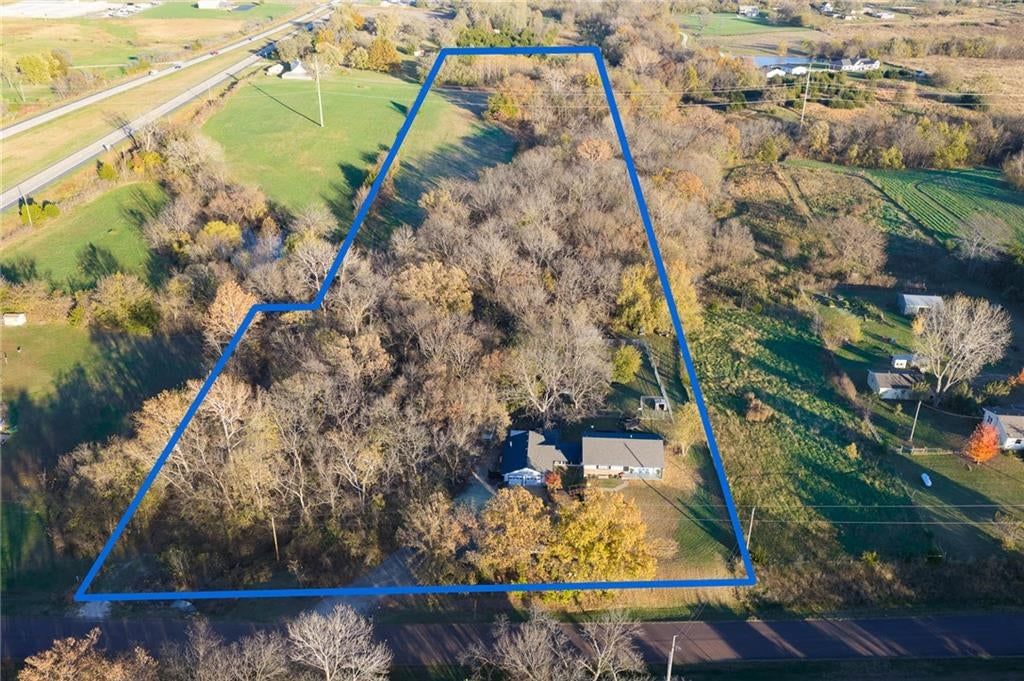
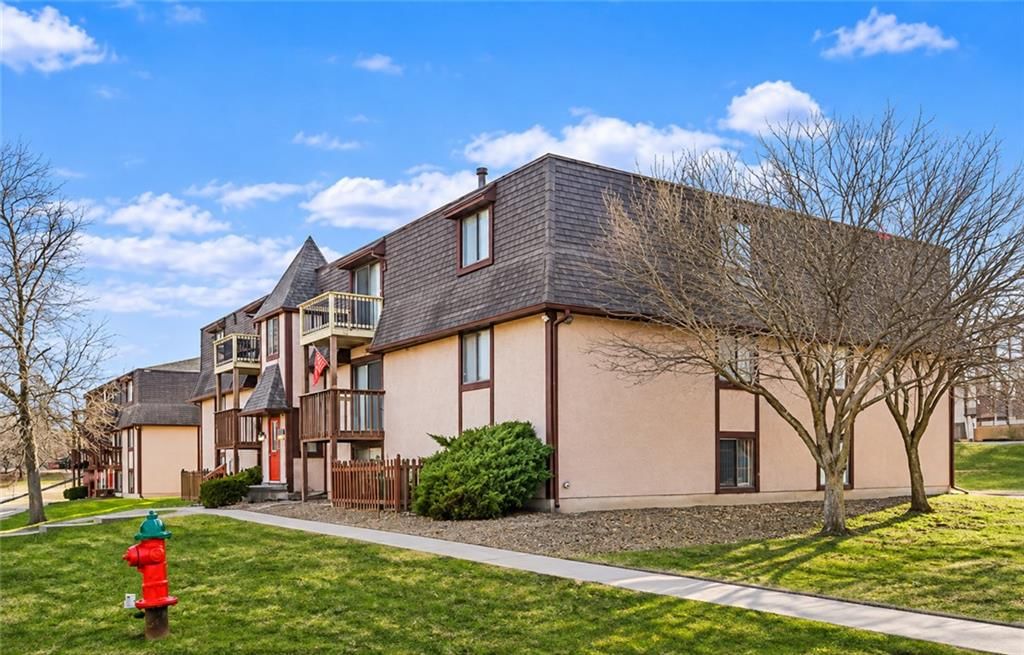
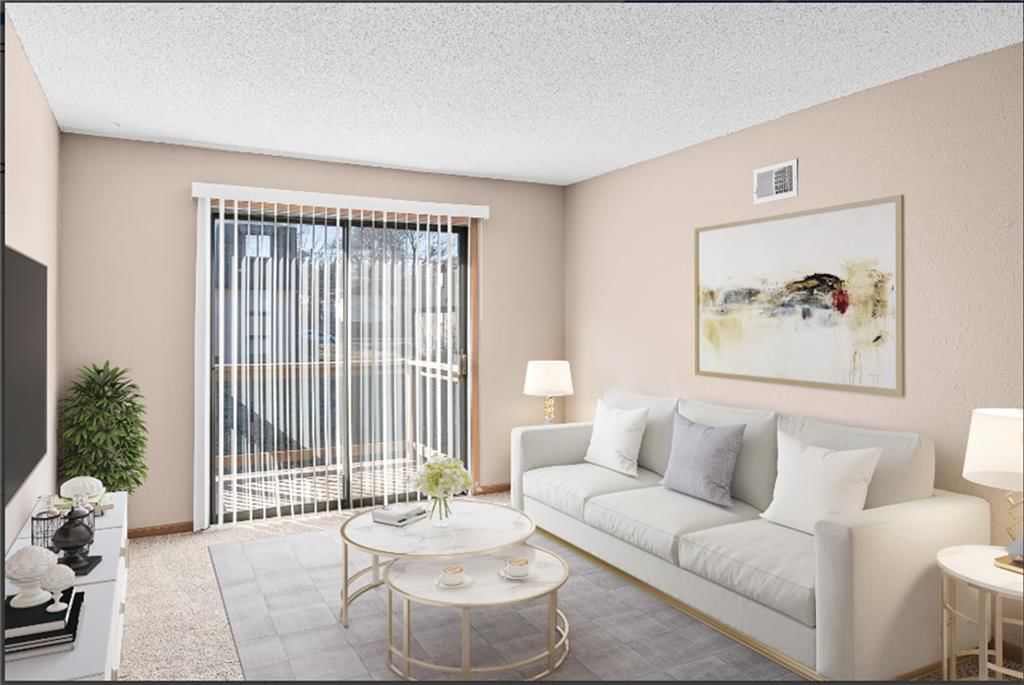
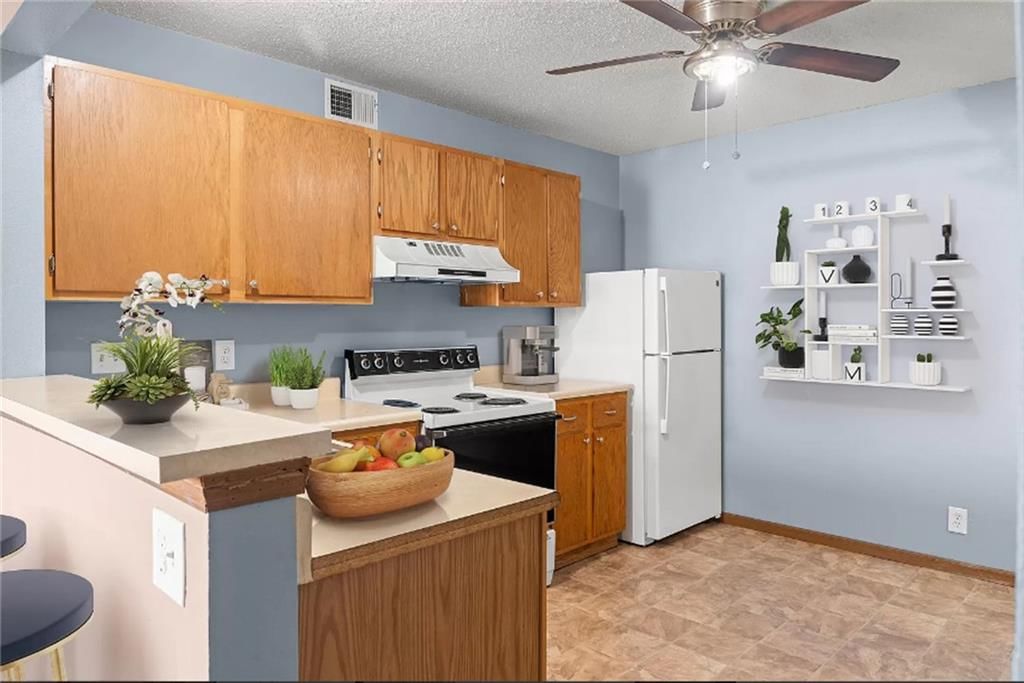
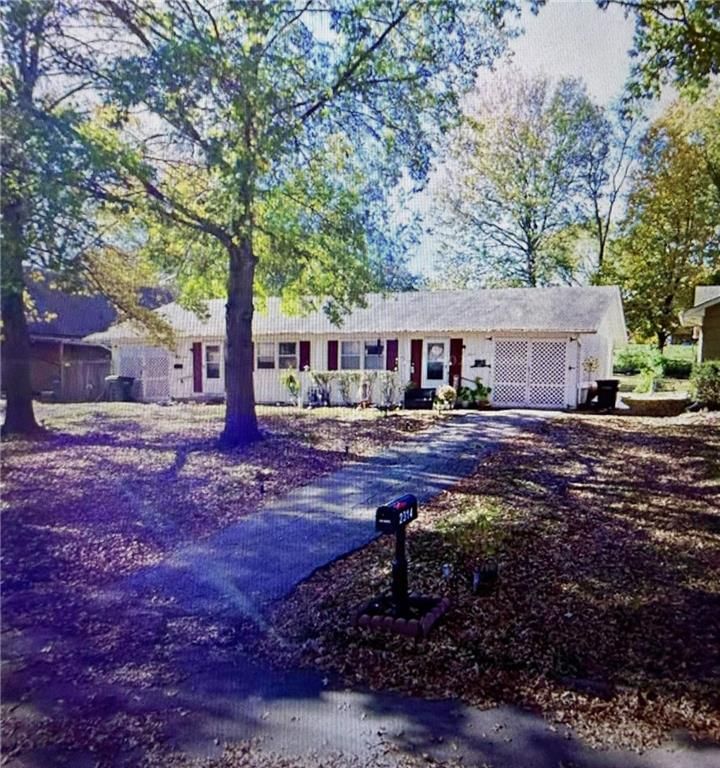
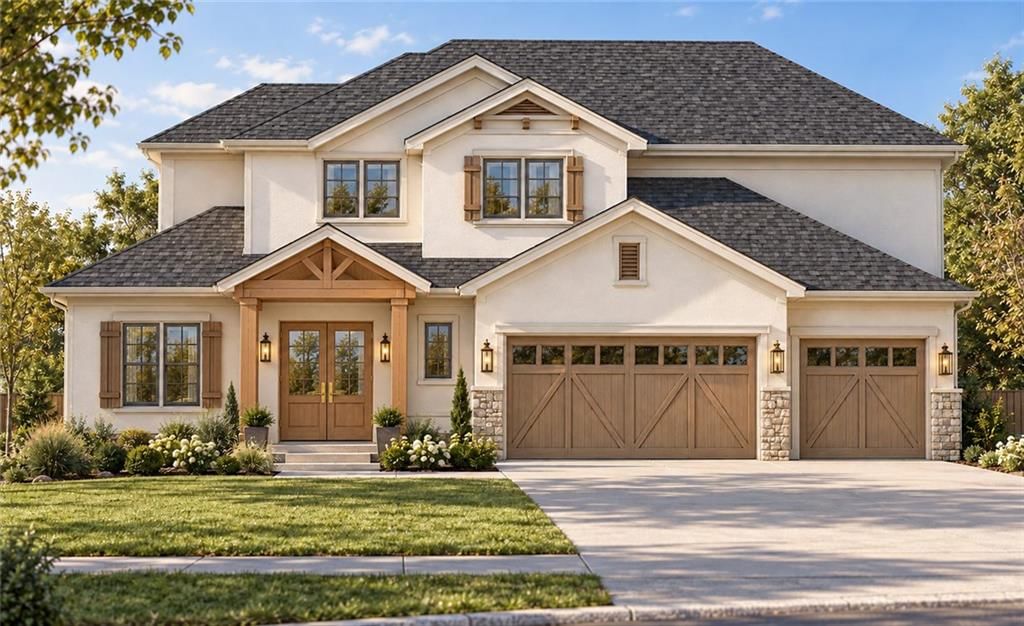
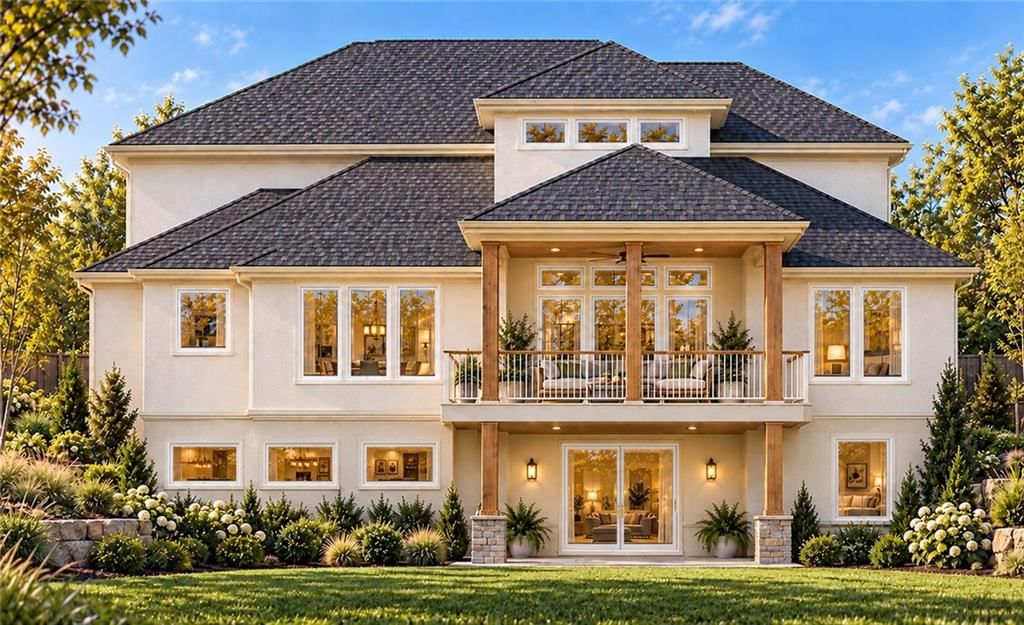
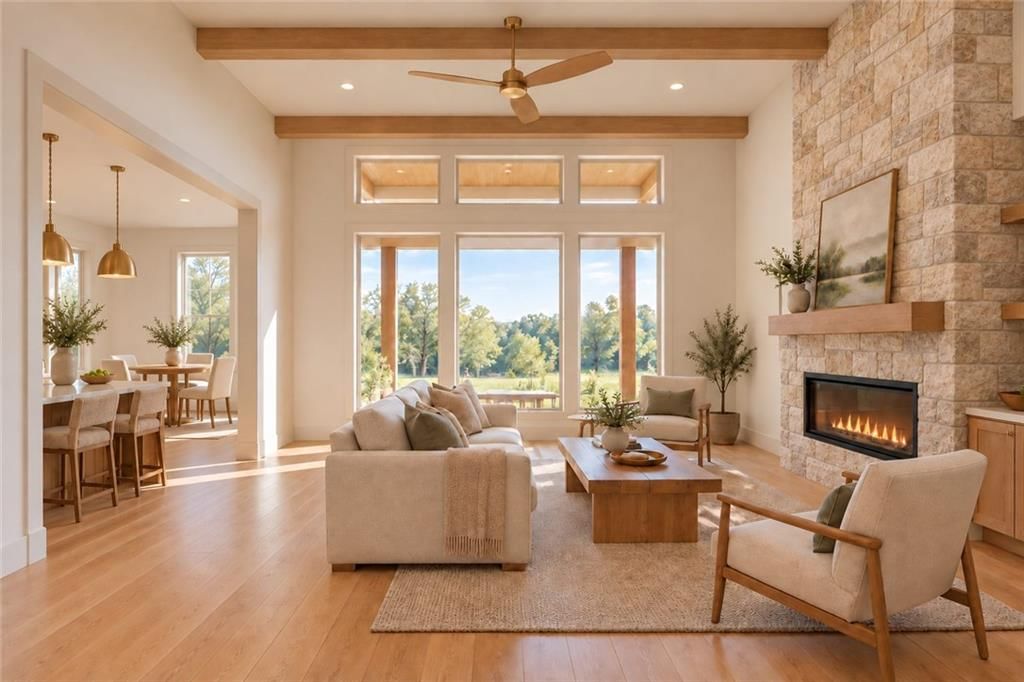
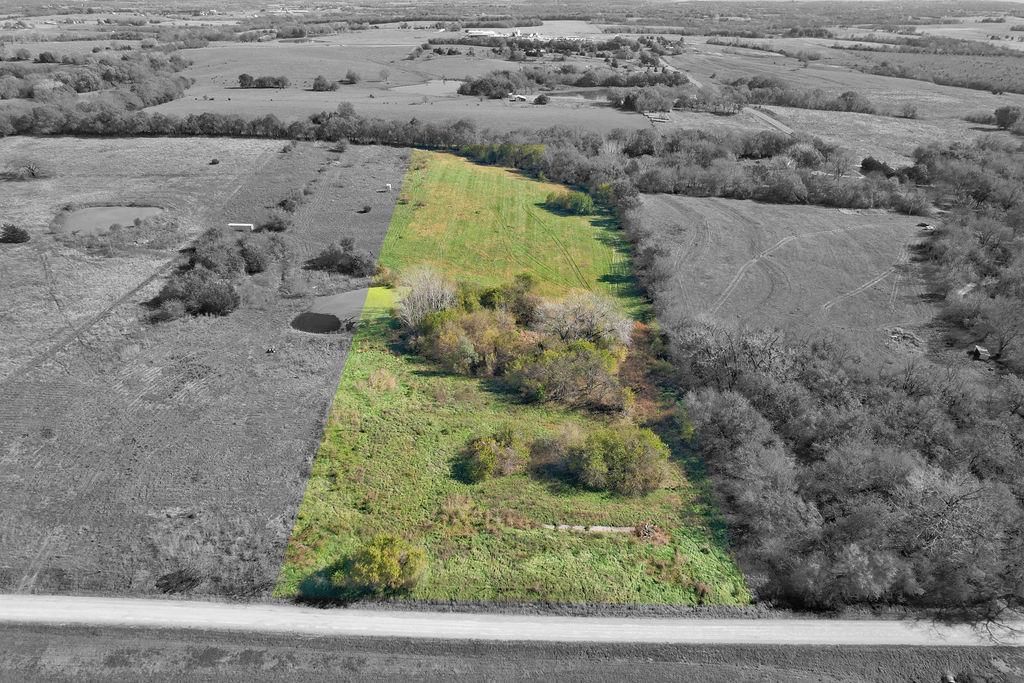
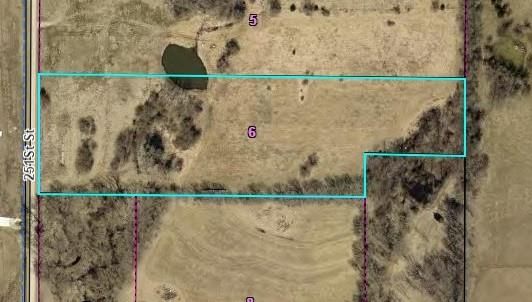
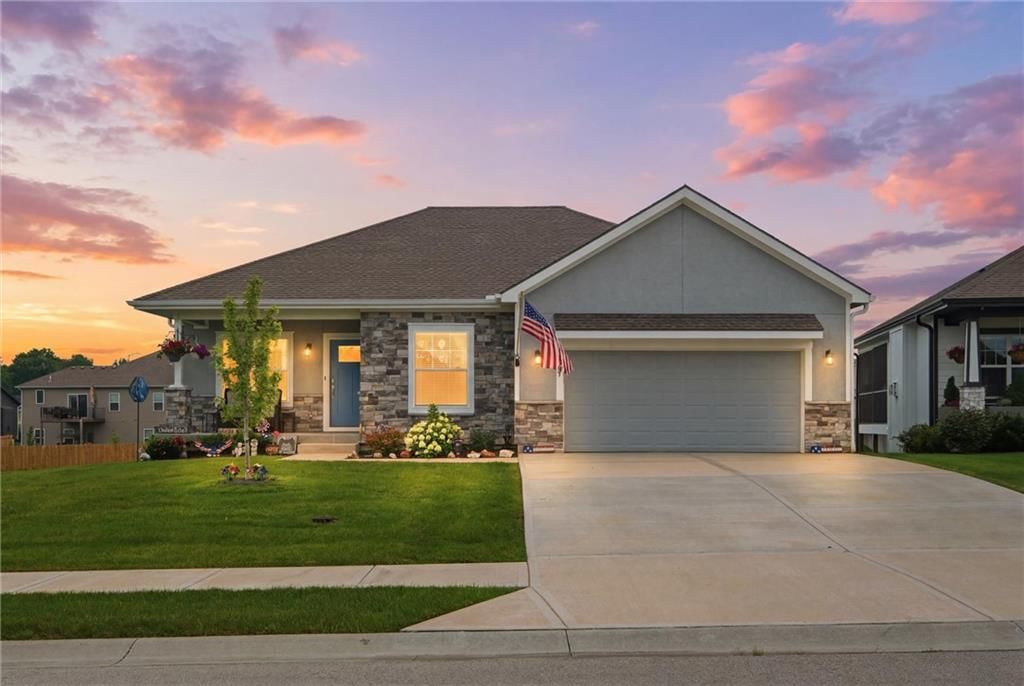
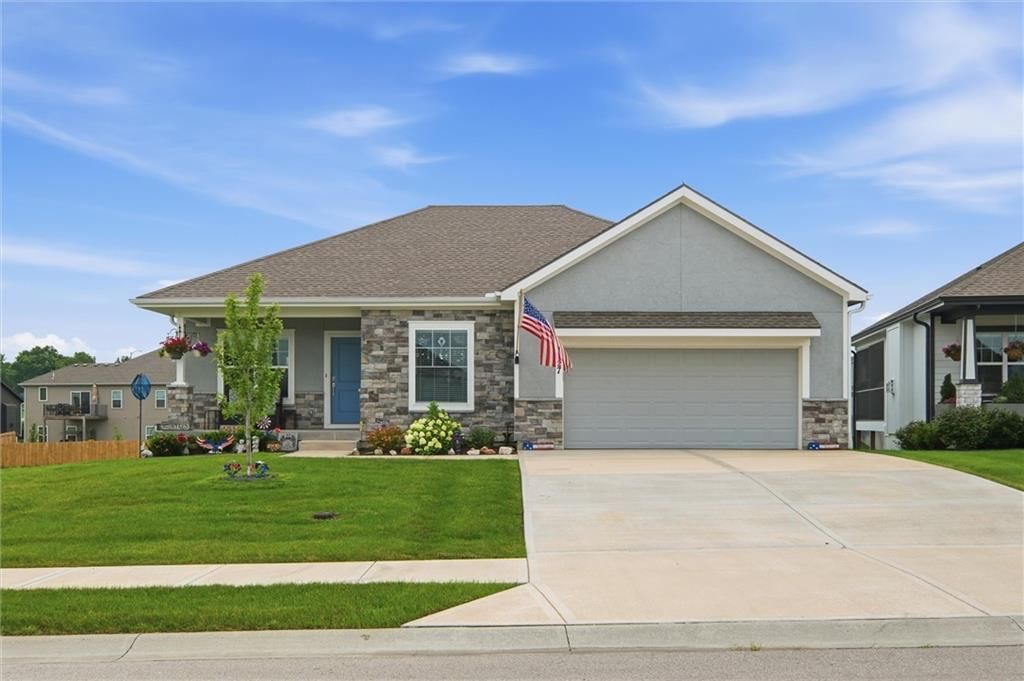
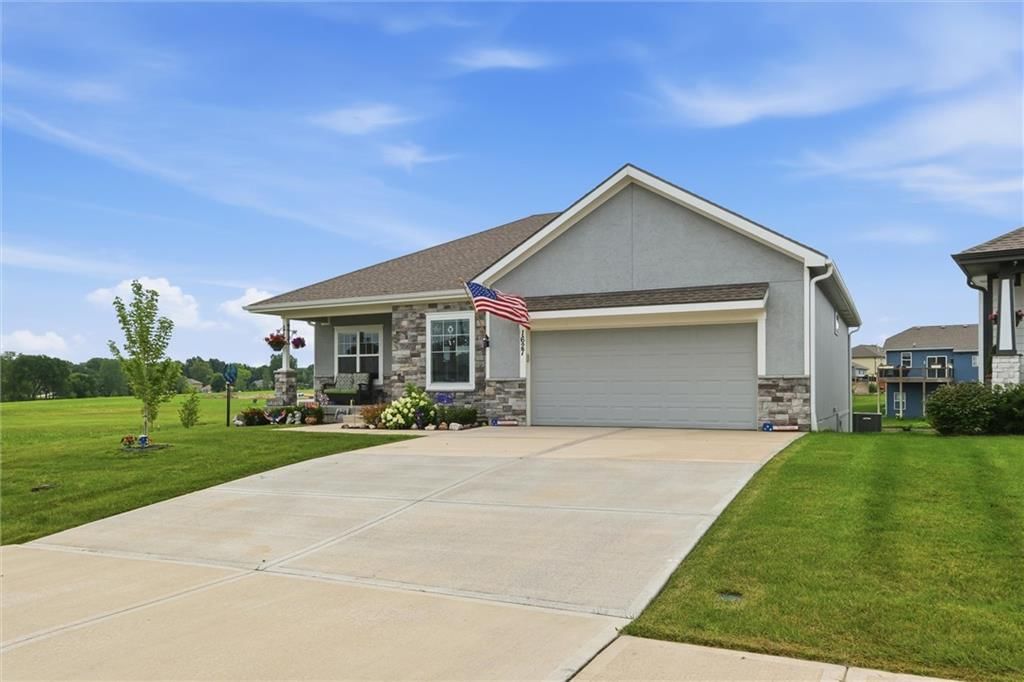
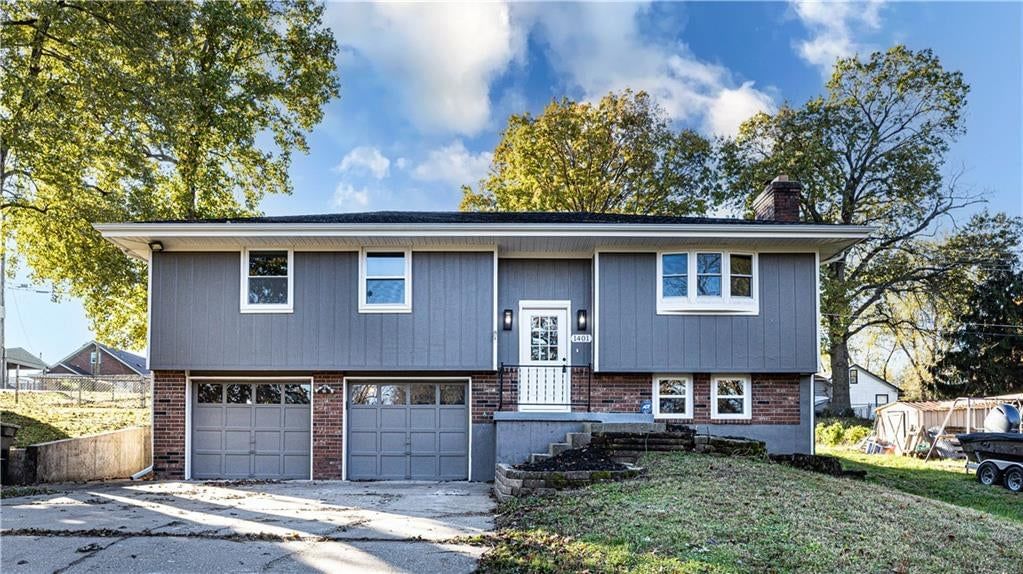
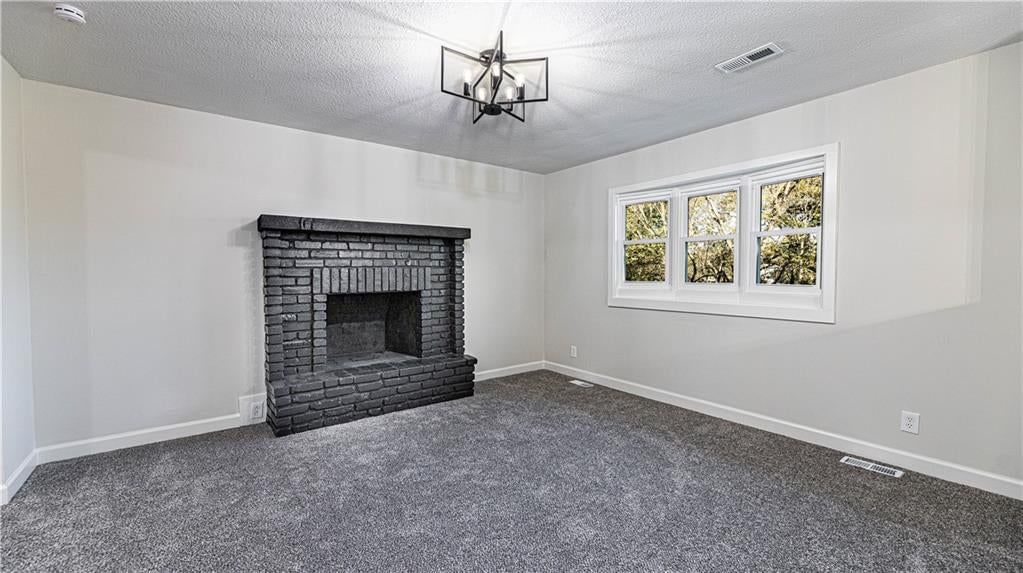
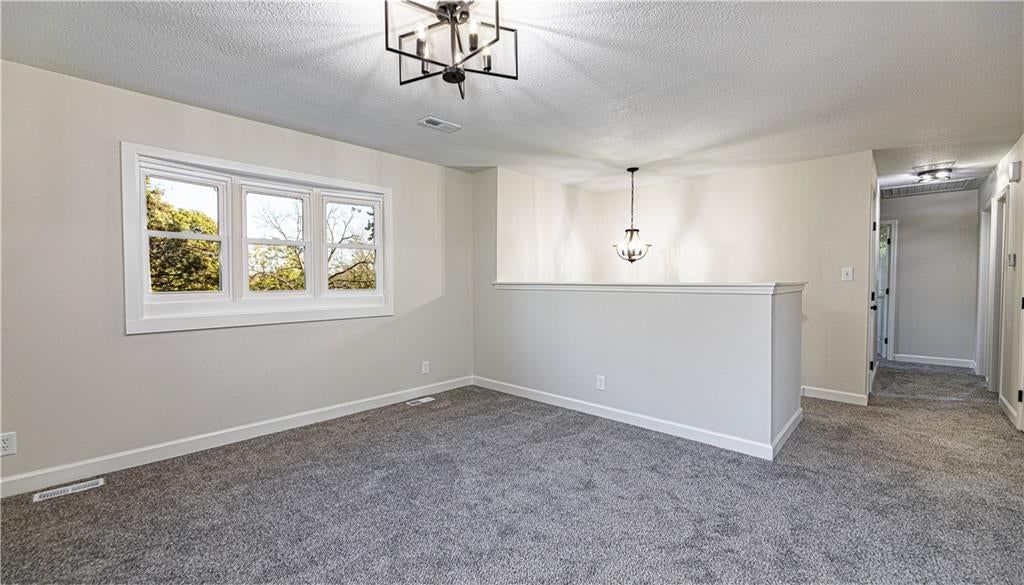
HouseLoop Vision in Leavenworth County, KS
As of Nov 16, 2026
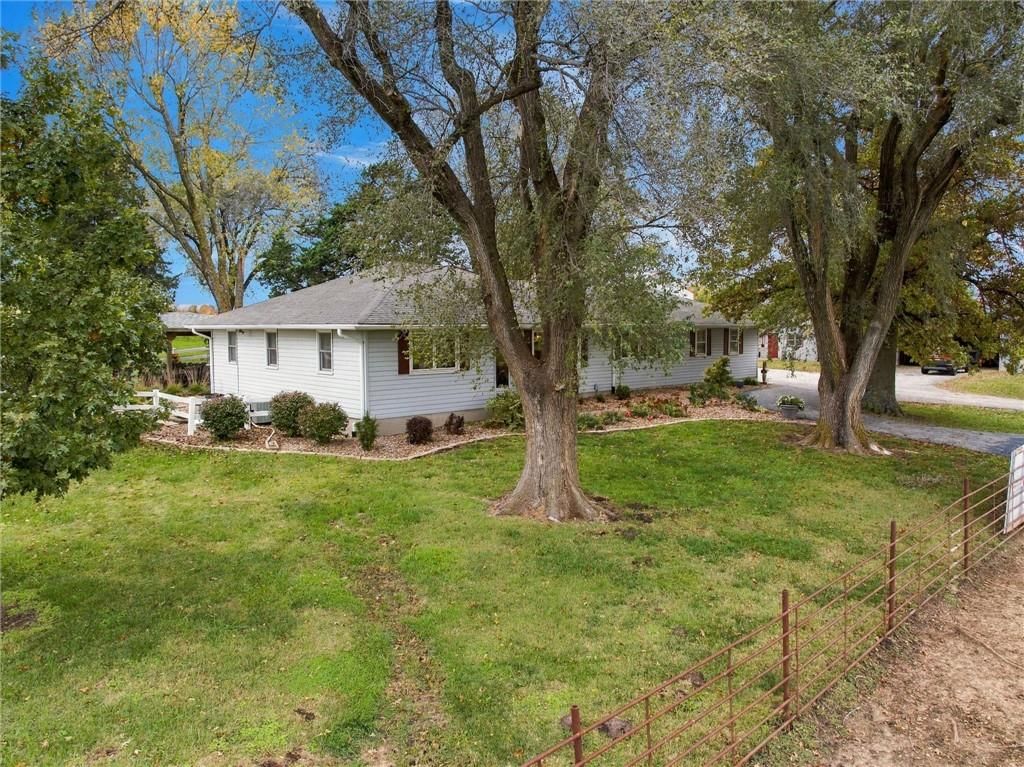
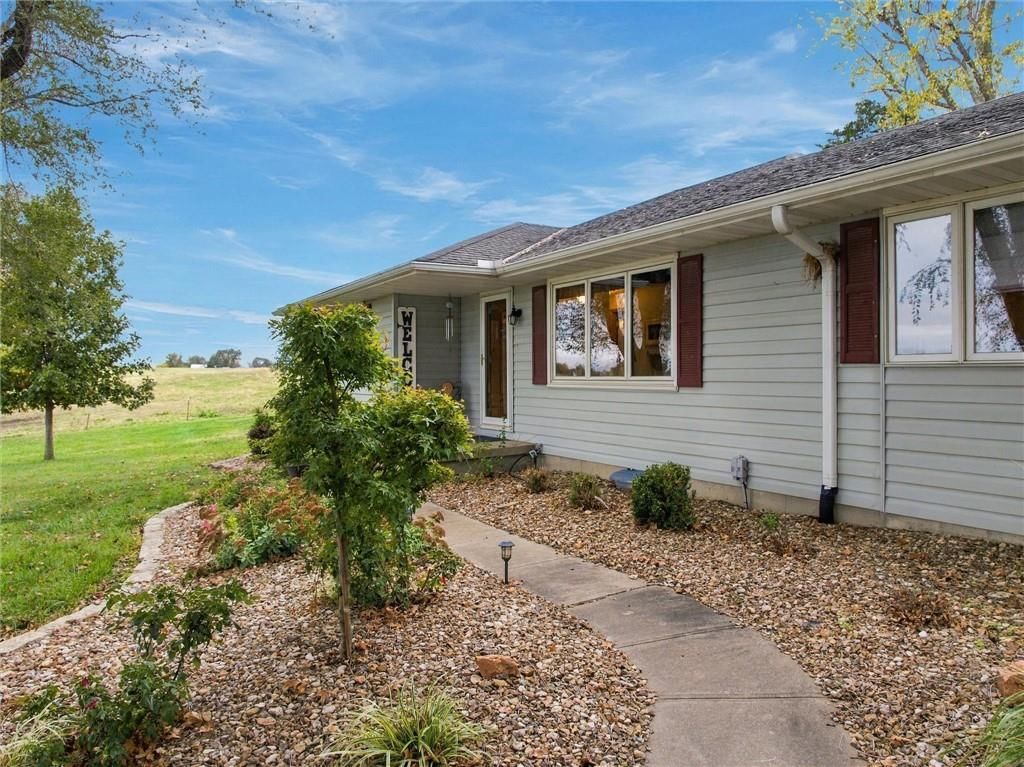
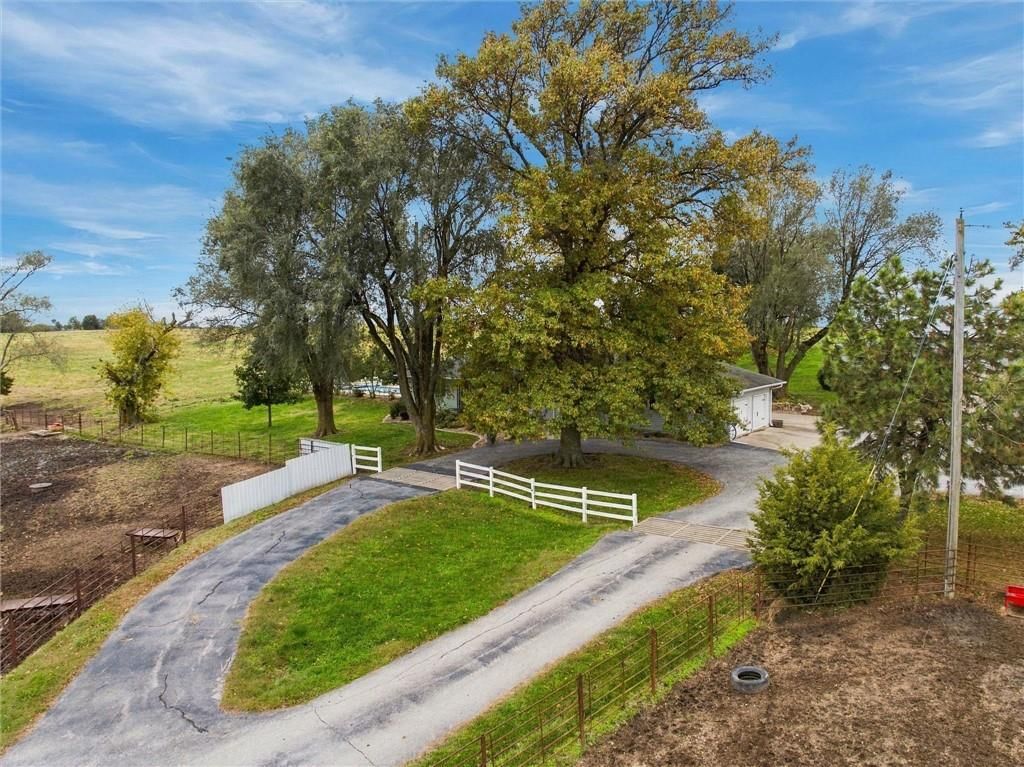
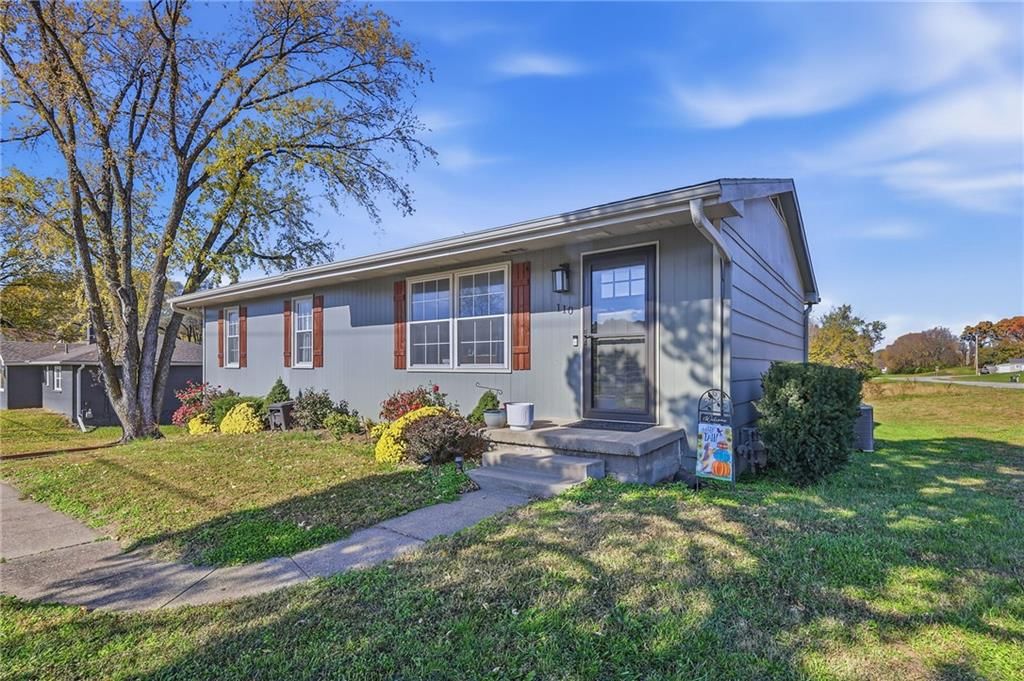
HouseLoop Vision identified 103 homes for sale in Leavenworth County, KS with white kitchen cabinets, 47 with a freestanding tub, 13 with a pool, 18 with a home gym, 214 with a big backyard and 102 with a finished basement, plus 4 more features.
HouseLoop Vision has looked at the photos of 436 of the 465 homes for sale in Leavenworth County, KS. 29 haven't been looked at yet.
| HouseLoop Vision feature | Homes for sale | Where HouseLoop Vision saw it |
|---|---|---|
| White kitchen cabinets | 103 | 1627 N 157th Terrace (photo 6), 2060 Joles Drive (photo 13), 63 Logan Street (photo 2) |
| Freestanding tub | 47 | 602 154th Circle (photo 25), 14733 Timber Lane (photo 16), 925 Pottawatomie Street (photo 14) |
| Pool | 13 | 18291 N 158th Street (photo 5), 813 N 16th Street (photo 3), 109 Willow Point Road (photo 4) |
| Home gym | 18 | 1940 Vilas Street (photo 30), 15733 Pine Circle (photo 29) |
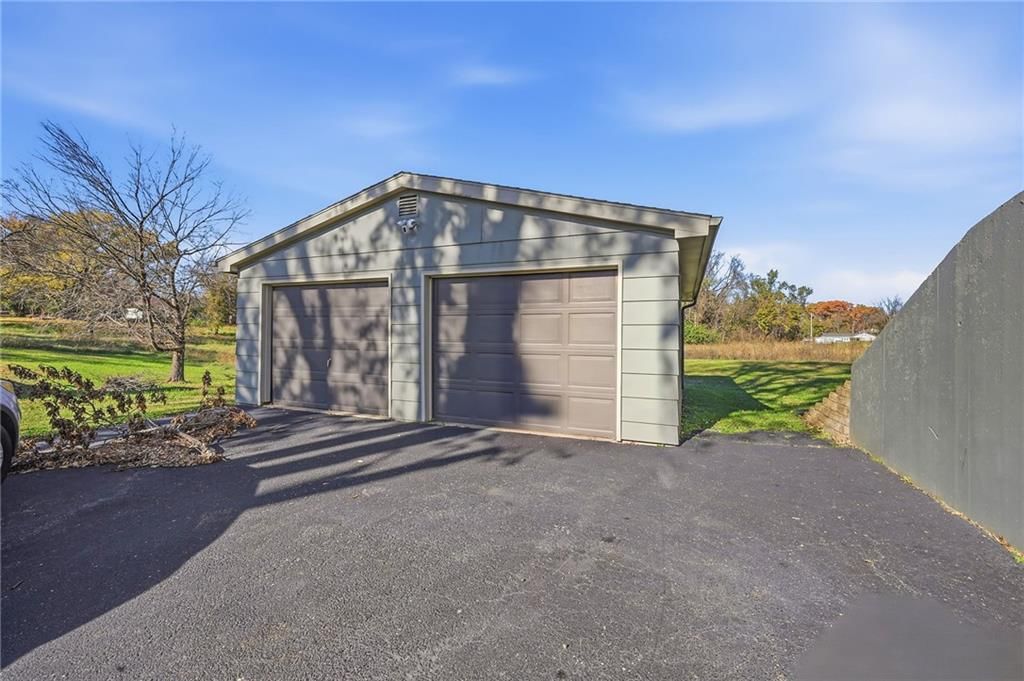
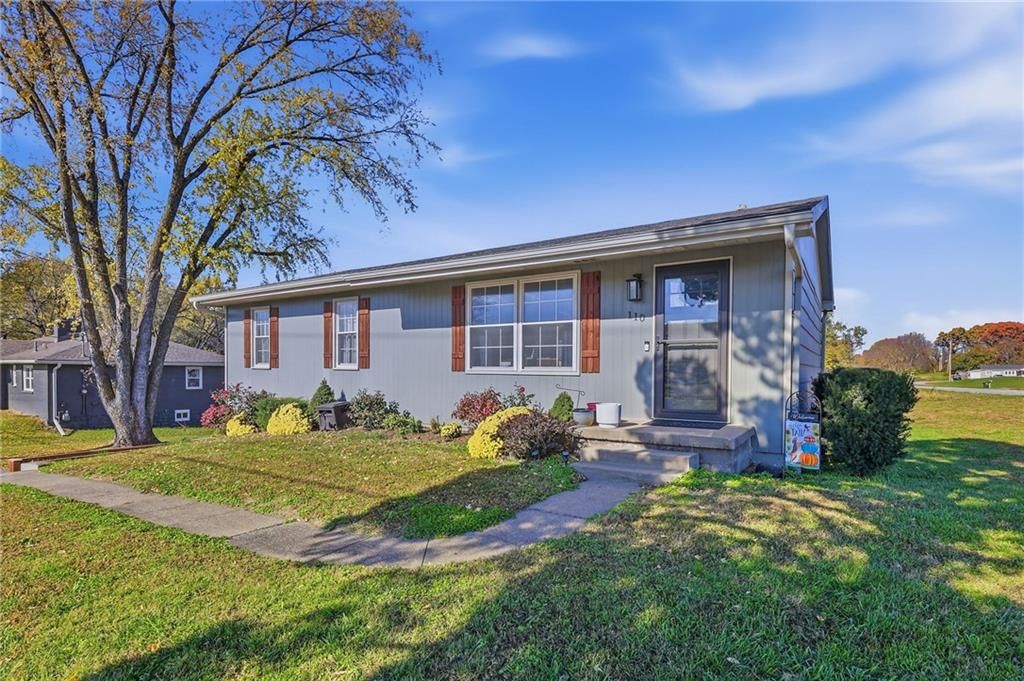
| Big backyard | 214 | 110 W Kay Street (photo 4), 1401 Olive Street (photo 20) |
| Finished basement | 102 | 18700 182nd Street (photo 20), 1117 Pawnee Street (photo 10) |
| Kitchen island | 139 | 16055 W Eisenhower Road (photo 11), 920 N 2nd Street (photo 3) |
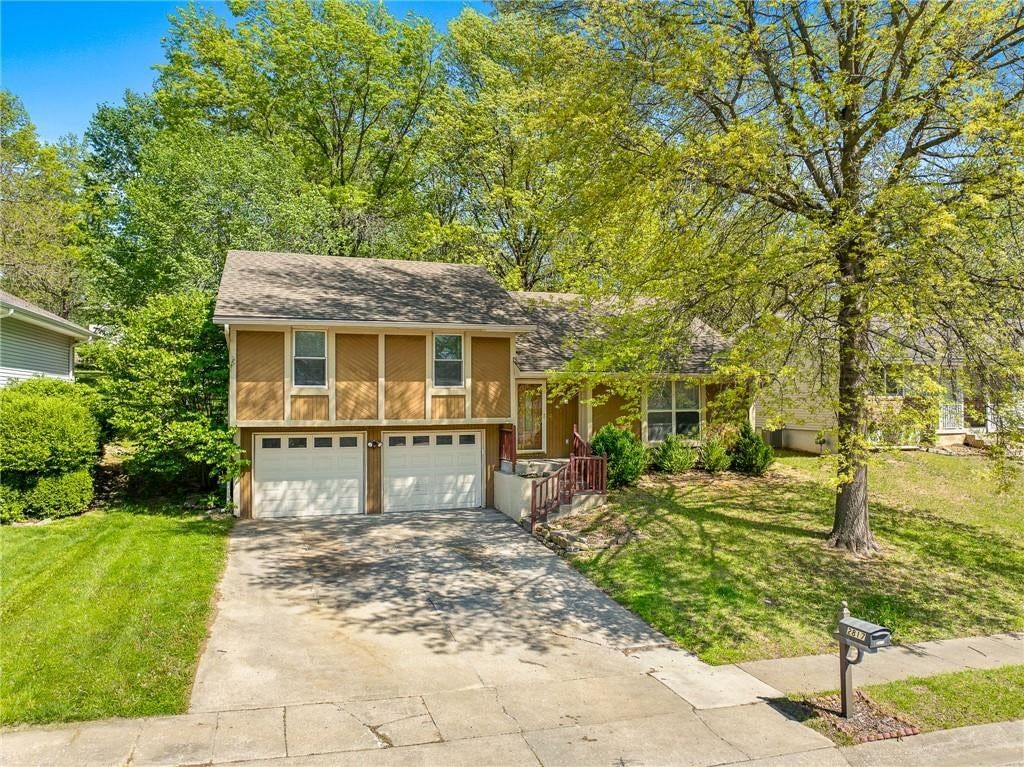
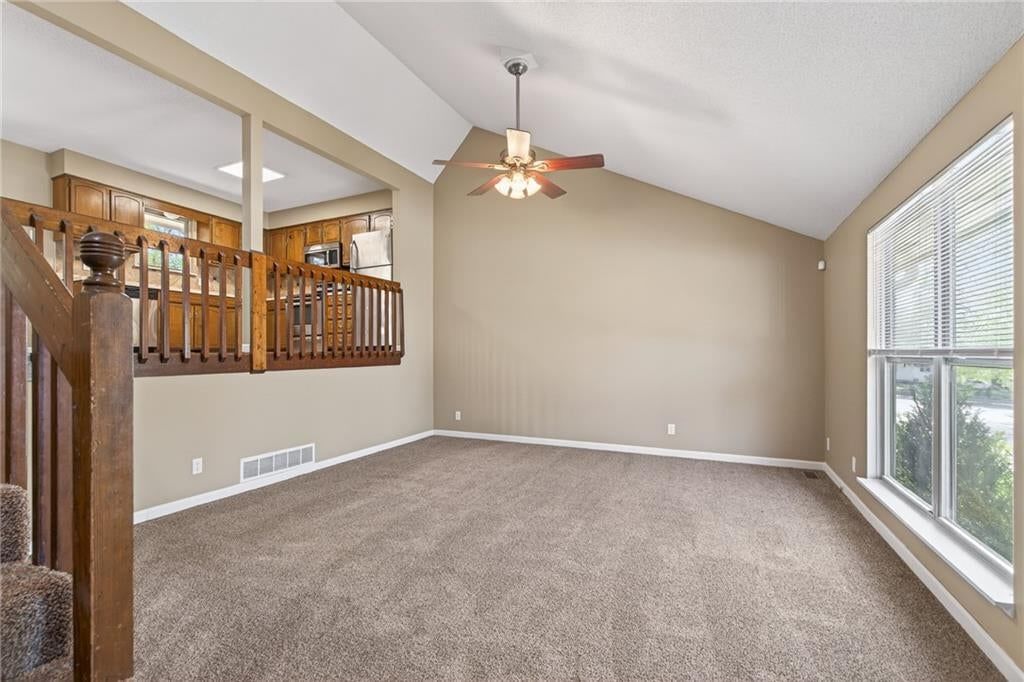
| Two-story living room | 31 | 2817 Folsom Street (photo 3), 1520 N 162nd Circle (photo 3), 1118 Sycamore Ridge Drive (photo 3) |
| Fenced yard | 140 | 23 Sheridan Street (photo 15), LOT 3 High Prairie Road (photo 3), 16925 Kickapoo Road (photo 28) |
| 3-car garage | 52 | 623 Meadowlark Road (photo 21), 16150 Eisenhower Road (photo 5), 15627 Austin Court (photo 1) |
Key HouseLoop Vision features
- White kitchen cabinets
- Freestanding tub
- Pool
- Home gym
- Big backyard
- Finished basement
- Kitchen island
- Two-story living room
- Fenced yard
- 3-car garage
Questions buyers ask about Leavenworth County, KS
- How many homes for sale in Leavenworth County, KS have white kitchen cabinets?
- HouseLoop Vision identified 103 homes for sale in Leavenworth County, KS with white kitchen cabinets. One is 1627 N 157th Terrace (photo 6).
- How many homes for sale in Leavenworth County, KS have a freestanding tub?
- HouseLoop Vision identified 47 homes for sale in Leavenworth County, KS with a freestanding tub. One is 602 154th Circle (photo 25).
- How many homes for sale in Leavenworth County, KS have a pool?
- HouseLoop Vision identified 13 homes for sale in Leavenworth County, KS with a pool. One is 18291 N 158th Street (photo 5).
- How many homes for sale in Leavenworth County, KS have a home gym?
- HouseLoop Vision identified 18 homes for sale in Leavenworth County, KS with a home gym. One is 1940 Vilas Street (photo 30).
- How many homes for sale in Leavenworth County, KS have a big backyard?
- HouseLoop Vision identified 214 homes for sale in Leavenworth County, KS with a big backyard. One is 110 W Kay Street (photo 4).
Schools serving Leavenworth County
| School | Median list | For sale |
|---|---|---|
| School districts | ||
| Tonganoxie School District | Median$232,000 | 126 |
| Basehor-Linwood School District | Median$513,450 | 124 |
| Leavenworth School District | Median$202,500 | 120 |
| Lansing School District | Median$369,900 | 47 |
| Easton School District | Median— | — |
| Mclouth School District | Median— | — |
| Lawrence School District | Median— | — |
| Bonner Springs School District | Median— | — |
| High schools | ||
| Basehor-Linwood | Median$519,950 | 87 |
| Tonganoxie | Median$237,475 | 80 |
| Leavenworth | Median$231,500 | 44 |
| Lansing | Median$391,950 | 26 |
How we compute these
- Median list.
- The middle asking price among the homes for sale right now. Half are listed above it, half below.
- For sale.
- Homes listed as active right now. A live count, not a monthly average.
Popular home searches in Leavenworth County
| Search | For sale |
|---|---|
| Open houses | For sale13 |
| Luxury homes | For sale27 |
| Just listed homes | For sale13 |
| Price-reduced homes | For sale166 |
| Coming soon homes | For sale6 |
| Homes under contract | For sale156 |
How we compute these
- For sale.
- Homes listed as active right now. A live count, not a monthly average.
Homes by price in Leavenworth County
| Price range | For sale |
|---|---|
| Under $200,000 | For sale172 |
| Under $300,000 | For sale243 |
| Under $400,000 | For sale286 |
| Under $500,000 | For sale347 |
How we compute these
- For sale.
- Homes listed as active right now. A live count, not a monthly average.
Homes by feature in Leavenworth County
| Feature | For sale |
|---|---|
| Homes with no HOA | For sale378 |
| Two or more stories | For sale357 |
| Homes on large lots | For sale254 |
| Homes with acreage | For sale239 |
How we compute these
- For sale.
- Homes listed as active right now. A live count, not a monthly average.
Search by property type in Leavenworth County
| Property type | Market (Market type is set by months of supply — how long it would take to sell every home for sale at the current pace. Under ~4 months favors sellers (low inventory, faster sales, homes near or above asking); over ~6 favors buyers (more choice, more negotiating room). 4–6 is balanced.) | Months supply | For sale | Median sale | Sell-to-list | Days to contract | Coming soon | Under contract |
|---|---|---|---|---|---|---|---|---|
| Single Family | Seller's | 2.9 mo | 236 | Median$360,000 | 99% | 23d | 4 | 122 |
| Townhouse | — | — | — | Median— | — | — | — | — |
| Villa | — | — | — | Median— | — | — | — | — |
| Half Duplex | — | — | — | Median— | — | — | — | — |
| Duplex | — | — | — | Median— | — | — | — | — |
| Triplex | — | — | — | Median— | — | — | — | — |
| Quadruplex | — | — | — | Median— | — | — | — | — |
| Lots / Land | Strong Buyer's | 25 mo | 200 | Median$149,950 | 91% | 82d | 0 | 19 |
How we compute these
- Market.
- Market type is set by months of supply — how long it would take to sell every home for sale at the current pace. Under ~4 months favors sellers (low inventory, faster sales, homes near or above asking); over ~6 favors buyers (more choice, more negotiating room). 4–6 is balanced.
- Months supply.
- How many months it would take to sell every home now for sale at the pace of the last 90 days: homes for sale ÷ (closings in the last 90 days ÷ 3).
- For sale.
- Homes listed as active right now. A live count, not a monthly average.
- Days to contract.
- The middle number of days between a home being listed and going under contract, over the last 90 days of closings. It is not days-to-close, and it is not how long today's listings have been sitting. Newly built homes are excluded, because a build finishing is not a market moving.
- Coming soon.
- Homes announced but not yet accepting showings. A live count.
- Under contract.
- Homes with an accepted contract that have not closed yet. A live count.
Search homes in Leavenworth County
| City | Market (Market type is set by months of supply — how long it would take to sell every home for sale at the current pace. Under ~4 months favors sellers (low inventory, faster sales, homes near or above asking); over ~6 favors buyers (more choice, more negotiating room). 4–6 is balanced.) | Months supply | Median list | Sell-to-list | Days to contract | For sale | Coming soon | Under contract |
|---|---|---|---|---|---|---|---|---|
| Leavenworth | Balanced | 4.4 mo | Median$219,950 | 97% | 28d | 171 | 3 | 45 |
| Basehor | Seller's | 3.8 mo | Median$529,950 | 100% | 31d | 90 | 0 | 58 |
| Tonganoxie | Balanced | 6 mo | Median$224,500 | 100% | 28d | 110 | 1 | 21 |
| Lansing | Seller's | 2.7 mo | Median$370,000 | 93% | 24d | 20 | 0 | 8 |
| Linwood | Balanced ▲ | 5.5 mo | Median$345,000 | 93% | 39d | 27 | 0 | 12 |
| Bonner Springs | Seller's | 3.9 mo | Median$280,000 | 96% | 22d | 41 | 1 | 12 |
| Easton | Strong Buyer's | 10.2 mo | Median$200,000 | 101% | 19d | 11 | 0 | 3 |
| McLouth | Strong Seller's | 1.4 mo | Median$335,000 | 93% | 40d | 6 | 0 | 4 |
| Lawrence | Strong Seller's | 0.2 mo | Median$349,950 | 98% | 13d | 11 | 2 | 29 |
| Kansas City | Balanced | 4.1 mo | Median$249,999 | 95% | 24d | 517 | 25 | 163 |
How we compute these
- Market.
- Market type is set by months of supply — how long it would take to sell every home for sale at the current pace. Under ~4 months favors sellers (low inventory, faster sales, homes near or above asking); over ~6 favors buyers (more choice, more negotiating room). 4–6 is balanced.
- Months supply.
- How many months it would take to sell every home now for sale at the pace of the last 90 days: homes for sale ÷ (closings in the last 90 days ÷ 3).
- Median list.
- The middle asking price among the homes for sale right now. Half are listed above it, half below.
- Days to contract.
- The middle number of days between a home being listed and going under contract, over the last 90 days of closings. It is not days-to-close, and it is not how long today's listings have been sitting. Newly built homes are excluded, because a build finishing is not a market moving.
- For sale.
- Homes listed as active right now. A live count, not a monthly average.
- Coming soon.
- Homes announced but not yet accepting showings. A live count.
- Under contract.
- Homes with an accepted contract that have not closed yet. A live count.
ZIP codes in Leavenworth County
| Place | Market (Market type is set by months of supply — how long it would take to sell every home for sale at the current pace. Under ~4 months favors sellers (low inventory, faster sales, homes near or above asking); over ~6 favors buyers (more choice, more negotiating room). 4–6 is balanced.) | Months supply | Median list | Sell-to-list | Days to contract | For sale | Coming soon | Under contract |
|---|---|---|---|---|---|---|---|---|
| 66048 | Balanced | 4.6 mo | Median$219,925 | 97% | 28d | 176 | 3 | 46 |
| 66007 | Seller's | 3.9 mo | Median$524,950 | 100% | 31d | 91 | 0 | 57 |
| 66086 | Balanced | 6 mo | Median$224,500 | 101% | 28d | 110 | 1 | 21 |
| 66043 | Seller's | 2.1 mo | Median$384,450 | 93% | 24d | 15 | 0 | 7 |
How we compute these
- Market.
- Market type is set by months of supply — how long it would take to sell every home for sale at the current pace. Under ~4 months favors sellers (low inventory, faster sales, homes near or above asking); over ~6 favors buyers (more choice, more negotiating room). 4–6 is balanced.
- Months supply.
- How many months it would take to sell every home now for sale at the pace of the last 90 days: homes for sale ÷ (closings in the last 90 days ÷ 3).
- Median list.
- The middle asking price among the homes for sale right now. Half are listed above it, half below.
- Days to contract.
- The middle number of days between a home being listed and going under contract, over the last 90 days of closings. It is not days-to-close, and it is not how long today's listings have been sitting. Newly built homes are excluded, because a build finishing is not a market moving.
- For sale.
- Homes listed as active right now. A live count, not a monthly average.
- Coming soon.
- Homes announced but not yet accepting showings. A live count.
- Under contract.
- Homes with an accepted contract that have not closed yet. A live count.