
Johnson County KS Real Estate & Homes For Sale
· 2,026 homes for sale in Johnson County2,026 homes for sale in Johnson County · Sorted by Newest Listed
Start with the numbers that matter to you
Real estate in Johnson County, Kansas
Johnson County, KS has about 249,531 households and a median household income of $109,208. Roughly 69% of homes are owner-occupied, the median owner's home value is $391,200, 58% of adults hold a bachelor's degree or higher. The average commute runs 20.6 minutes. About 620,631 people live in Johnson County, KS, per the U.S. Census Bureau's American Community Survey 5-year estimate (2020–2024). New construction is still adding supply: 290 building permits were issued in August 2026.
The honest question every buyer in Johnson County faces right now is whether the slower pace works for them or against them. Sellers, for their part, need to price with precision: the days of any number working are behind you, and overpriced listings are sitting while well-priced ones still move.
The county is not one market — it is ten distinct ones wearing the same zip code umbrella. Overland Park is the anchor, the largest city in Kansas, and the place most out-of-state buyers default to for good reason: walkable retail corridors like 119th Street, a relentless pipeline of new construction, and school districts that routinely appear on national best-of lists. Olathe sits just west and offers more square footage per dollar, a booming job base, and a slightly younger buyer demographic. Lenexa is the quiet overachiever — strong city planning, the Lenexa City Center development, and easy access to both I-35 and K-7 make it a sleeper pick that more buyers are waking up to.
Leawood and Prairie Village are the county's prestige addresses. Leawood skews newer and larger, with estates along Town Center and Hallbrook that push well past seven figures. Prairie Village is the opposite — smaller lots, mid-century ranch homes, mature trees, and a village-square feel around the Corinth shops that attracts buyers who want character over square footage. Shawnee draws buyers who want more land without driving to the edge of civilization, and Roeland Park and Mission offer some of the county's most accessible entry price points for first-time buyers who still want to be 15 minutes from downtown Kansas City. Gardner and Spring Hill, at the county's southern edge, are where the new construction land rush is happening — builders are platting subdivisions faster than the infrastructure can keep up, which is worth knowing before you assume the commute is manageable.
Schools drive a disproportionate amount of the decision-making in Johnson County, and that reputation is earned. Blue Valley, Shawnee Mission, and Olathe school districts all carry strong ratings, with Blue Valley frequently cited as one of the top public districts in the Midwest. Buyers should map school boundaries before falling in love with a specific neighborhood.
Homes that show well and land at the right number are still finding buyers. Homes that are priced to what a neighbor got two years ago are becoming cautionary tales. Johnson County rewards preparation on both sides of the transaction.
Housing market trends in Johnson County, Kansas
As of Oct 15, 2026, Johnson County, KS: 2,025 homes for sale · 205 new in the last 7 days · median asking $604,950 · 633 price reductions · a median of 17 days to contract. 698 homes closed in the last 30 days, at a median of $485,000. At the pace of the last 90 days that is 2.31 months of supply.
| Measure | Sep 2026 | Aug 2026 | Sep 2025 | Change |
|---|---|---|---|---|
| Median sale price | $470,000 | $465,000 | $460,000 | +2.2% |
| Median price per sq ft | $212 | $215 | $208 | +1.9% |
| Median days to contract | 19 | 17 | 18 | +1 days |
| Sell-to-list ratio | 100% | 100% | 100% | 0 pts |
| Homes sold | 770 | 883 | 620 | +24.2% |
| New listings | 1,033 | 906 | 807 | +28% |
| Went under contract | 719 | 817 | 643 | +11.8% |


7880 W 157th Ter, Overland Park, KS
New · just now


9532 Benson St, Overland Park, KS
New · 1h ago

15800 W 125th Ter, Olathe, KS
New · 2h ago


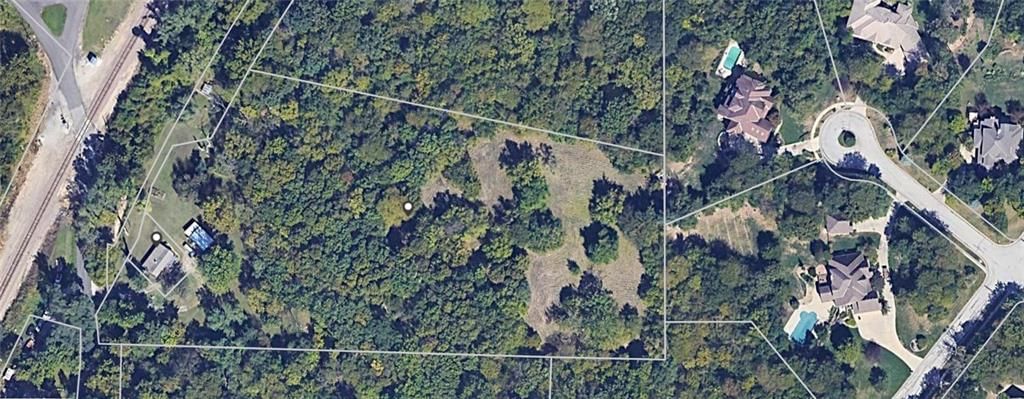
4845 Clare Rd, Shawnee, KS
New · 2h ago


9734 Hadley Dr, Overland Park, KS
New · 2h ago


6034 Arapahoe St, Shawnee, KS
New · 2h ago


23811 W 59th Ter, Shawnee, KS
New · 2h ago


23827 W 59th Ter, Shawnee, KS
New · 2h ago


16700 Stearns St, Overland Park, KS
New · 2h ago


7702 W 155th St, Overland Park, KS
New · 2h ago


909 S Montclaire Dr, Olathe, KS
New · 3h ago


13912 Birch St, Overland Park, KS
New · 3h ago
Real estate FAQs about Johnson County
How many homes are for sale in Johnson County?
How much does a home in Johnson County cost?
What is the price per square foot in Johnson County?
How fast do homes sell in Johnson County?
How many homes have sold in Johnson County in the past year?
Is Johnson County a buyer's or seller's market?
What does recent activity look like in Johnson County?
When were the homes in Johnson County built?
What are the newest homes for sale in Johnson County?
Are there older homes for sale in Johnson County?
How big are the homes for sale in Johnson County?
How big are the lots in Johnson County?
How many bedrooms do homes in Johnson County have?
Do homes in Johnson County have HOA fees?
Are there single-story homes for sale in Johnson County?
Are there homes with a pool in Johnson County?
What kind of garages do homes in Johnson County have?
What schools serve Johnson County?
Schools serving Johnson County
| School | Median list | For sale |
|---|---|---|
| School districts | ||
| Olathe School District | Median$599,000 | 501 |
| Blue Valley School District | Median$839,655 | 460 |
| Shawnee Mission School District | Median$449,500 | 452 |
| Spring Hill School District | Median$599,650 | 299 |
| De Soto School District | Median$630,000 | 164 |
| Gardner Edgerton School District | Median$402,025 | 133 |
| High schools | ||
| Spring Hill | Median$601,990 | 271 |
| Olathe Northwest | Median$645,150 | 175 |
| Blue Valley Southwest | Median$1,035,000 | 145 |
| Blue Valley | Median$760,273 | 144 |
| Olathe West | Median$667,608 | 132 |
| Shawnee Mission East | Median$759,000 | 109 |
How we compute these
- Median list.
- The middle asking price among the homes for sale right now. Half are listed above it, half below.
- For sale.
- Homes listed as active right now. A live count, not a monthly average.
Popular home searches in Johnson County
| Search | For sale |
|---|---|
| Open houses | For sale384 |
| Luxury homes | For sale291 |
| Just listed homes | For sale205 |
| Price-reduced homes | For sale634 |
| Coming soon homes | For sale166 |
| Homes under contract | For sale1,115 |
How we compute these
- For sale.
- Homes listed as active right now. A live count, not a monthly average.
Homes by price in Johnson County
| Price range | For sale |
|---|---|
| Under $200,000 | For sale31 |
| Under $300,000 | For sale164 |
| Under $400,000 | For sale473 |
| Under $500,000 | For sale742 |
How we compute these
- For sale.
- Homes listed as active right now. A live count, not a monthly average.
Homes by feature in Johnson County
| Feature | For sale |
|---|---|
| Homes with 2+ full bathrooms | For sale1,735 |
| Homes with an attached garage | For sale1,679 |
| 2-car garage homes | For sale1,666 |
| Homes with hardwood floors | For sale1,558 |
How we compute these
- For sale.
- Homes listed as active right now. A live count, not a monthly average.
Search by property type in Johnson County
| Property type | Market (Market type is set by months of supply — how long it would take to sell every home for sale at the current pace. Under ~4 months favors sellers (low inventory, faster sales, homes near or above asking); over ~6 favors buyers (more choice, more negotiating room). 4–6 is balanced.) | Months supply | For sale | Median sale | Sell-to-list | Days to contract | Coming soon | Under contract |
|---|---|---|---|---|---|---|---|---|
| Single Family | Seller's | 2.4 mo | 1,408 | Median$485,000 | 100% | 16d | 140 | 898 |
| Townhouse | Seller's | 2.4 mo | 80 | Median$321,000 | 99% | 16d | 9 | 43 |
| Villa | — | — | — | Median— | — | — | — | — |
| Condo / Loft | Strong Seller's | 1.6 mo | 20 | Median$215,000 | 100% | 16d | 4 | 21 |
| Half Duplex | — | — | — | Median— | — | — | — | — |
| Duplex | — | — | — | Median— | — | — | — | — |
| Triplex | — | — | — | Median— | — | — | — | — |
| Lots / Land | Strong Buyer's | 23.5 mo | 172 | Median$325,000 | 96% | 93d | 0 | 25 |
How we compute these
- Market.
- Market type is set by months of supply — how long it would take to sell every home for sale at the current pace. Under ~4 months favors sellers (low inventory, faster sales, homes near or above asking); over ~6 favors buyers (more choice, more negotiating room). 4–6 is balanced.
- Months supply.
- How many months it would take to sell every home now for sale at the pace of the last 90 days: homes for sale ÷ (closings in the last 90 days ÷ 3).
- For sale.
- Homes listed as active right now. A live count, not a monthly average.
- Days to contract.
- The middle number of days between a home being listed and going under contract, over the last 90 days of closings. It is not days-to-close, and it is not how long today's listings have been sitting. Newly built homes are excluded, because a build finishing is not a market moving.
- Coming soon.
- Homes announced but not yet accepting showings. A live count.
- Under contract.
- Homes with an accepted contract that have not closed yet. A live count.
Search homes in Johnson County
| City | Market (Market type is set by months of supply — how long it would take to sell every home for sale at the current pace. Under ~4 months favors sellers (low inventory, faster sales, homes near or above asking); over ~6 favors buyers (more choice, more negotiating room). 4–6 is balanced.) | Months supply | Median list | Sell-to-list | Days to contract | For sale | Coming soon | Under contract |
|---|---|---|---|---|---|---|---|---|
| Overland Park | Seller's | 2.6 mo | Median$733,510 | 102% | 5d | 494 | 49 | 319 |
| Olathe | Seller's | 3.2 mo | Median$624,960 | 102% | 9d | 526 | 31 | 310 |
| Shawnee | Seller's | 2.7 mo | Median$550,000 | 100% | 5d | 175 | 19 | 101 |
| Lenexa | Seller's | 3.2 mo | Median$625,000 | 101% | 10d | 192 | 15 | 81 |
| Leawood | Seller's | 3.1 mo | Median$925,000 | 102% | 4d | 126 | 13 | 68 |
| Prairie Village | Strong Seller's | 1.9 mo | Median$950,000 | 102% | 2d | 61 | 10 | 43 |
| Gardner | Seller's | 2.8 mo | Median$425,000 | 101% | 17d | 101 | 4 | 53 |
| Spring Hill | Balanced ▲ | 4.5 mo | Median$447,990 | 98% | 29d | 155 | 4 | 81 |
| Mission | Strong Seller's | 1.2 mo | Median$374,950 | 102% | 3d | 16 | 4 | 13 |
| Roeland Park | Seller's | 2.1 mo | Median$329,200 | 105% | 3d | 23 | 4 | 15 |
| Merriam | Strong Seller's | 1.9 mo | Median$325,000 | 105% | 3d | 15 | 3 | 6 |
| Fairway | Strong Seller's ▼ | 1.6 mo | Median$690,000 | 102% | 4d | 11 | 2 | 5 |
| De Soto | Balanced | 5.6 mo | Median$585,000 | 100% | 14d | 44 | 3 | 12 |
| Stilwell | Strong Buyer's | 8.7 mo | Median$637,500 | 98% | 9d | 58 | 3 | 7 |
| Mission Hills | Strong Seller's ▲ | 1.5 mo | Median$2,267,000 | 102% | 2d | 5 | 1 | 5 |
| Edgerton | Balanced | 5.4 mo | Median$339,090 | 100% | 34d | 34 | 0 | 8 |
| Westwood | Seller's | 2.3 mo | Median$1,050,000 | 101% | 6d | 8 | 2 | 2 |
| Lake Quivira | Seller's | 4 mo | Median$839,611 | 93% | 73d | 4 | 0 | 1 |
| Bucyrus | Strong Buyer's ▲ | 8.6 mo | Median$865,000 | 96% | 15d | 15 | 1 | 5 |
| Westwood Hills | Seller's | 2.4 mo | Median$475,000 | 96% | 4d | 1 | 0 | 0 |
| Mission Woods | Strong Buyer's | 18 mo | Median— | 99% | 1d | 3 | 0 | 2 |
| Eudora | Strong Seller's | 0.2 mo | Median$310,000 | 99% | 12d | 1 | 1 | 7 |
| Tonganoxie | Buyer's | 6.1 mo | Median$224,975 | 100% | 22d | 111 | 3 | 17 |
How we compute these
- Market.
- Market type is set by months of supply — how long it would take to sell every home for sale at the current pace. Under ~4 months favors sellers (low inventory, faster sales, homes near or above asking); over ~6 favors buyers (more choice, more negotiating room). 4–6 is balanced.
- Months supply.
- How many months it would take to sell every home now for sale at the pace of the last 90 days: homes for sale ÷ (closings in the last 90 days ÷ 3).
- Median list.
- The middle asking price among the homes for sale right now. Half are listed above it, half below.
- Days to contract.
- The middle number of days between a home being listed and going under contract, over the last 90 days of closings. It is not days-to-close, and it is not how long today's listings have been sitting. Newly built homes are excluded, because a build finishing is not a market moving.
- For sale.
- Homes listed as active right now. A live count, not a monthly average.
- Coming soon.
- Homes announced but not yet accepting showings. A live count.
- Under contract.
- Homes with an accepted contract that have not closed yet. A live count.
ZIP codes in Johnson County
| Place | Market (Market type is set by months of supply — how long it would take to sell every home for sale at the current pace. Under ~4 months favors sellers (low inventory, faster sales, homes near or above asking); over ~6 favors buyers (more choice, more negotiating room). 4–6 is balanced.) | Months supply | Median list | Sell-to-list | Days to contract | For sale | Coming soon | Under contract |
|---|---|---|---|---|---|---|---|---|
| 66062 | Seller's | 2.9 mo | Median$629,950 | 101% | 7d | 250 | 13 | 165 |
| 66061 | Seller's | 3.7 mo | Median$609,975 | 102% | 12d | 276 | 18 | 144 |
| 66208 | Strong Seller's | 1.7 mo | Median$1,367,000 | 102% | 3d | 52 | 8 | 43 |
| 66212 | Strong Seller's | 1.5 mo | Median$399,200 | 101% | 4d | 52 | 8 | 38 |
How we compute these
- Market.
- Market type is set by months of supply — how long it would take to sell every home for sale at the current pace. Under ~4 months favors sellers (low inventory, faster sales, homes near or above asking); over ~6 favors buyers (more choice, more negotiating room). 4–6 is balanced.
- Months supply.
- How many months it would take to sell every home now for sale at the pace of the last 90 days: homes for sale ÷ (closings in the last 90 days ÷ 3).
- Median list.
- The middle asking price among the homes for sale right now. Half are listed above it, half below.
- Days to contract.
- The middle number of days between a home being listed and going under contract, over the last 90 days of closings. It is not days-to-close, and it is not how long today's listings have been sitting. Newly built homes are excluded, because a build finishing is not a market moving.
- For sale.
- Homes listed as active right now. A live count, not a monthly average.
- Coming soon.
- Homes announced but not yet accepting showings. A live count.
- Under contract.
- Homes with an accepted contract that have not closed yet. A live count.