
Houses for Sale in Johnson County, KS
1,488 homes fit this search · Sorted by Newest Listed

9223 W 49th Terrace, Merriam, KS
New · 1h ago
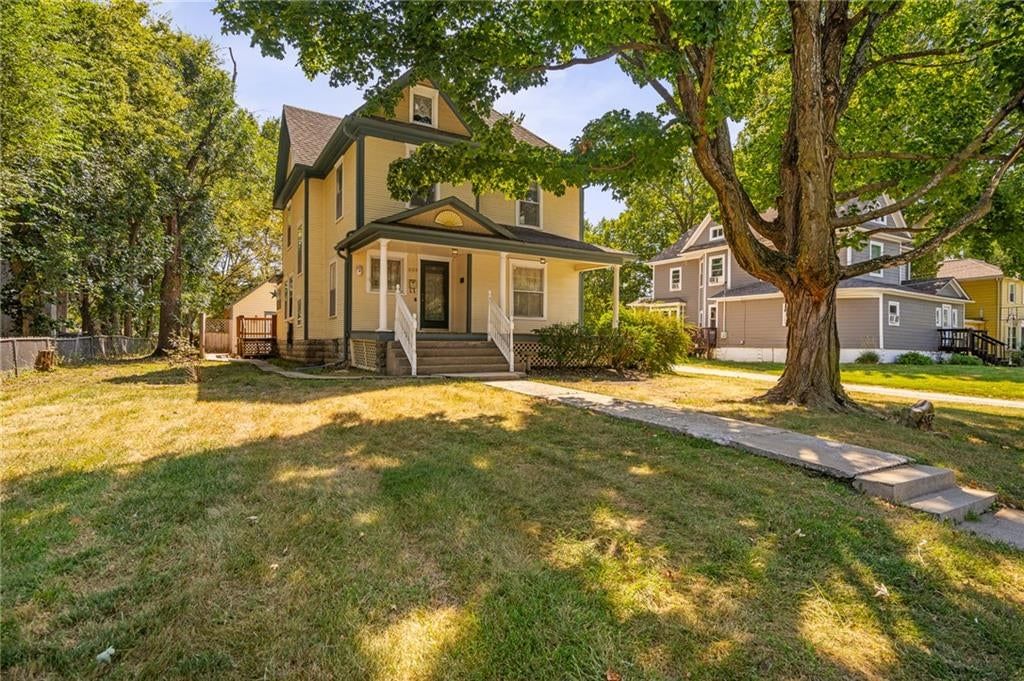
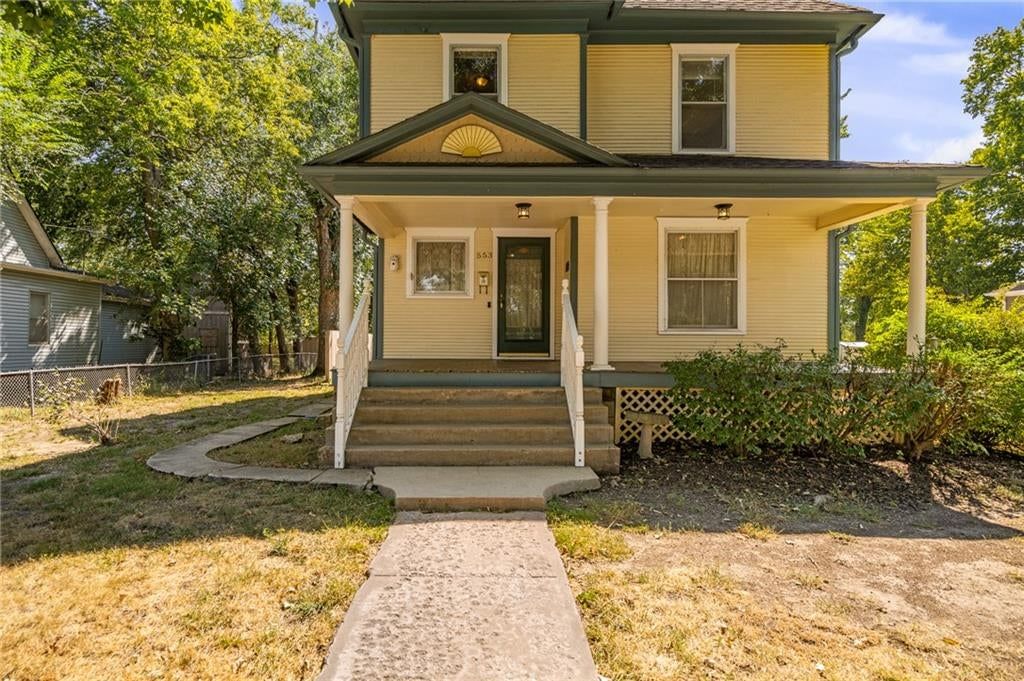
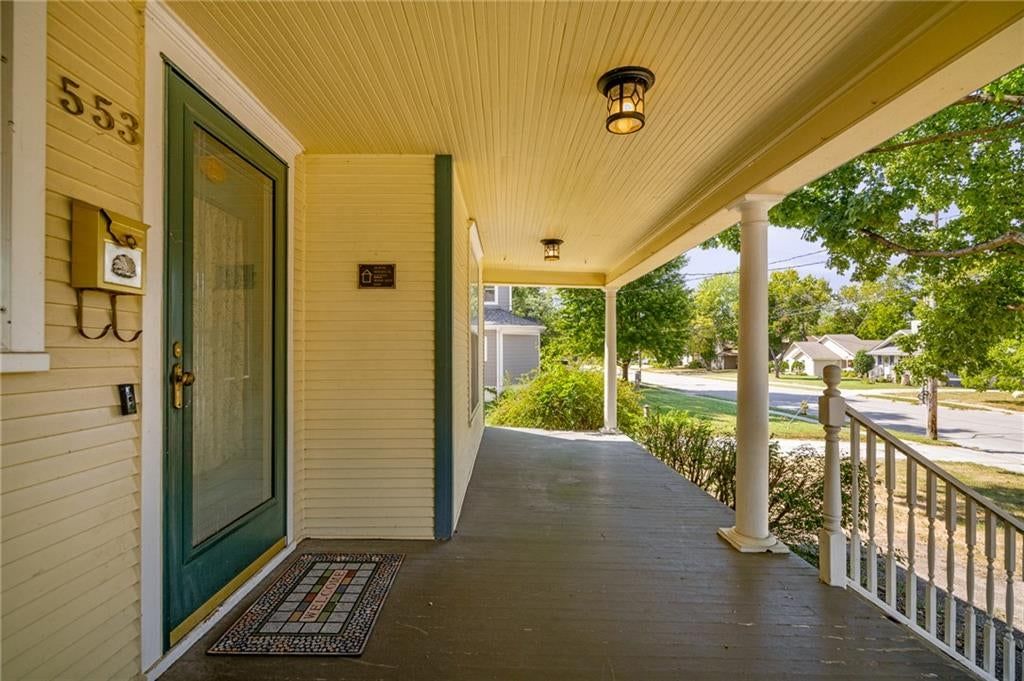
553 E Park Street, Olathe, KS
New · 1h ago


7106 Halsey Drive, Shawnee, KS
New · 3h ago

11104 W 109th Terrace, Overland Park, KS
New · 4h ago


13705 Springfield Road, Leawood, KS
New · 4h ago


1829 152nd Circle E, Olathe, KS
New · 5h ago


12714 W 49th Terrace, Shawnee, KS
New · 6h ago

22208 W 121st Street, Olathe, KS
New · 7h ago

4709 W 75TH Street, Prairie Village, KS
New · 7h ago


5506 W 82nd Place, Prairie Village, KS
New · 7h ago


7704 Tomahawk Road, Prairie Village, KS
New · 7h ago
16600 Switzer Road, Overland Park, KS
New · 7h ago

7402 Edgewood Boulevard, Shawnee, KS
New · 8h ago

12400 Sagamore Road, Leawood, KS
New · 8h ago

10952 S Barth Road, Olathe, KS
New · 10h ago

8512 W 139th Street, Overland Park, KS
New · 10h ago

14175 W 141st Terrace, Olathe, KS
New · 10h ago


7206 Noland Road, Shawnee, KS
New · 11h ago

7114 Larsen Street, Shawnee, KS
New · 12h ago

9612 W 116th Terrace, Overland Park, KS
New · 12h ago


11224 Rosewood Street, Leawood, KS
New · 13h ago

5409 Reeds Road, Mission, KS
New · 13h ago


24315 W 76th Street, Shawnee, KS
New · 14h ago

128 W Terrace Trail, Lake Quivira, KS
New · 14h ago
About Single Family Residence Homes in Johnson County, KS
Johnson County, KS has 1,488 single family residence homes for sale right now, with a median list price of $619,465 as of Sep 21 These single family residence homes were built between 1894 and 2027, ranging from 768 to 12,354 square feet.
Single Family Residence Homes market trends Johnson County, KS
Johnson County, KS: 1,782 homes for sale · 114 new in the last 7 days · median asking $625,000 · 543 price reductions · a median of 15 days to contract. 746 homes closed in the last 30 days, at a median of $490,000. At the pace of the last 90 days that is 2.22 months of supply.
| Measure | Aug 2026 |
|---|---|
| Median sale price | $465,000 |
| Median price per sq ft | $215 |
| Median days to contract | 17 |
| Sell-to-list ratio | 100% |
| Homes sold | 879 |
| New listings | 920 |
| Went under contract | 827 |
Single Family Residence Homes FAQs Johnson County, KS
How many single family residence homes are for sale in Johnson County, KS?
What is the median list price of single family residence homes in Johnson County, KS?
Schools serving Johnson County
How we compute these
- Median list.
- The middle asking price among the homes for sale right now. Half are listed above it, half below.
- For sale.
- Homes listed as active right now. A live count, not a monthly average.
Newly listed in Johnson County, KS
| Address | Price |
|---|---|
| 13705 Springfield Road | Price$2,485,000 |
| 7631 W 158th Terrace | Price$349,000 |
| 8500 W 148th Street | Price$600,000 |
| 3252 W 133rd Terrace | Price$1,970,000 |
| 14408 Marty Street | Price$475,000 |
| 11312 W 77th Street | Price$375,000 |
| 12001 S Rene Street | Price$500,000 |
| 1003 N Findley Street | Price$1,600,000 |
| 18420 W 205th Street | Price$438,205 |
| 2416 W 179th Street | Price$895,625 |
| 1002 N Findley Street | Price$1,600,000 |
| 36438 102nd Place | Price$416,990 |
Recently went under contract in Johnson County, KS
| Address | List price |
|---|---|
| 9128 Westbrooke Drive | List price$365,000 |
| 1907 W 139th Street | List price$375,000 |
| 12738 W 108TH Street | List price$349,000 |
| 9800 Walmer Street | List price$395,000 |
| 5400 W 51st Street | List price$339,000 |
| 1025 E Elm Street | List price$275,000 |
| 5943 El Monte Street | List price$495,000 |
| 5315 Mission Woods Terrace | List price$1,100,000 |
| 3906 W 143rd Street | List price$2,250,000 |
| 6925 Long Avenue | List price$384,900 |
| 13723 W 58th Terrace | List price$219,950 |
| 5311 W 50th Terrace | List price$259,000 |
How we compute these
- Under contract.
- Homes with an accepted contract that have not closed yet. A live count.
- Days to contract.
- The middle number of days between a home being listed and going under contract, over the last 90 days of closings. It is not days-to-close, and it is not how long today's listings have been sitting. Newly built homes are excluded, because a build finishing is not a market moving.
Popular home searches in Johnson County
| Search | For sale |
|---|---|
| Open houses | 134 |
| Luxury homes | 305 |
| Just listed homes | 215 |
| Price-reduced homes | 544 |
| Coming soon homes | 216 |
| Homes under contract | 1,146 |
How we compute these
- For sale.
- Homes listed as active right now. A live count, not a monthly average.
Homes by price in Johnson County
How we compute these
- For sale.
- Homes listed as active right now. A live count, not a monthly average.
Homes by feature in Johnson County
How we compute these
- For sale.
- Homes listed as active right now. A live count, not a monthly average.
Search by property type in Johnson County
| Property type | Median sale |
|---|---|
| Single Family | $485,000 |
| Townhouse | $321,000 |
| Villa | Median— |
| Condo / Loft | $217,500 |
| Half Duplex | Median— |
| Duplex | Median— |
| Triplex | Median— |
| Lots / Land | $319,000 |
How we compute these
- Market.
- Market type is set by months of supply — how long it would take to sell every home for sale at the current pace. Under ~4 months favors sellers (low inventory, faster sales, homes near or above asking); over ~6 favors buyers (more choice, more negotiating room). 4–6 is balanced.
- Months supply.
- How many months it would take to sell every home now for sale at the pace of the last 90 days: homes for sale ÷ (closings in the last 90 days ÷ 3).
- For sale.
- Homes listed as active right now. A live count, not a monthly average.
- Days to contract.
- The middle number of days between a home being listed and going under contract, over the last 90 days of closings. It is not days-to-close, and it is not how long today's listings have been sitting. Newly built homes are excluded, because a build finishing is not a market moving.
- Coming soon.
- Homes announced but not yet accepting showings. A live count.
- Under contract.
- Homes with an accepted contract that have not closed yet. A live count.
Search homes in Johnson County
| City | Median list |
|---|---|
| Overland Park | $747,232 |
| Olathe | $629,950 |
| Shawnee | $550,000 |
| Lenexa | $651,475 |
| Leawood | $980,000 |
| Prairie Village | $1,199,000 |
How we compute these
- Market.
- Market type is set by months of supply — how long it would take to sell every home for sale at the current pace. Under ~4 months favors sellers (low inventory, faster sales, homes near or above asking); over ~6 favors buyers (more choice, more negotiating room). 4–6 is balanced.
- Months supply.
- How many months it would take to sell every home now for sale at the pace of the last 90 days: homes for sale ÷ (closings in the last 90 days ÷ 3).
- Median list.
- The middle asking price among the homes for sale right now. Half are listed above it, half below.
- Days to contract.
- The middle number of days between a home being listed and going under contract, over the last 90 days of closings. It is not days-to-close, and it is not how long today's listings have been sitting. Newly built homes are excluded, because a build finishing is not a market moving.
- For sale.
- Homes listed as active right now. A live count, not a monthly average.
- Coming soon.
- Homes announced but not yet accepting showings. A live count.
- Under contract.
- Homes with an accepted contract that have not closed yet. A live count.
ZIP codes in Johnson County
How we compute these
- Market.
- Market type is set by months of supply — how long it would take to sell every home for sale at the current pace. Under ~4 months favors sellers (low inventory, faster sales, homes near or above asking); over ~6 favors buyers (more choice, more negotiating room). 4–6 is balanced.
- Months supply.
- How many months it would take to sell every home now for sale at the pace of the last 90 days: homes for sale ÷ (closings in the last 90 days ÷ 3).
- Median list.
- The middle asking price among the homes for sale right now. Half are listed above it, half below.
- Days to contract.
- The middle number of days between a home being listed and going under contract, over the last 90 days of closings. It is not days-to-close, and it is not how long today's listings have been sitting. Newly built homes are excluded, because a build finishing is not a market moving.
- For sale.
- Homes listed as active right now. A live count, not a monthly average.
- Coming soon.
- Homes announced but not yet accepting showings. A live count.
- Under contract.
- Homes with an accepted contract that have not closed yet. A live count.
Search homes for sale in every city we cover
How we compute these
- Market.
- Market type is set by months of supply — how long it would take to sell every home for sale at the current pace. Under ~4 months favors sellers (low inventory, faster sales, homes near or above asking); over ~6 favors buyers (more choice, more negotiating room). 4–6 is balanced.
- Months supply.
- How many months it would take to sell every home now for sale at the pace of the last 90 days: homes for sale ÷ (closings in the last 90 days ÷ 3).
- Median list.
- The middle asking price among the homes for sale right now. Half are listed above it, half below.
- Days to contract.
- The middle number of days between a home being listed and going under contract, over the last 90 days of closings. It is not days-to-close, and it is not how long today's listings have been sitting. Newly built homes are excluded, because a build finishing is not a market moving.
- For sale.
- Homes listed as active right now. A live count, not a monthly average.
- Coming soon.
- Homes announced but not yet accepting showings. A live count.
- Under contract.
- Homes with an accepted contract that have not closed yet. A live count.
Search for homes in popular markets
| Market | For sale |
|---|---|
| Heritage Ranch | 29 |
| Ruskin Heights | 26 |
| Canyon Lakes | 25 |
| Seven Bridges | 24 |
| Garrett Ranch | 24 |
| Tomahawk Valley | 23 |
How we compute these
- Market.
- Market type is set by months of supply — how long it would take to sell every home for sale at the current pace. Under ~4 months favors sellers (low inventory, faster sales, homes near or above asking); over ~6 favors buyers (more choice, more negotiating room). 4–6 is balanced.
- For sale.
- Homes listed as active right now. A live count, not a monthly average.
Or go wider still county, metro and state
How we compute these
- Market.
- Market type is set by months of supply — how long it would take to sell every home for sale at the current pace. Under ~4 months favors sellers (low inventory, faster sales, homes near or above asking); over ~6 favors buyers (more choice, more negotiating room). 4–6 is balanced.
- Months supply.
- How many months it would take to sell every home now for sale at the pace of the last 90 days: homes for sale ÷ (closings in the last 90 days ÷ 3).
- Median list.
- The middle asking price among the homes for sale right now. Half are listed above it, half below.
- Days to contract.
- The middle number of days between a home being listed and going under contract, over the last 90 days of closings. It is not days-to-close, and it is not how long today's listings have been sitting. Newly built homes are excluded, because a build finishing is not a market moving.
- For sale.
- Homes listed as active right now. A live count, not a monthly average.
- Coming soon.
- Homes announced but not yet accepting showings. A live count.
- Under contract.
- Homes with an accepted contract that have not closed yet. A live count.