
Homes Under $200K for Sale in Johnson County, KS
36 homes fit this search · Sorted by Newest Listed


224 S Walnut Street, Olathe, KS
New · 12h ago


6216 Robinson Street, Overland Park, KS
New · 21h ago

5733 Dearborn Street, Mission, KS
New · 1d ago


8227 Santa Fe Drive, Overland Park, KS
New · 2d ago


12836 110 Terrace, Overland Park, KS
New · 7d ago


10124 W 96th Street, Overland Park, KS


10758 Glenwood Street, Overland Park, KS


5400 Foster Street, Overland Park, KS


12723 W 110th Terrace, Overland Park, KS


205 N Mahaffie Street, Olathe, KS


20234 W 90th Terrace, Lenexa, KS


5716 Metcalf Court, Overland Park, KS


600 S Edgemere Drive, Olathe, KS


7800 W 123rd Street, Overland Park, KS


4727 Park Street, Shawnee, KS


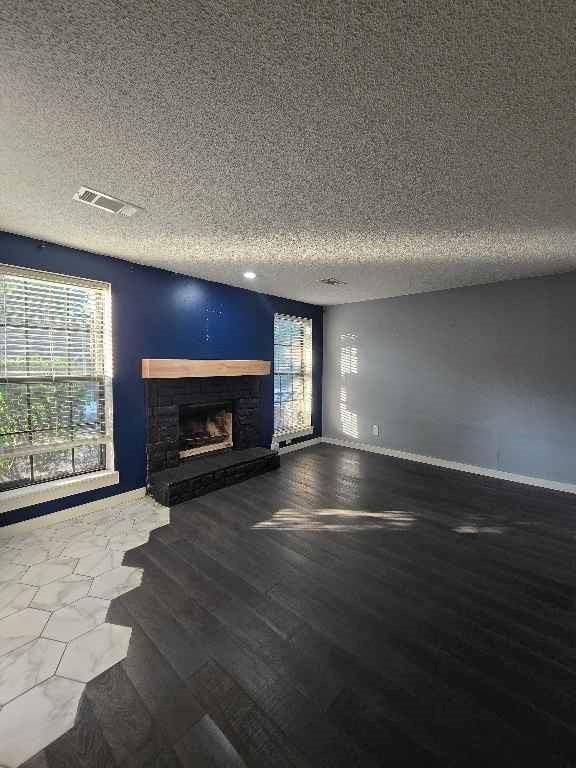
12706 W 110th Terrace, Overland Park, KS


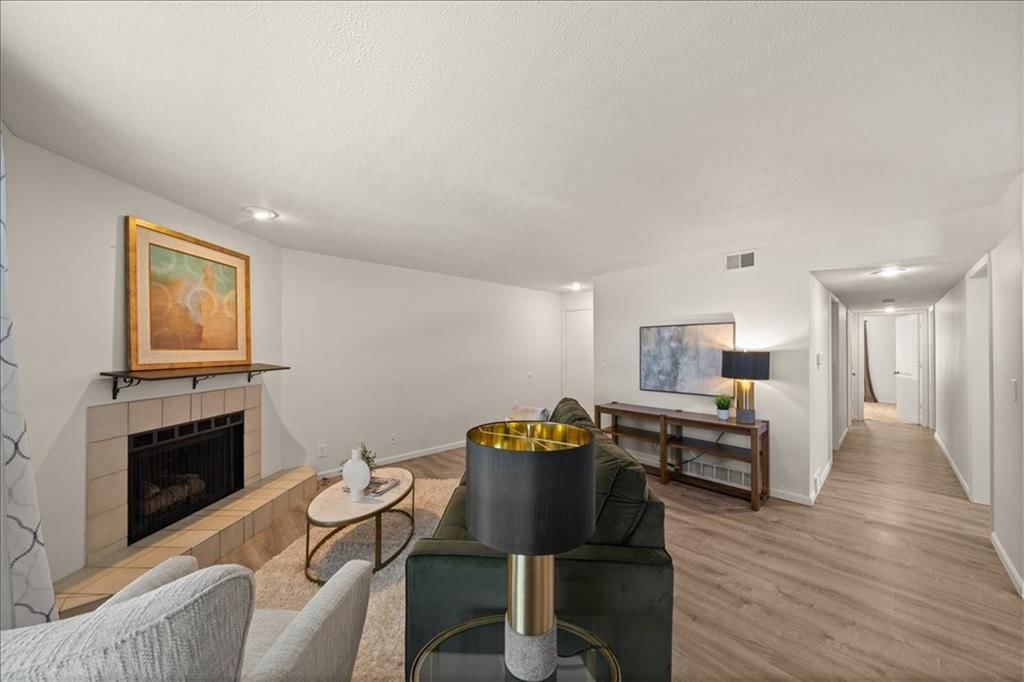
11110 Nieman #101 Road, Overland Park, KS
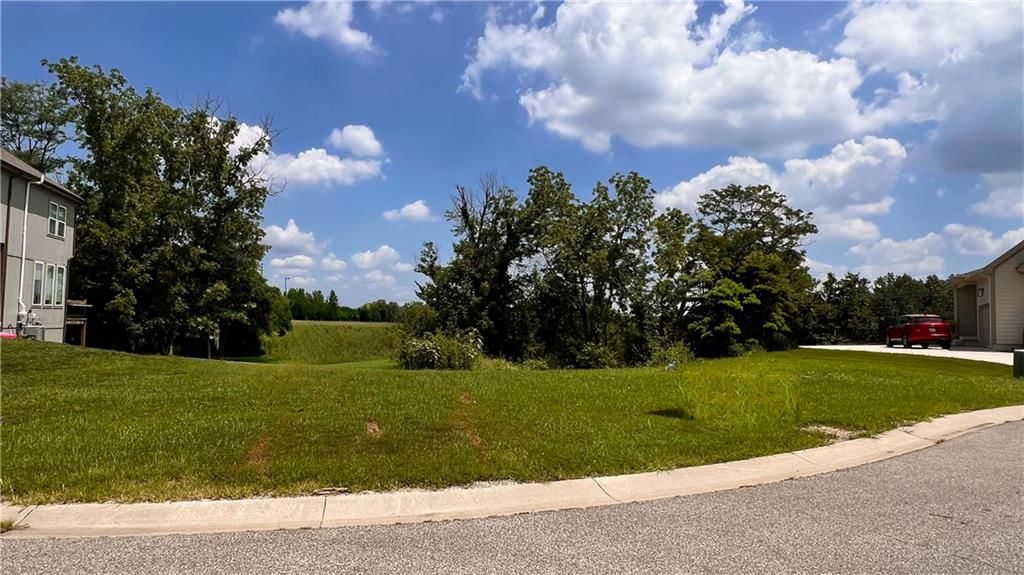

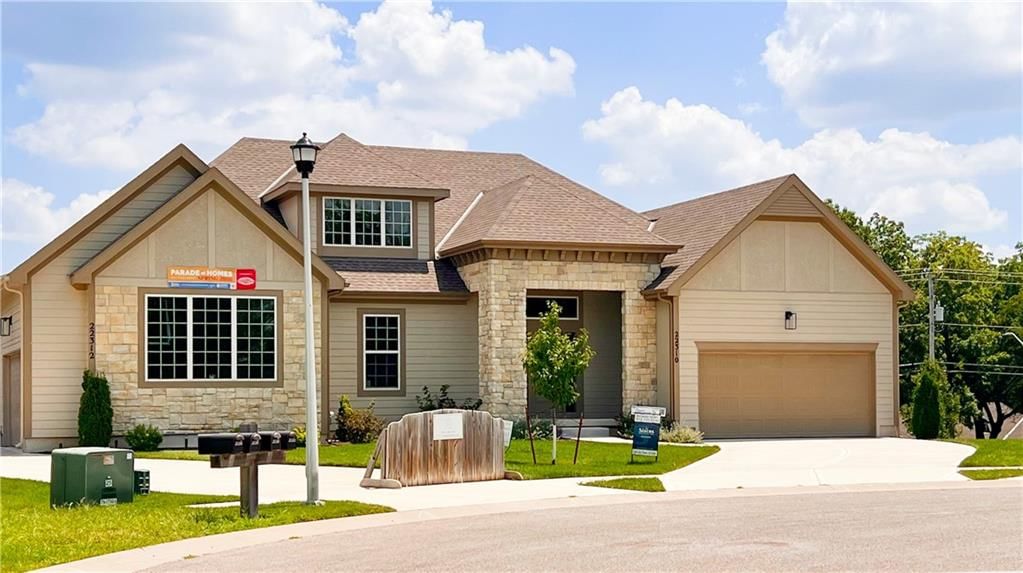
22316-22318 W 76th Street, Shawnee, KS


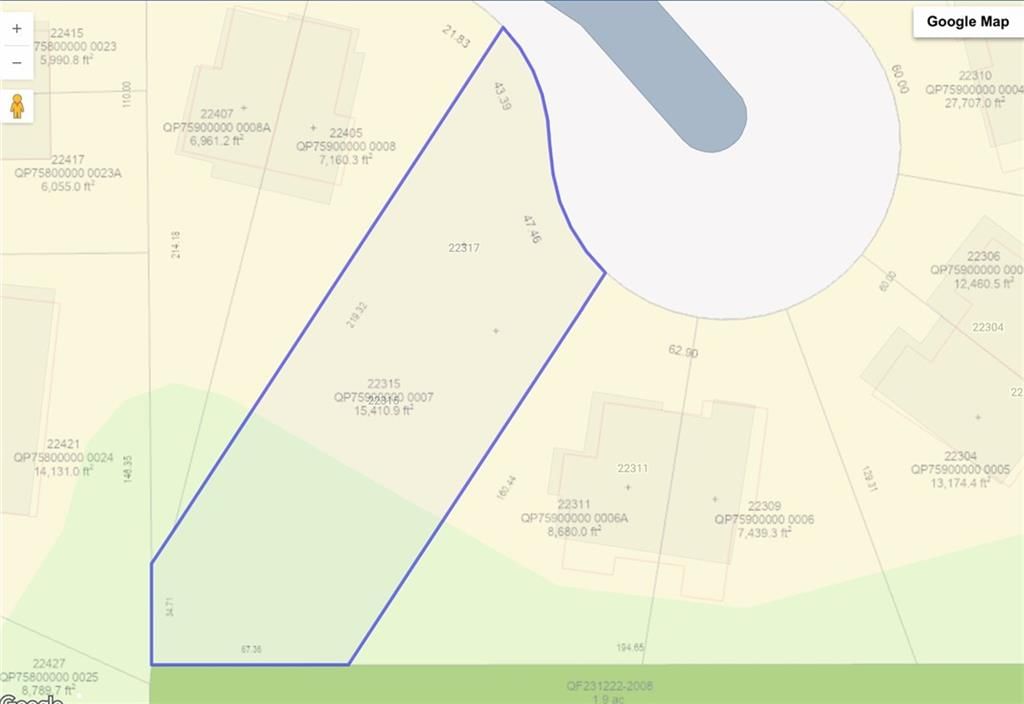
22315-22317 W 76th Street, Shawnee, KS
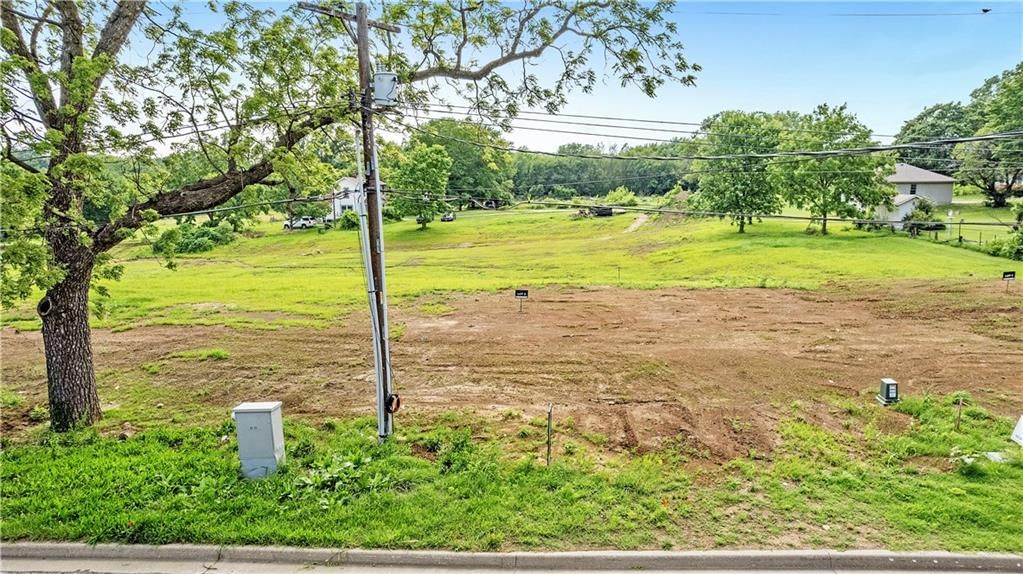


4710 Knox Avenue, Merriam, KS


4706 Knox Avenue, Merriam, KS


knox Avenue, Merriam, KS


31065 W 199th Street, Edgerton, KS


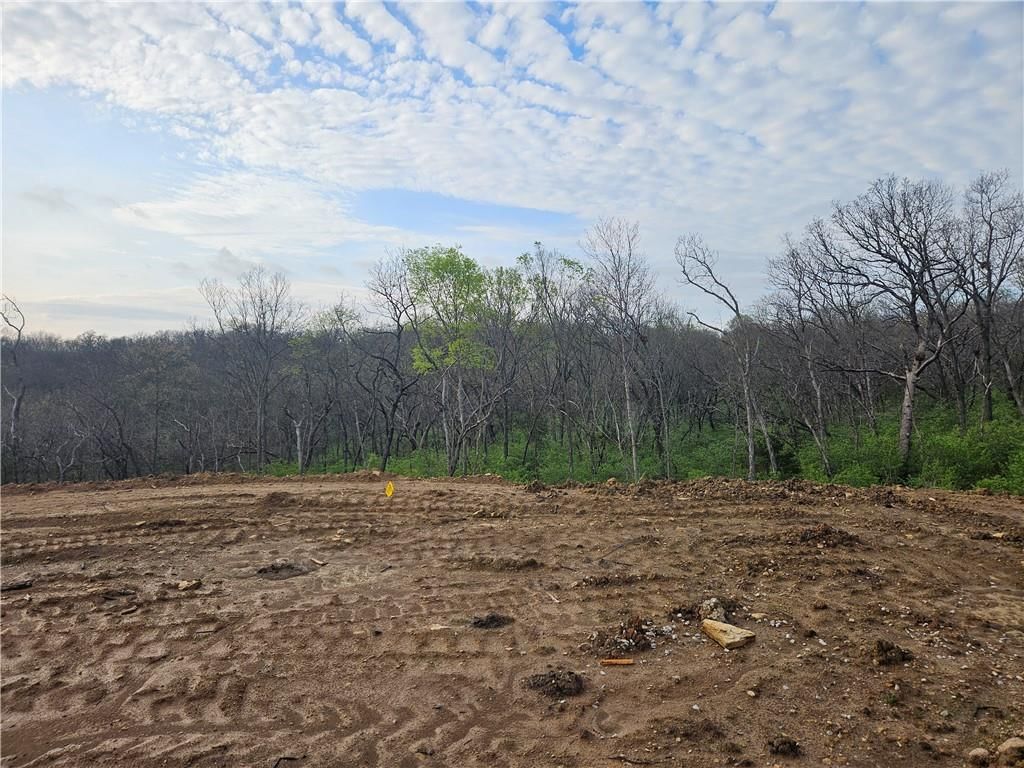
7031 Oak Ridge Drive, Shawnee, KS
About Homes Under $200K inJohnson County, KS
Johnson County, KS has 36 homes under $200k for sale right now, with a median list price of $614,950 as of Sep 19 These homes under $200k were built between 1900 and 2023, ranging from 720 to 1,781 square feet.
Homes Under $200K market trendsJohnson County, KS
Johnson County, KS: 1,842 homes for sale · 152 new in the last 7 days · median asking $619,465 · 539 price reductions · a median of 15 days to contract. 813 homes closed in the last 30 days, at a median of $490,000. At the pace of the last 90 days that is 2.24 months of supply.
| Measure | Aug 2026 |
|---|---|
| Median sale price | $465,000 |
| Median price per sq ft | $215 |
| Median days to contract | 17 |
| Sell-to-list ratio | 100% |
| Homes sold | 879 |
| New listings | 920 |
| Went under contract | 829 |
Homes Under $200K FAQsJohnson County, KS
How many homes under $200k are for sale in Johnson County, KS?
What is the median list price of homes under $200k in Johnson County, KS?
Schoolsserving Johnson County
How we compute these
- Median list.
- The middle asking price among the homes for sale right now. Half are listed above it, half below.
- For sale.
- Homes listed as active right now. A live count, not a monthly average.
Newly listedin Johnson County, KS
| Address | Price |
|---|---|
| 17308 Oakshire Street | Price$1,100,000 |
| 31687 W 172nd Street | Price$329,990 |
| 5406 Ash Street | Price$334,950 |
| 224 S Walnut Street | Price$130,000 |
| 9636 Outlook Drive | Price$576,000 |
| 2809 W 175th Place | Price$1,699,900 |
| 11656 Deer Run Street | Price$539,000 |
| 7020 Widmer Road | Price$330,000 |
| 22312 W 76th Street | Price$488,360 |
| 5600 Roe Boulevard | Price$425,000 |
| 725 N Willie Street | Price$321,900 |
| 10906 W 173rd Terrace | Price$1,950,000 |
Recently went under contractin Johnson County, KS
| Address | List price |
|---|---|
| 9708 England Drive | List price$375,000 |
| 10106 W 96th-#C Terrace | List price$155,000 |
| 4831 Reeder Street | List price$249,000 |
| 7128 Allman Drive | List price$500,000 |
| 5411 W 50th Street | List price$319,000 |
| 4808 W 158th Place | List price$689,000 |
| 5204 W 83RD Terrace | List price$1,190,000 |
| 6658 Dearborn Drive | List price$650,000 |
| 7001 Dearborn Street | List price$265,000 |
| 8901 W 98th Terrace | List price$295,000 |
| 11395 Gardner Road | List price$850,000 |
| 10804 Horton Street | List price$505,000 |
How we compute these
- Under contract.
- Homes with an accepted contract that have not closed yet. A live count.
- Days to contract.
- The middle number of days between a home being listed and going under contract, over the last 90 days of closings. It is not days-to-close, and it is not how long today's listings have been sitting. Newly built homes are excluded, because a build finishing is not a market moving.
Popular home searchesin Johnson County
| Search | For sale |
|---|---|
| Open houses | 462 |
| Luxury homes | 308 |
| Just listed homes | 233 |
| Price-reduced homes | 540 |
| Coming soon homes | 184 |
| Homes under contract | 1,094 |
How we compute these
- For sale.
- Homes listed as active right now. A live count, not a monthly average.
Homes by pricein Johnson County
How we compute these
- For sale.
- Homes listed as active right now. A live count, not a monthly average.
Homes by featurein Johnson County
How we compute these
- For sale.
- Homes listed as active right now. A live count, not a monthly average.
Search by property typein Johnson County
| Property type | Median sale |
|---|---|
| Single Family | $486,500 |
| Townhouse | $320,500 |
| Villa | Median— |
| Condo / Loft | $220,500 |
| Half Duplex | Median— |
| Duplex | Median— |
| Triplex | Median— |
| Lots / Land | $319,000 |
How we compute these
- Market.
- Market type is set by months of supply — how long it would take to sell every home for sale at the current pace. Under ~4 months favors sellers (low inventory, faster sales, homes near or above asking); over ~6 favors buyers (more choice, more negotiating room). 4–6 is balanced.
- Months supply.
- How many months it would take to sell every home now for sale at the pace of the last 90 days: homes for sale ÷ (closings in the last 90 days ÷ 3).
- For sale.
- Homes listed as active right now. A live count, not a monthly average.
- Days to contract.
- The middle number of days between a home being listed and going under contract, over the last 90 days of closings. It is not days-to-close, and it is not how long today's listings have been sitting. Newly built homes are excluded, because a build finishing is not a market moving.
- Coming soon.
- Homes announced but not yet accepting showings. A live count.
- Under contract.
- Homes with an accepted contract that have not closed yet. A live count.
Search homesin Johnson County
| City | Median list |
|---|---|
| Overland Park | $744,925 |
| Olathe | $626,705 |
| Shawnee | $529,950 |
| Lenexa | $649,300 |
| Leawood | $980,000 |
| Prairie Village | $1,195,000 |
How we compute these
- Market.
- Market type is set by months of supply — how long it would take to sell every home for sale at the current pace. Under ~4 months favors sellers (low inventory, faster sales, homes near or above asking); over ~6 favors buyers (more choice, more negotiating room). 4–6 is balanced.
- Months supply.
- How many months it would take to sell every home now for sale at the pace of the last 90 days: homes for sale ÷ (closings in the last 90 days ÷ 3).
- Median list.
- The middle asking price among the homes for sale right now. Half are listed above it, half below.
- Days to contract.
- The middle number of days between a home being listed and going under contract, over the last 90 days of closings. It is not days-to-close, and it is not how long today's listings have been sitting. Newly built homes are excluded, because a build finishing is not a market moving.
- For sale.
- Homes listed as active right now. A live count, not a monthly average.
- Coming soon.
- Homes announced but not yet accepting showings. A live count.
- Under contract.
- Homes with an accepted contract that have not closed yet. A live count.
ZIP codesin Johnson County
How we compute these
- Market.
- Market type is set by months of supply — how long it would take to sell every home for sale at the current pace. Under ~4 months favors sellers (low inventory, faster sales, homes near or above asking); over ~6 favors buyers (more choice, more negotiating room). 4–6 is balanced.
- Months supply.
- How many months it would take to sell every home now for sale at the pace of the last 90 days: homes for sale ÷ (closings in the last 90 days ÷ 3).
- Median list.
- The middle asking price among the homes for sale right now. Half are listed above it, half below.
- Days to contract.
- The middle number of days between a home being listed and going under contract, over the last 90 days of closings. It is not days-to-close, and it is not how long today's listings have been sitting. Newly built homes are excluded, because a build finishing is not a market moving.
- For sale.
- Homes listed as active right now. A live count, not a monthly average.
- Coming soon.
- Homes announced but not yet accepting showings. A live count.
- Under contract.
- Homes with an accepted contract that have not closed yet. A live count.
Search homes for salein every city we cover
How we compute these
- Market.
- Market type is set by months of supply — how long it would take to sell every home for sale at the current pace. Under ~4 months favors sellers (low inventory, faster sales, homes near or above asking); over ~6 favors buyers (more choice, more negotiating room). 4–6 is balanced.
- Months supply.
- How many months it would take to sell every home now for sale at the pace of the last 90 days: homes for sale ÷ (closings in the last 90 days ÷ 3).
- Median list.
- The middle asking price among the homes for sale right now. Half are listed above it, half below.
- Days to contract.
- The middle number of days between a home being listed and going under contract, over the last 90 days of closings. It is not days-to-close, and it is not how long today's listings have been sitting. Newly built homes are excluded, because a build finishing is not a market moving.
- For sale.
- Homes listed as active right now. A live count, not a monthly average.
- Coming soon.
- Homes announced but not yet accepting showings. A live count.
- Under contract.
- Homes with an accepted contract that have not closed yet. A live count.
Search for homesin popular markets
| Market | For sale |
|---|---|
| Heritage Ranch | 28 |
| Ruskin Heights | 25 |
| Canyon Lakes | 25 |
| Garrett Ranch | 24 |
| Seven Bridges | 23 |
| Tomahawk Valley | 23 |
How we compute these
- Market.
- Market type is set by months of supply — how long it would take to sell every home for sale at the current pace. Under ~4 months favors sellers (low inventory, faster sales, homes near or above asking); over ~6 favors buyers (more choice, more negotiating room). 4–6 is balanced.
- For sale.
- Homes listed as active right now. A live count, not a monthly average.
Or go wider stillcounty, metro and state
How we compute these
- Market.
- Market type is set by months of supply — how long it would take to sell every home for sale at the current pace. Under ~4 months favors sellers (low inventory, faster sales, homes near or above asking); over ~6 favors buyers (more choice, more negotiating room). 4–6 is balanced.
- Months supply.
- How many months it would take to sell every home now for sale at the pace of the last 90 days: homes for sale ÷ (closings in the last 90 days ÷ 3).
- Median list.
- The middle asking price among the homes for sale right now. Half are listed above it, half below.
- Days to contract.
- The middle number of days between a home being listed and going under contract, over the last 90 days of closings. It is not days-to-close, and it is not how long today's listings have been sitting. Newly built homes are excluded, because a build finishing is not a market moving.
- For sale.
- Homes listed as active right now. A live count, not a monthly average.
- Coming soon.
- Homes announced but not yet accepting showings. A live count.
- Under contract.
- Homes with an accepted contract that have not closed yet. A live count.