
Jackson County MO Real Estate & Homes For Sale
· 2,940 homes for sale in Jackson CountyHouseLoop Vision identified 1,182 homes for sale in Jackson County, MO with white kitchen cabinets, 266 with a freestanding tub, 65 with a pool, 195 with a home gym, 1,601 with a big backyard and 881 with a finished basement, plus 4 more features. See what HouseLoop Vision found
2,940 homes for sale in Jackson County · Sorted by Newest Listed
Real estate in Jackson County, Missouri
Jackson County, MO has about 306,798 households and a median household income of $68,577. Roughly 59% of homes are owner-occupied, the median owner's home value is $230,500, 34% of adults hold a bachelor's degree or higher. The average commute runs 23.4 minutes. About 719,976 people live in Jackson County, MO, per the U.S. Census Bureau's American Community Survey 5-year estimate (2020–2024). New construction is still adding supply: 514 building permits were issued in September 2026.
The short answer: waiting hasn't paid off here. Well-priced homes in good condition still attract multiple offers fast. Sellers who price realistically move. Sellers who test the market learn a hard lesson around day 45.
Kansas City proper is the county's anchor and its most complicated market. Neighborhoods like Brookside, Waldo, and the Crossroads attract buyers who want walkability, character homes from the 1920s and 30s, and proximity to some of the best restaurants in the metro.
Independence is the county's most underrated value play. The Truman area and Sugar Creek neighborhoods have loyal buyer pools. Lee's Summit, on the southern end, is where families with school-age kids tend to land. The Lee's Summit R-7 school district consistently draws buyers willing to pay a premium, and the downtown has enough coffee shops and locally-owned restaurants to feel like a real town, not just a suburb.
Blue Springs sits just east of Lee's Summit and offers similar family-oriented appeal at a slight discount — good schools, newer subdivisions, easy access to I-70, and a lot of ranch and two-story homes built between the 1980s and 2000s. Raytown and Grandview are the county's most affordable incorporated cities for buyers who need to stretch a budget without leaving the metro area entirely. Both have older housing stock, which means more maintenance risk but also more square footage per dollar. Grain Valley, Oak Grove, and Lone Jack represent the county's eastern frontier — newer construction, larger lots, quieter pace, and a tradeoff of longer commutes into Kansas City. Greenwood is small and semi-rural, with acreage properties that attract buyers who want space without leaving Jackson County.
That means charm, and it means costs.
Housing market trends in Jackson County, Missouri
| Measure | Oct 2026 | Sep 2026 | Oct 2025 |
|---|---|---|---|
| Median sale price | $286,700 | $285,000 | $279,000 |
| Median price per sq ft | $160 | $159 | $159 |
| Median days to contract | 25 | 23 | 22 |
| Sell-to-list ratio | 100% | 100% | 100% |
| Homes sold | 783 | 881 | 738 |
| New listings | 1,238 | 1,221 | 888 |
| Went under contract | 790 | 782 | 681 |
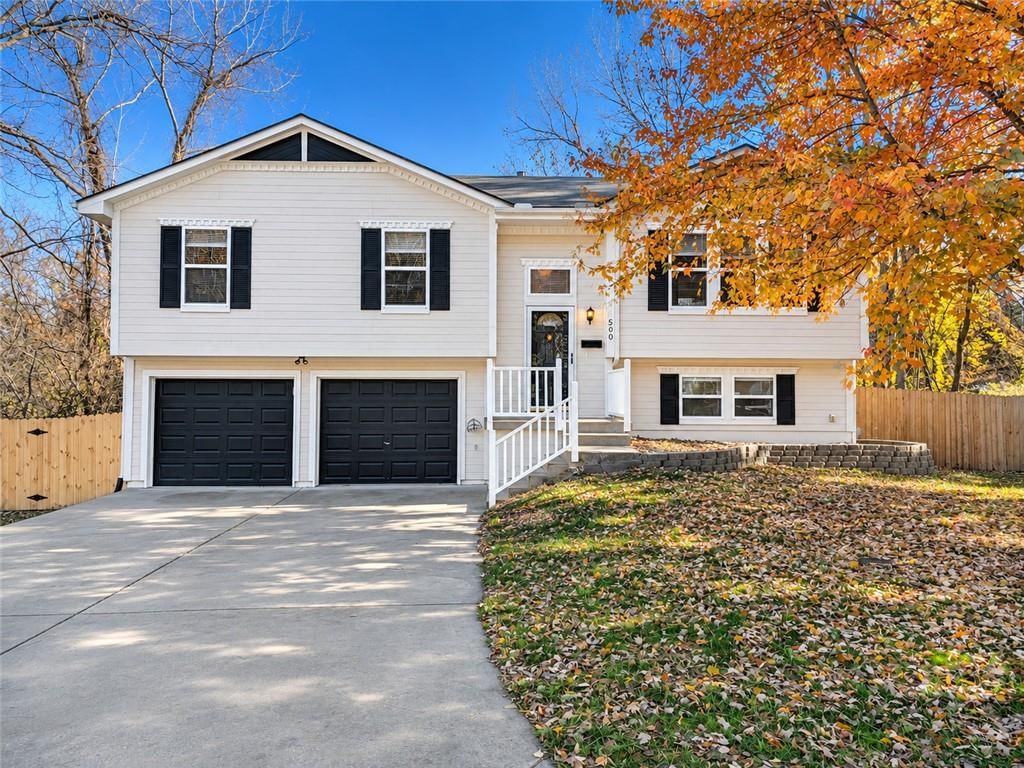
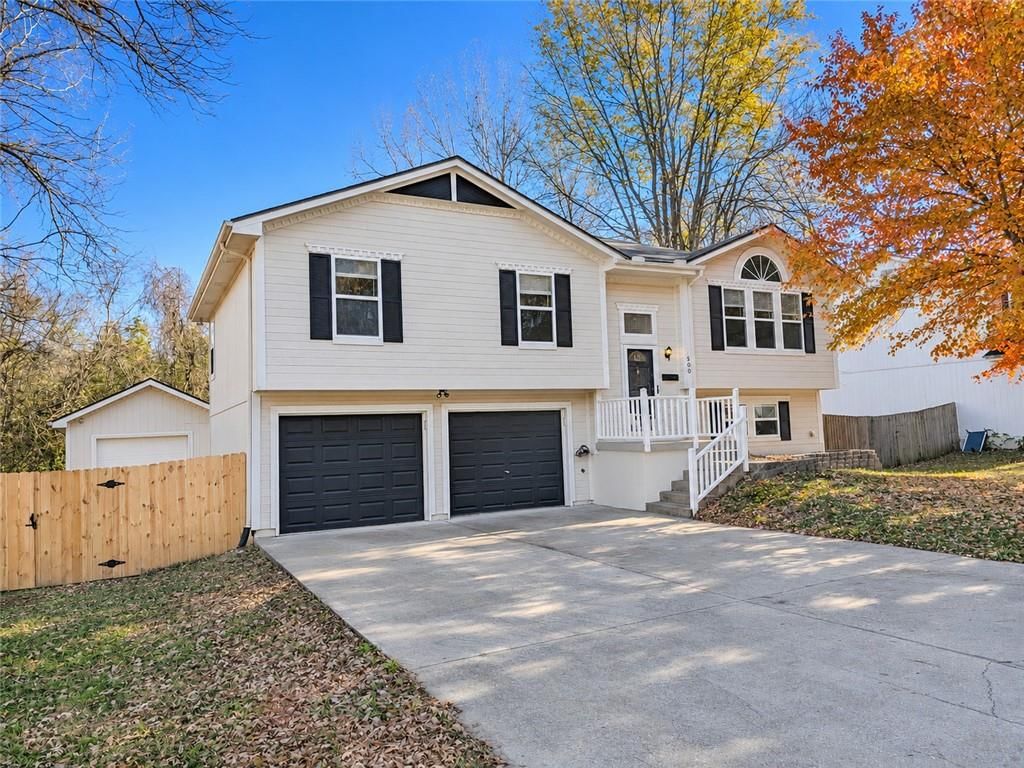
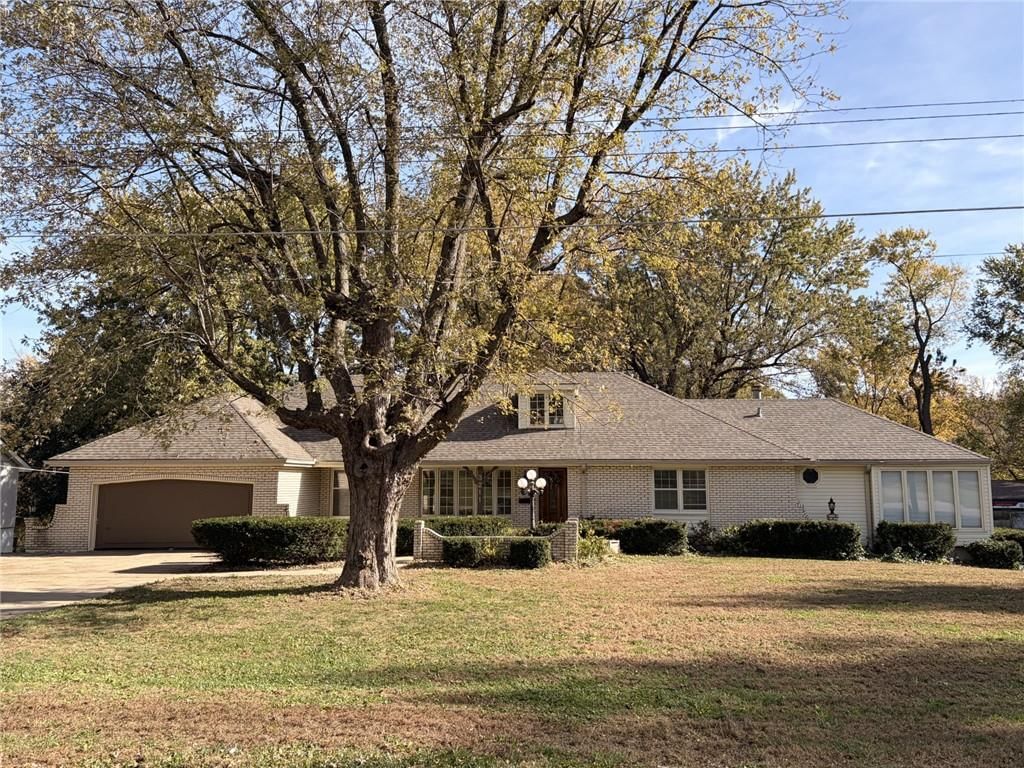
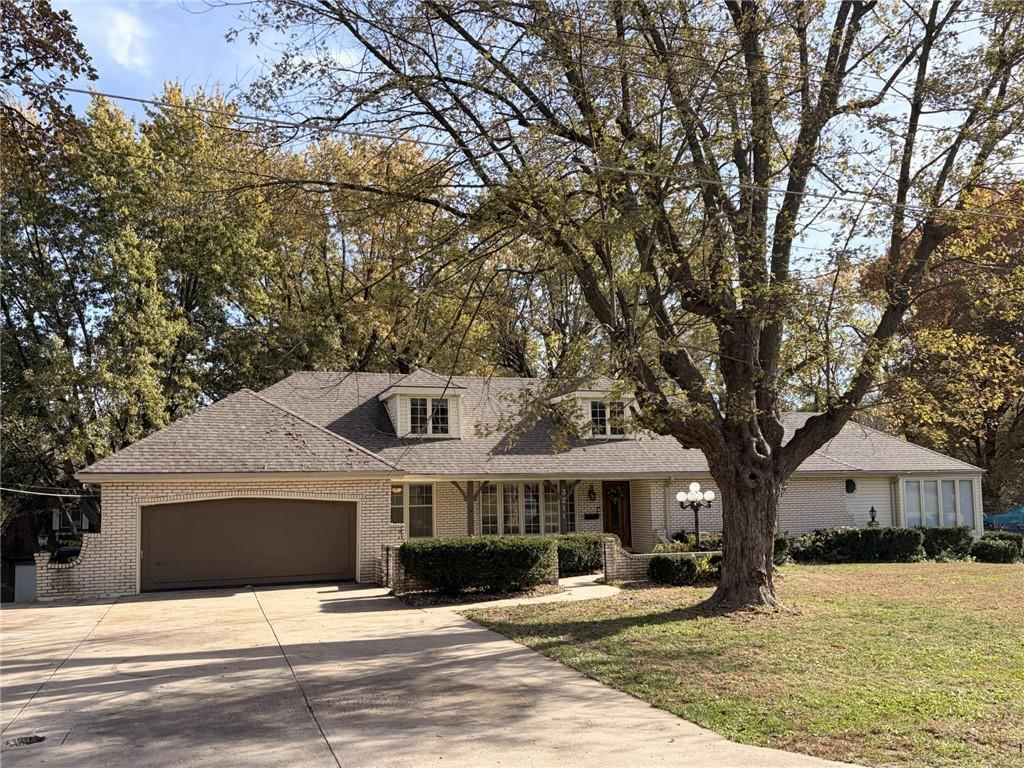
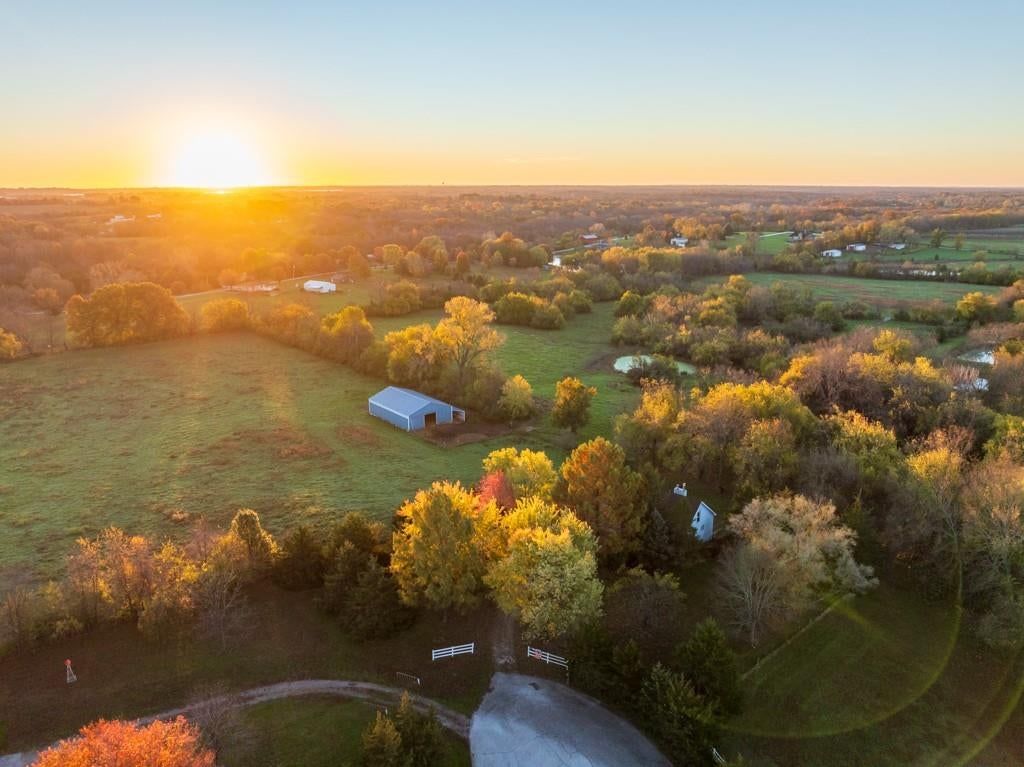
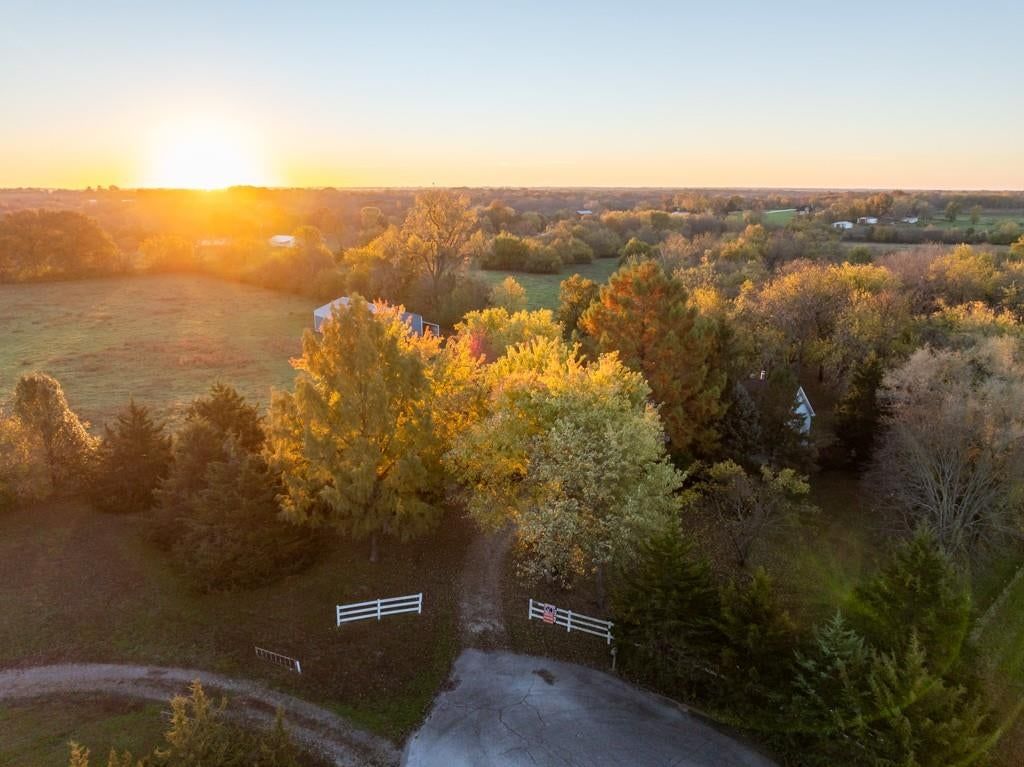
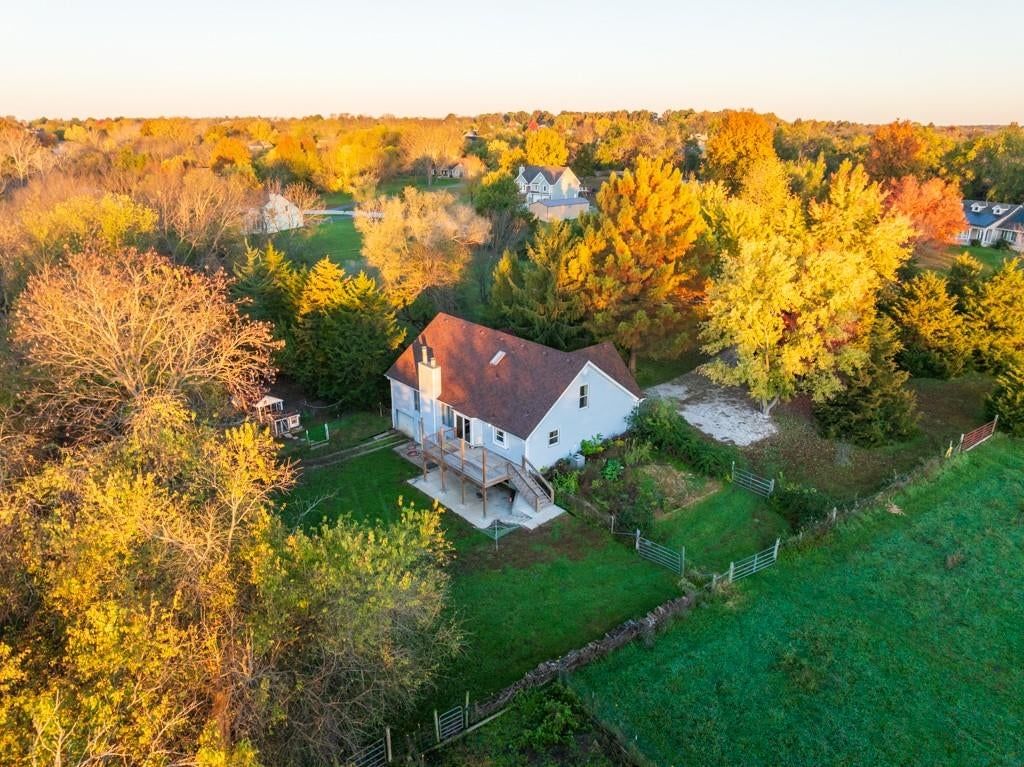
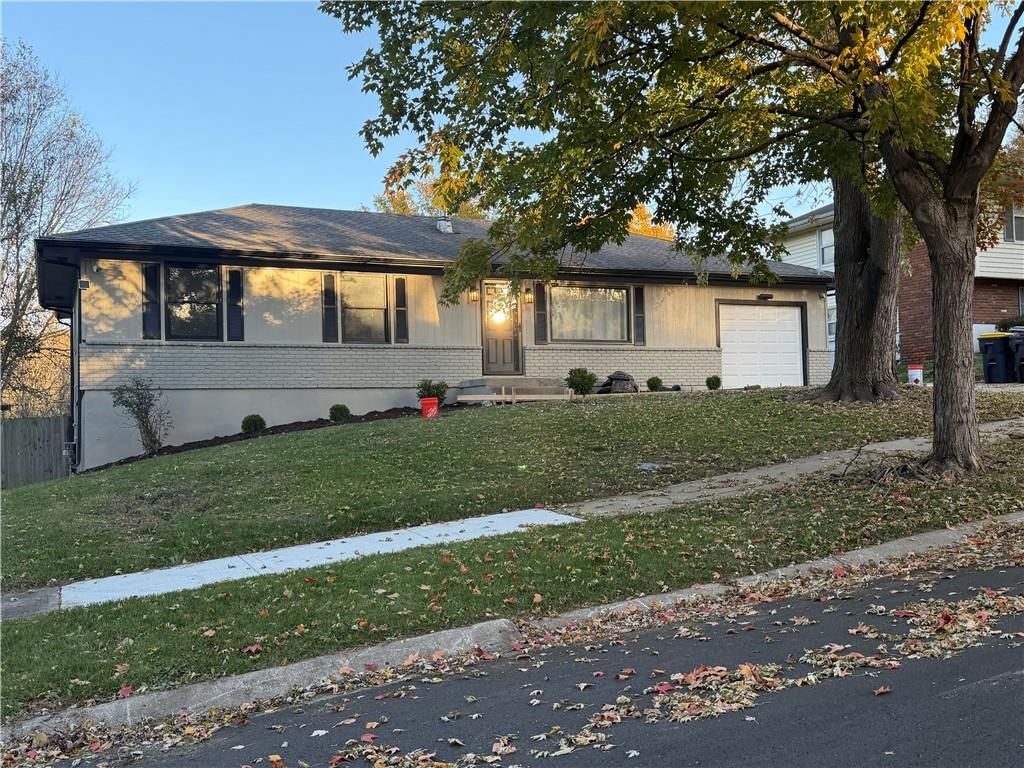
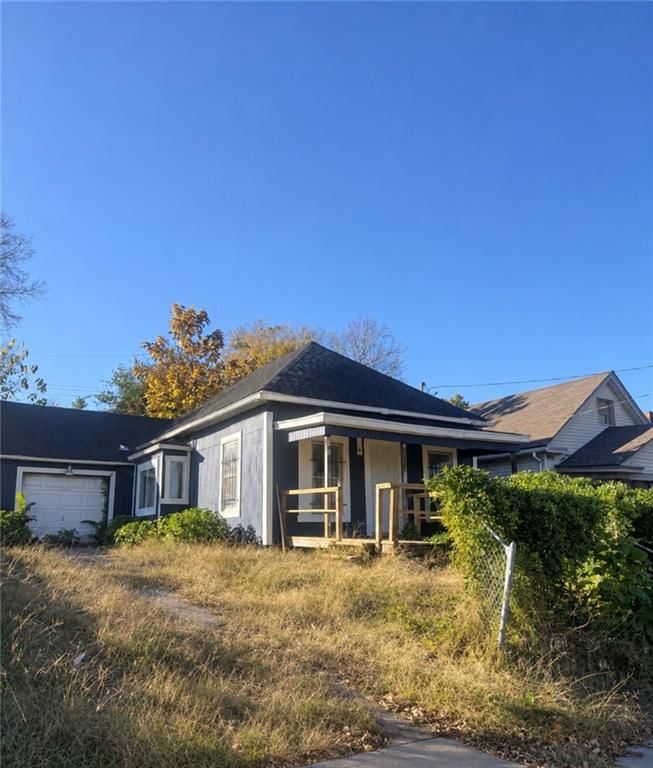
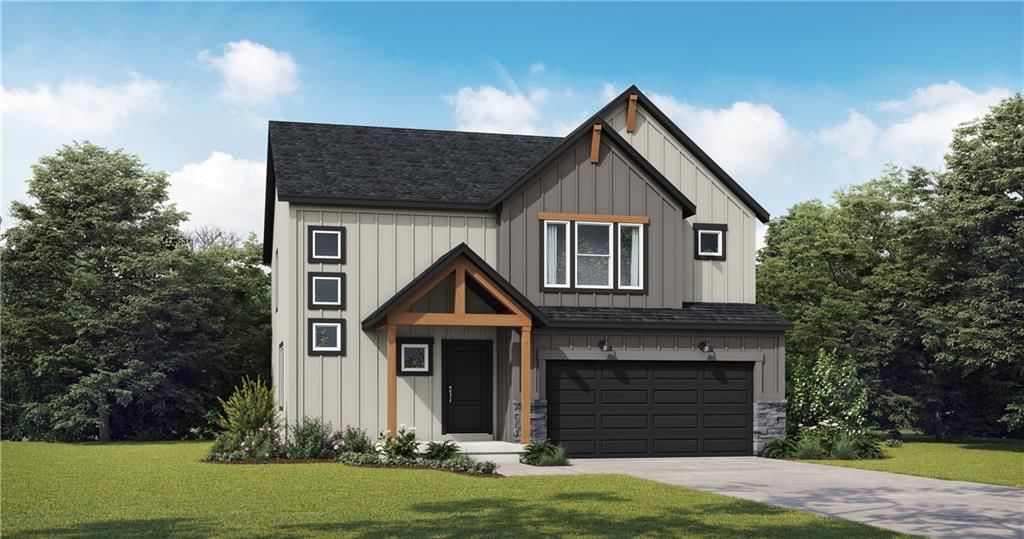
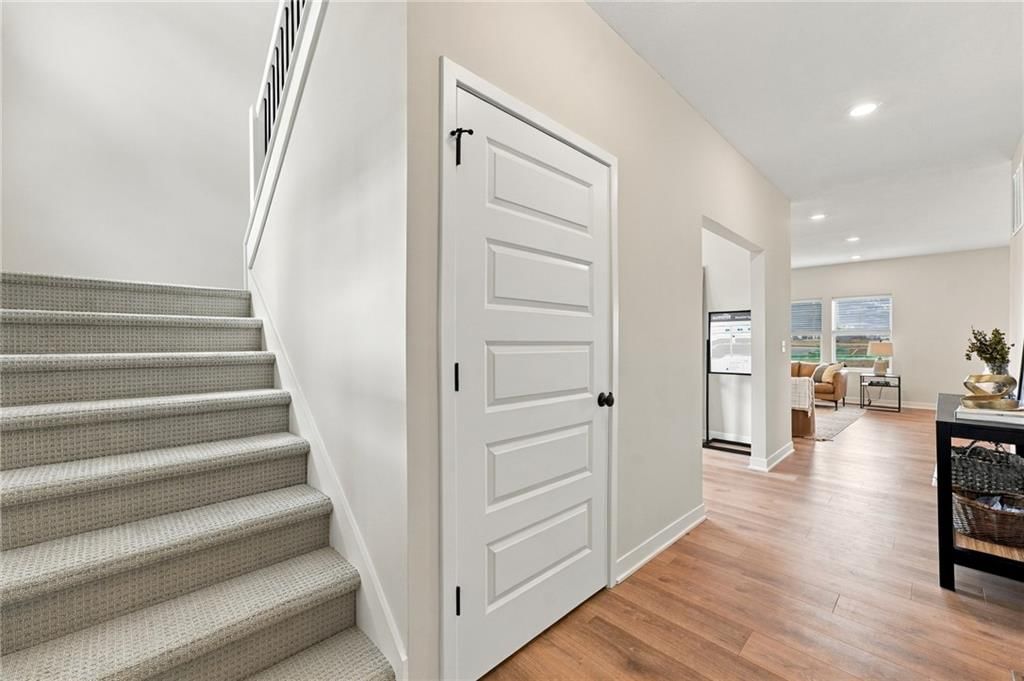
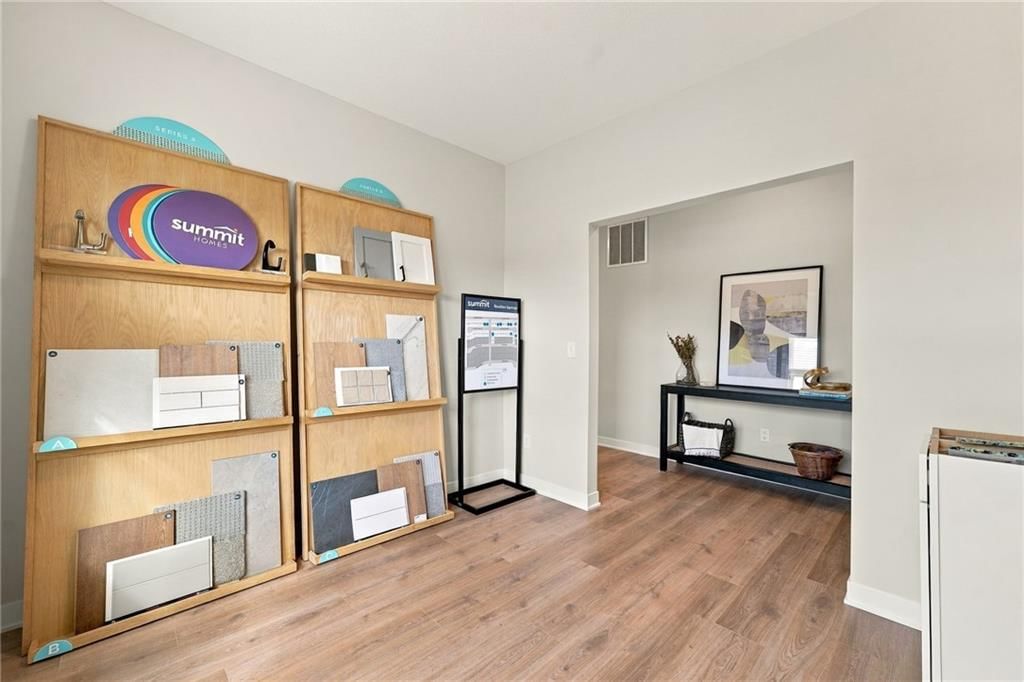
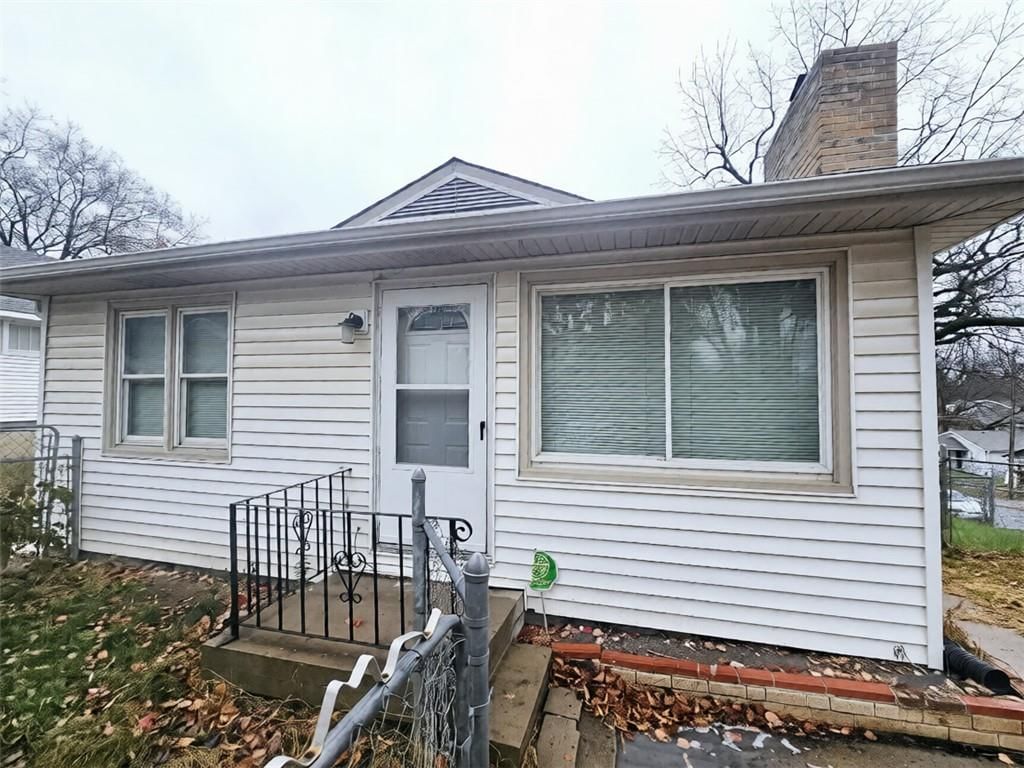
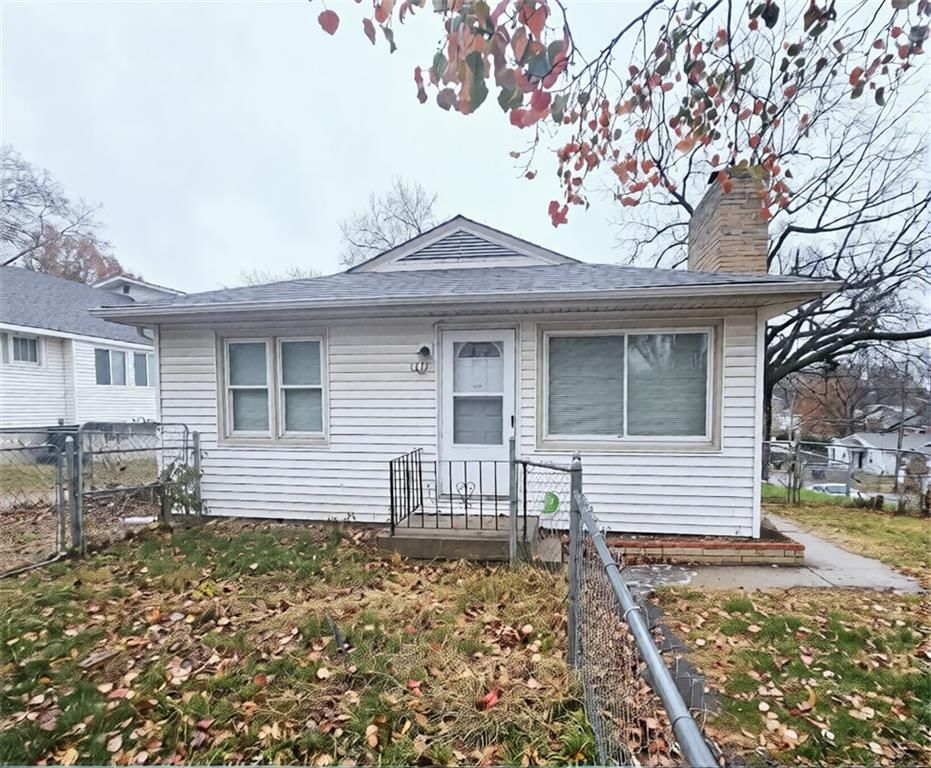
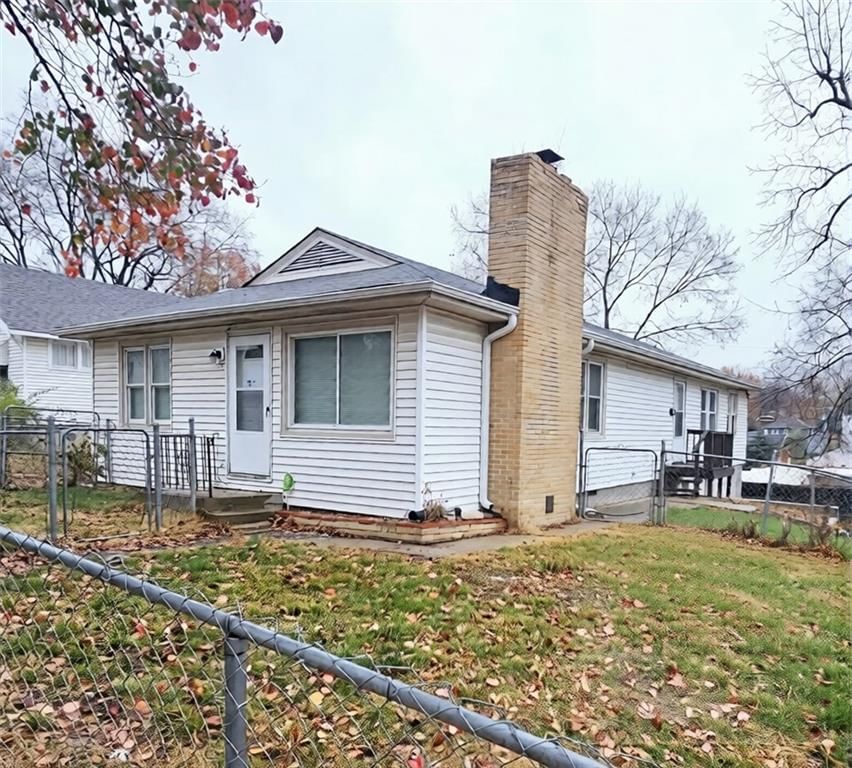
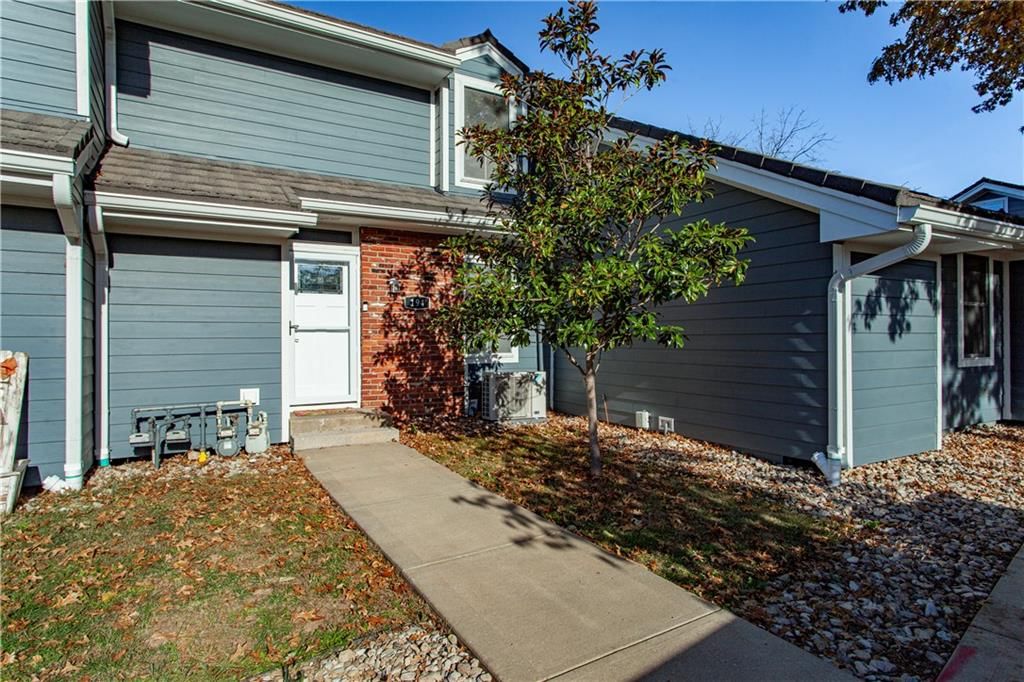
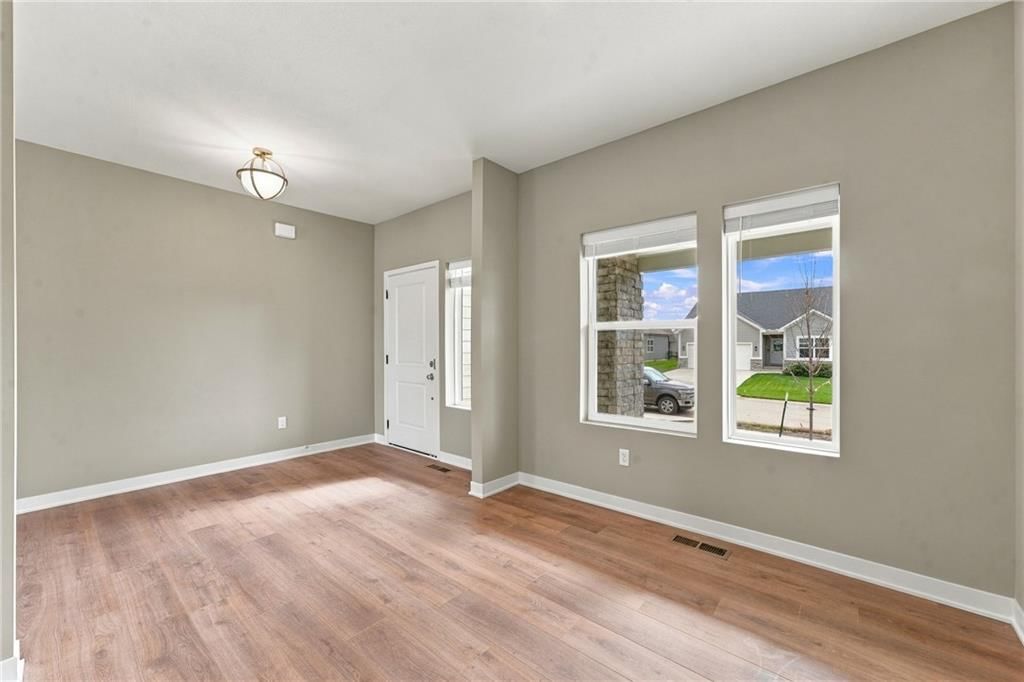
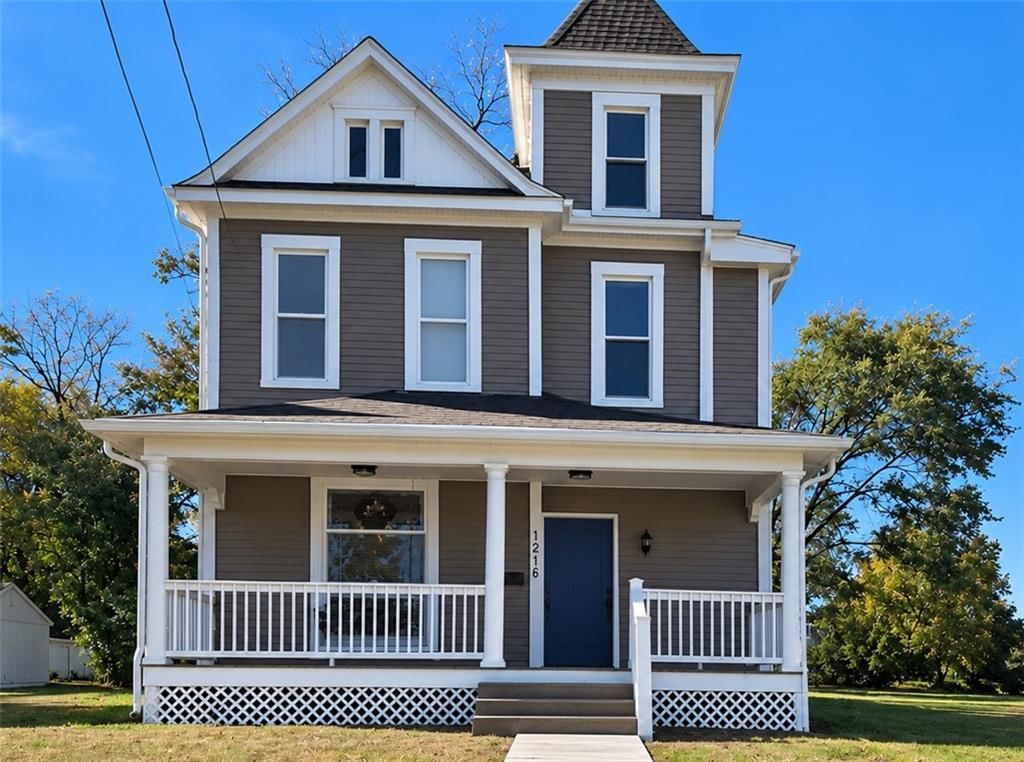
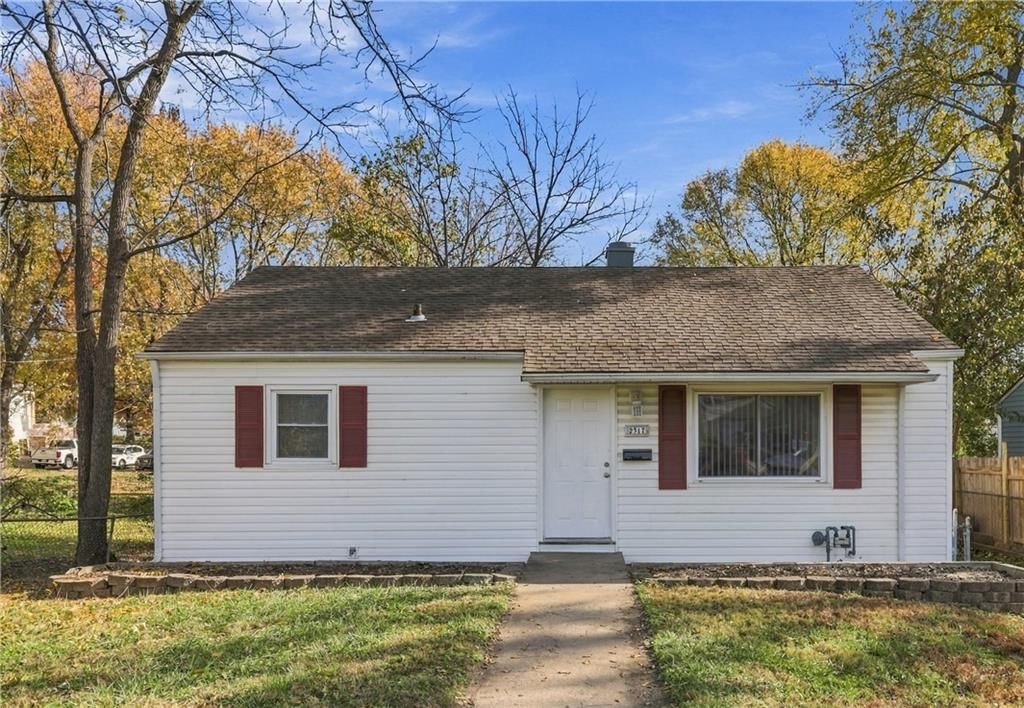
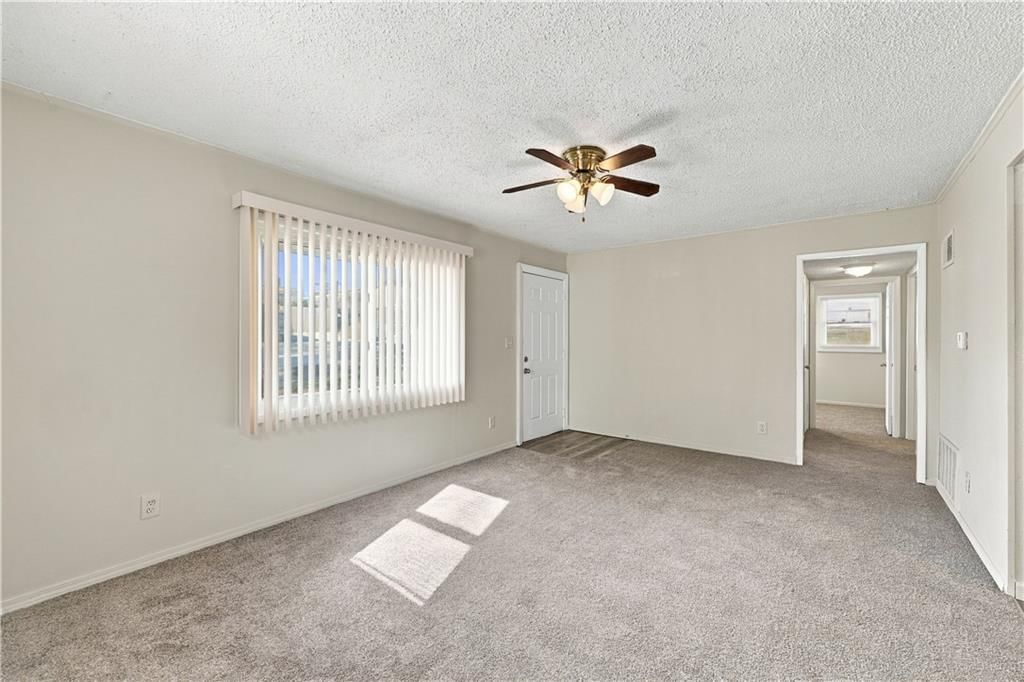
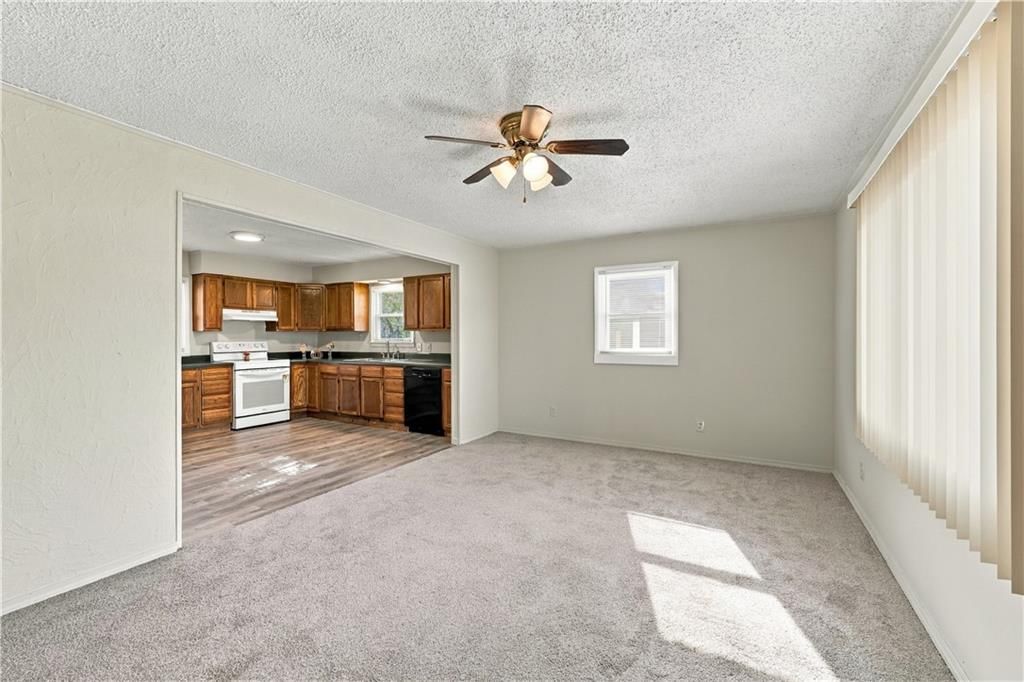
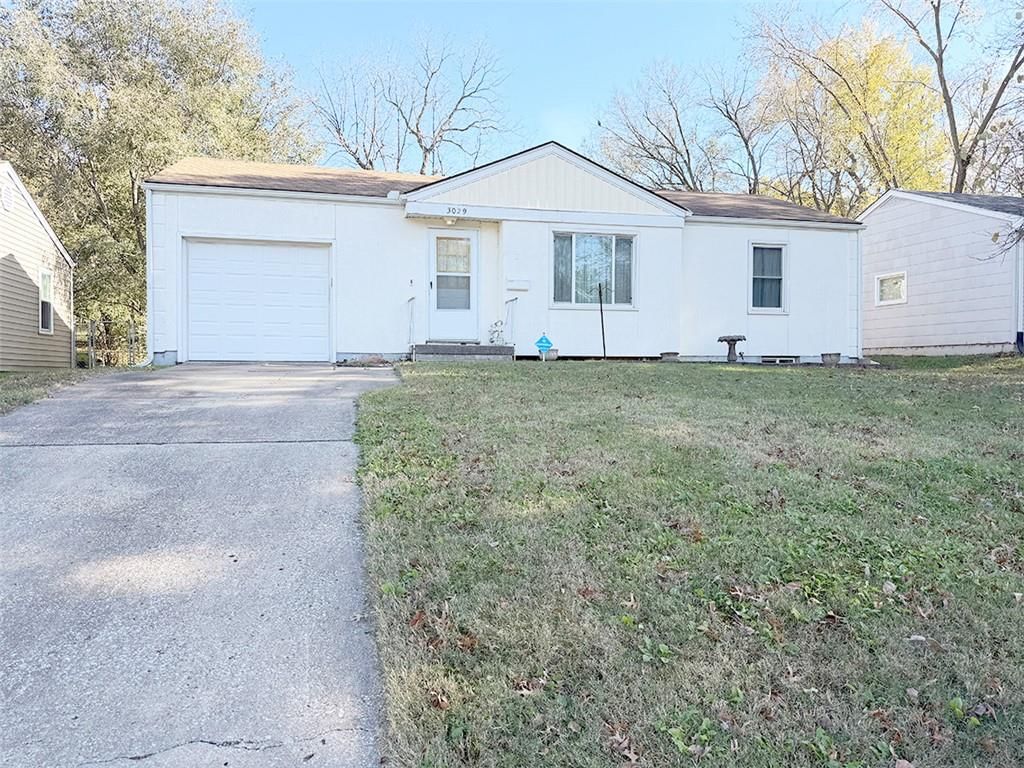
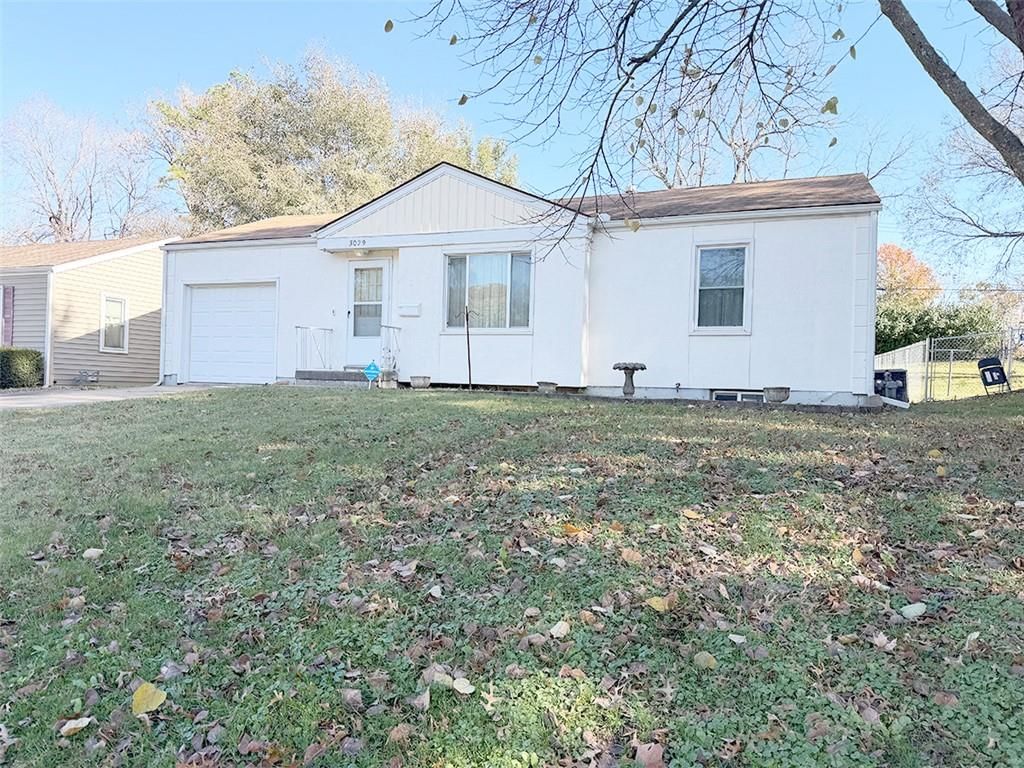
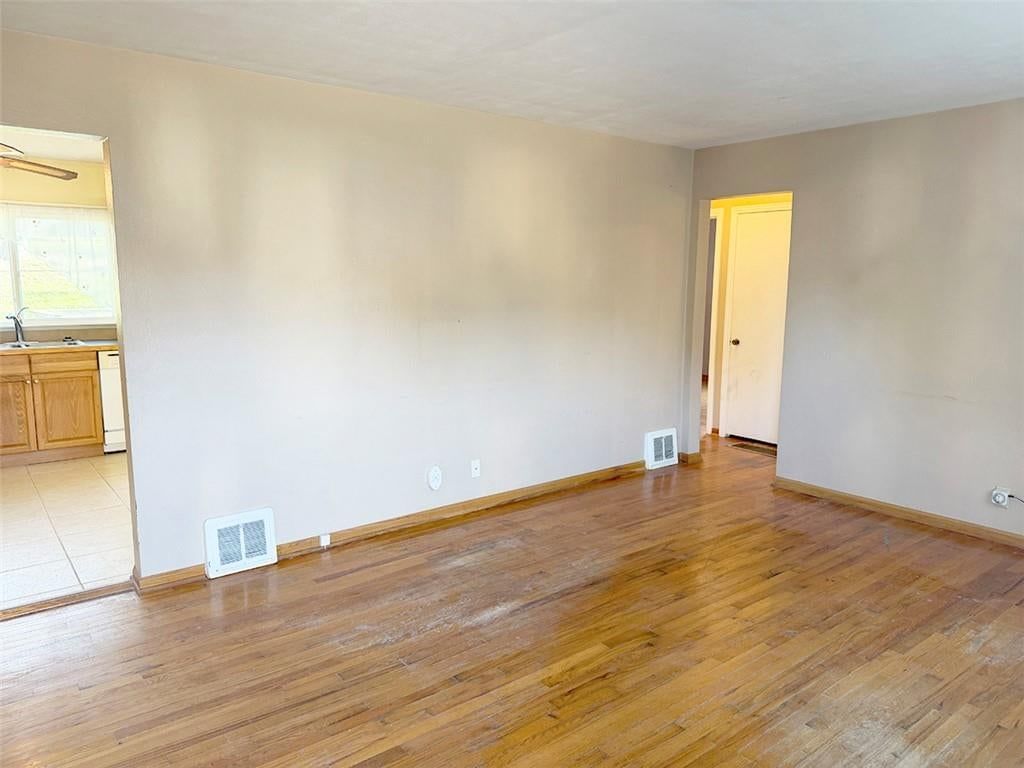
HouseLoop Vision in Jackson County, MO
As of Nov 16, 2026
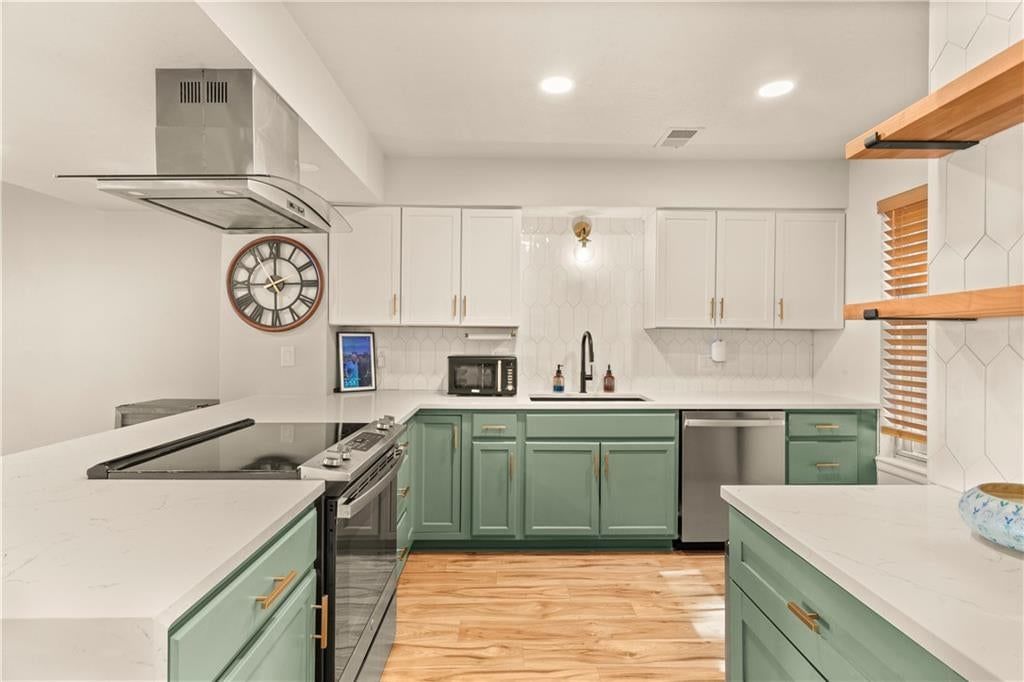
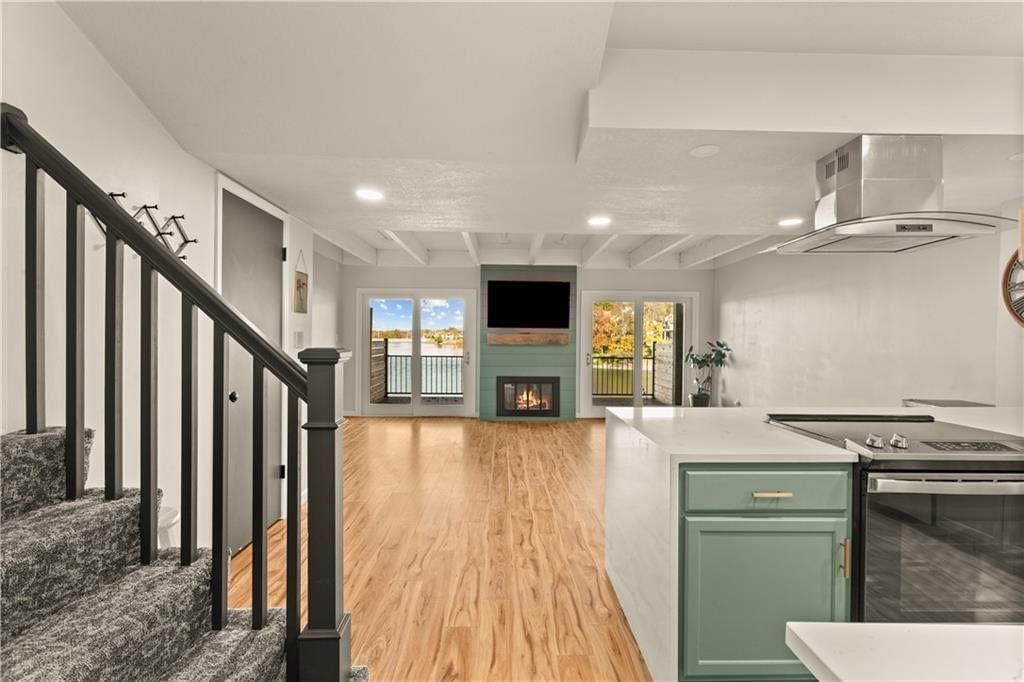
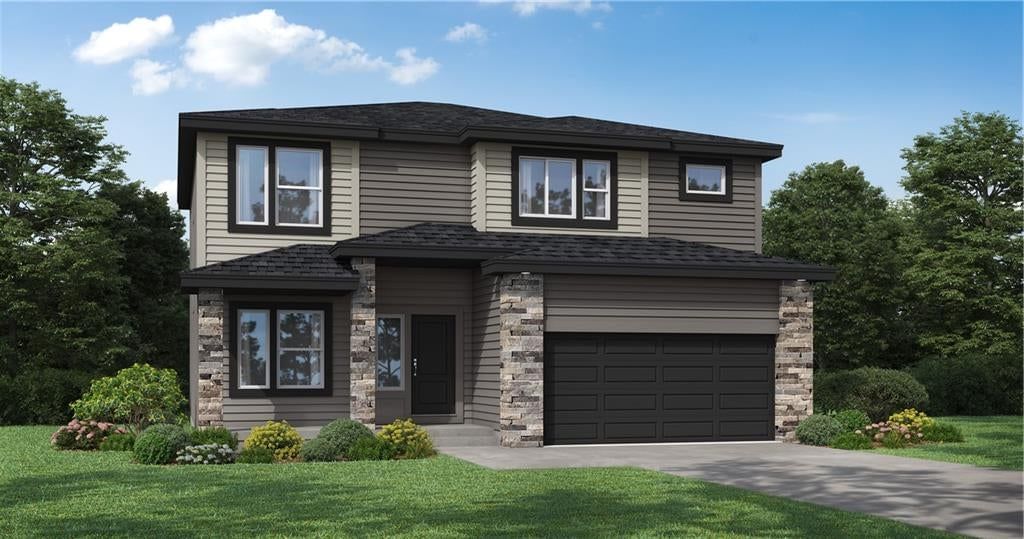
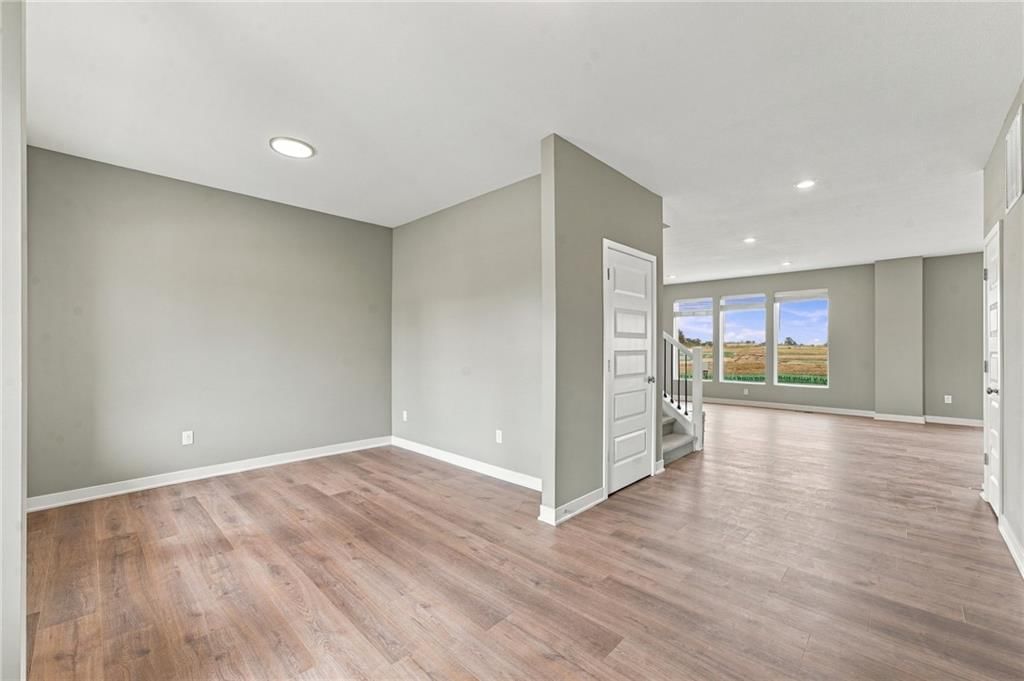
HouseLoop Vision identified 1,182 homes for sale in Jackson County, MO with white kitchen cabinets, 266 with a freestanding tub, 65 with a pool, 195 with a home gym, 1,601 with a big backyard and 881 with a finished basement, plus 4 more features.
HouseLoop Vision has looked at the photos of 2,848 of the 2,940 homes for sale in Jackson County, MO. 92 haven't been looked at yet.
| HouseLoop Vision feature | Homes for sale | Where HouseLoop Vision saw it |
|---|---|---|
| White kitchen cabinets | 1,182 | 6115 Larson Avenue (photo 5), 13007 BENNINGTON Avenue (photo 10), 512 NE Grant Drive (photo 2) |
| Freestanding tub | 266 | 4705 E 184th Street (photo 40), 3709 Walnut Street (photo 35), 820 SE Partridge Lane (photo 19) |
| Pool | 65 | 19304 E 18th Terrace S (photo 36), 1217 SW Coachlight Drive (photo 2), 12816 Byars Road (photo 2) |
| Home gym | 195 | 421 N Crysler Avenue (photo 10), 203 SW McClendon Drive (photo 19), 3821 Maryville Place (photo 53) |
| Big backyard | 1,601 | 2317 Englewood Court (photo 13), 9909 E 76th Terrace (photo 49), 7410 Hedges Avenue (photo 25) |
| Finished basement | 881 | 121 N Holder Road (photo 17), 5300 E 53rd Street (photo 15), 10829 Beacon Avenue (photo 11) |
| Kitchen island | 1,042 | 194 NE Bayview Drive (photo 2), 602 SW Edgewood Meadows Lane (photo 7), 18505 E Truman Road (photo 5) |
| Two-story living room | 230 | 1 K B Street (photo 5), 9032 SW 10TH Street (photo 6), 959 NW Dogwood Drive (photo 3) |
| Fenced yard | 1,329 | 500 NW LEANNE Lane (photo 1), 11505 E 36Th Street S (photo 1), 1717 S Arlington Avenue (photo 2) |
| 3-car garage | 191 | 1602 SW Stonewall Drive (photo 1), 2708 NW 3rd Terrace (photo 1), 2509 SW Rustic Circle (photo 1) |
Key HouseLoop Vision features
- White kitchen cabinets
- Freestanding tub
- Pool
- Home gym
- Big backyard
- Finished basement
- Kitchen island
- Two-story living room
- Fenced yard
- 3-car garage
Questions buyers ask about Jackson County, MO
- How many homes for sale in Jackson County, MO have white kitchen cabinets?
- HouseLoop Vision identified 1,182 homes for sale in Jackson County, MO with white kitchen cabinets. One is 6115 Larson Avenue (photo 5).
- How many homes for sale in Jackson County, MO have a freestanding tub?
- HouseLoop Vision identified 266 homes for sale in Jackson County, MO with a freestanding tub. One is 4705 E 184th Street (photo 40).
- How many homes for sale in Jackson County, MO have a pool?
- HouseLoop Vision identified 65 homes for sale in Jackson County, MO with a pool. One is 19304 E 18th Terrace S (photo 36).
- How many homes for sale in Jackson County, MO have a home gym?
- HouseLoop Vision identified 195 homes for sale in Jackson County, MO with a home gym. One is 421 N Crysler Avenue (photo 10).
- How many homes for sale in Jackson County, MO have a big backyard?
- HouseLoop Vision identified 1,601 homes for sale in Jackson County, MO with a big backyard. One is 2317 Englewood Court (photo 13).
Communities in Jackson County, Missouri
Kansas City
- Living in Waldo
South Oak Park has a paved trail and benches for a walk, 3 minutes by car.
Schools serving Jackson County
| School | Median list | For sale |
|---|---|---|
| School districts | ||
| Kansas City MO School District | Median$205,000 | 1,004 |
| Lee's Summit School District | Median$479,950 | 424 |
| Independence School District | Median$210,000 | 379 |
| Blue Springs School District | Median$389,500 | 270 |
| Raytown School District | Median$210,000 | 237 |
| Hickman Mills School District | Median$199,900 | 151 |
| Grain Valley School District | Median$363,640 | 101 |
| Grandview School District | Median$289,500 | 100 |
| Center School District | Median$229,000 | 81 |
| Fort Osage School District | Median$249,950 | 58 |
| Oak Grove School District | Median$310,000 | 47 |
| Lone Jack School District | Median$179,900 | 46 |
How we compute these
- Median list.
- The middle asking price among the homes for sale right now. Half are listed above it, half below.
- For sale.
- Homes listed as active right now. A live count, not a monthly average.
Popular home searches in Jackson County
| Search | For sale |
|---|---|
| Open houses | For sale58 |
| Luxury homes | For sale104 |
| Just listed homes | For sale197 |
| Price-reduced homes | For sale1,342 |
| Coming soon homes | For sale108 |
| Homes under contract | For sale1,044 |
How we compute these
- For sale.
- Homes listed as active right now. A live count, not a monthly average.
Homes by price in Jackson County
| Price range | For sale |
|---|---|
| Under $200,000 | For sale1,026 |
| Under $300,000 | For sale1,652 |
| Under $400,000 | For sale2,171 |
| Under $500,000 | For sale2,427 |
How we compute these
- For sale.
- Homes listed as active right now. A live count, not a monthly average.
Homes by feature in Jackson County
| Feature | For sale |
|---|---|
| Homes with no HOA | For sale2,010 |
| Homes on under a quarter acre | For sale1,830 |
| Two or more stories | For sale1,765 |
| Homes with 2+ full bathrooms | For sale1,681 |
How we compute these
- For sale.
- Homes listed as active right now. A live count, not a monthly average.
Search by property type in Jackson County
| Property type | Market (Market type is set by months of supply — how long it would take to sell every home for sale at the current pace. Under ~4 months favors sellers (low inventory, faster sales, homes near or above asking); over ~6 favors buyers (more choice, more negotiating room). 4–6 is balanced.) | Months supply | For sale | Median sale | Sell-to-list | Days to contract | Coming soon | Under contract |
|---|---|---|---|---|---|---|---|---|
| Single Family | Seller's | 3 mo | 1,961 | Median$292,500 | 99% | 20d | 99 | 893 |
| Townhouse | Seller's | 3.2 mo | 73 | Median$228,000 | 99% | 25d | 0 | 24 |
| Villa | — | — | — | Median— | — | — | — | — |
| Condo / Loft | Strong Buyer's | 8.5 mo | 233 | Median$205,000 | 98% | 48d | 5 | 41 |
| Half Duplex | — | — | — | Median— | — | — | — | — |
| Duplex | — | — | — | Median— | — | — | — | — |
| Triplex | — | — | — | Median— | — | — | — | — |
| Quadruplex | — | — | — | Median— | — | — | — | — |
| Lots / Land | Strong Buyer's | 19 mo | 347 | Median$100,000 | 87% | 127d | 0 | 27 |
How we compute these
- Market.
- Market type is set by months of supply — how long it would take to sell every home for sale at the current pace. Under ~4 months favors sellers (low inventory, faster sales, homes near or above asking); over ~6 favors buyers (more choice, more negotiating room). 4–6 is balanced.
- Months supply.
- How many months it would take to sell every home now for sale at the pace of the last 90 days: homes for sale ÷ (closings in the last 90 days ÷ 3).
- For sale.
- Homes listed as active right now. A live count, not a monthly average.
- Days to contract.
- The middle number of days between a home being listed and going under contract, over the last 90 days of closings. It is not days-to-close, and it is not how long today's listings have been sitting. Newly built homes are excluded, because a build finishing is not a market moving.
- Coming soon.
- Homes announced but not yet accepting showings. A live count.
- Under contract.
- Homes with an accepted contract that have not closed yet. A live count.
Search homes in Jackson County
| City | Market (Market type is set by months of supply — how long it would take to sell every home for sale at the current pace. Under ~4 months favors sellers (low inventory, faster sales, homes near or above asking); over ~6 favors buyers (more choice, more negotiating room). 4–6 is balanced.) | Months supply | Median list | Sell-to-list | Days to contract | For sale | Coming soon | Under contract |
|---|---|---|---|---|---|---|---|---|
| Kansas City | Seller's | 3.8 mo | Median$257,000 | 98% | 21d | 2,166 | 85 | 774 |
| Independence | Seller's | 3.4 mo | Median$219,900 | 99% | 20d | 452 | 14 | 156 |
| Lee's Summit | Seller's | 2.9 mo | Median$500,000 | 98% | 19d | 426 | 17 | 227 |
| Blue Springs | Seller's | 2.7 mo | Median$385,000 | 99% | 18d | 210 | 9 | 113 |
| Raytown | Seller's | 3.6 mo | Median$214,900 | 98% | 23d | 137 | 9 | 34 |
| Grandview | Seller's | 2.6 mo | Median$265,000 | 99% | 18d | 72 | 4 | 27 |
| Grain Valley | Seller's | 3 mo | Median$349,000 | 100% | 20d | 68 | 3 | 16 |
| Oak Grove | Balanced | 4.3 mo | Median$339,900 | 99% | 26d | 71 | 1 | 47 |
| Greenwood | Seller's | 2.6 mo | Median$694,850 | 99% | 16d | 28 | 1 | 12 |
| Lone Jack | Strong Buyer's | 9.1 mo | Median$299,900 | 94% | 38d | 49 | 1 | 9 |
| Lake Lotawana | Strong Buyer's | 8.3 mo | Median$485,000 | 94% | 40d | 44 | 2 | 11 |
| Buckner | Seller's | 2.7 mo | Median$307,498 | 94% | 30d | 12 | 0 | 7 |
| Sugar Creek | Balanced | 4.7 mo | Median$155,000 | 99% | 30d | 15 | 0 | 4 |
| Lake Tapawingo | Strong Seller's | 1.8 mo | Median$145,000 | 90% | 48d | 3 | 0 | 2 |
| Sibley | Seller's | 2.3 mo | Median$370,000 | 96% | 67d | 3 | 0 | 0 |
| Pleasant Hill | Balanced | 4.6 mo | Median$254,900 | 97% | 26d | 85 | 3 | 17 |
| Levasy | — | — | Median— | — | — | 0 | 0 | 0 |
| Raymore | Balanced | 4.5 mo | Median$379,950 | 96% | 26d | 189 | 9 | 100 |
| Napoleon | Strong Buyer's | 12 mo | Median— | 87% | — | 4 | 0 | 1 |
How we compute these
- Market.
- Market type is set by months of supply — how long it would take to sell every home for sale at the current pace. Under ~4 months favors sellers (low inventory, faster sales, homes near or above asking); over ~6 favors buyers (more choice, more negotiating room). 4–6 is balanced.
- Months supply.
- How many months it would take to sell every home now for sale at the pace of the last 90 days: homes for sale ÷ (closings in the last 90 days ÷ 3).
- Median list.
- The middle asking price among the homes for sale right now. Half are listed above it, half below.
- Days to contract.
- The middle number of days between a home being listed and going under contract, over the last 90 days of closings. It is not days-to-close, and it is not how long today's listings have been sitting. Newly built homes are excluded, because a build finishing is not a market moving.
- For sale.
- Homes listed as active right now. A live count, not a monthly average.
- Coming soon.
- Homes announced but not yet accepting showings. A live count.
- Under contract.
- Homes with an accepted contract that have not closed yet. A live count.
ZIP codes in Jackson County
| Place | Market (Market type is set by months of supply — how long it would take to sell every home for sale at the current pace. Under ~4 months favors sellers (low inventory, faster sales, homes near or above asking); over ~6 favors buyers (more choice, more negotiating room). 4–6 is balanced.) | Months supply | Median list | Sell-to-list | Days to contract | For sale | Coming soon | Under contract |
|---|---|---|---|---|---|---|---|---|
| 64133 | Seller's | 3.6 mo | Median$210,000 | 98% | 23d | 150 | 7 | 45 |
| 64114 | Seller's | 2.8 mo | Median$288,450 | 100% | 14d | 111 | 9 | 42 |
| 64055 | Seller's | 3.1 mo | Median$232,450 | 98% | 21d | 124 | 2 | 50 |
| 64015 | Seller's | 2.3 mo | Median$362,500 | 99% | 18d | 82 | 4 | 40 |
How we compute these
- Market.
- Market type is set by months of supply — how long it would take to sell every home for sale at the current pace. Under ~4 months favors sellers (low inventory, faster sales, homes near or above asking); over ~6 favors buyers (more choice, more negotiating room). 4–6 is balanced.
- Months supply.
- How many months it would take to sell every home now for sale at the pace of the last 90 days: homes for sale ÷ (closings in the last 90 days ÷ 3).
- Median list.
- The middle asking price among the homes for sale right now. Half are listed above it, half below.
- Days to contract.
- The middle number of days between a home being listed and going under contract, over the last 90 days of closings. It is not days-to-close, and it is not how long today's listings have been sitting. Newly built homes are excluded, because a build finishing is not a market moving.
- For sale.
- Homes listed as active right now. A live count, not a monthly average.
- Coming soon.
- Homes announced but not yet accepting showings. A live count.
- Under contract.
- Homes with an accepted contract that have not closed yet. A live count.