
64016 (Buckner, MO) Real Estate & Homes For Sale
· 14 homes for sale in 6401614 homes for sale in 64016 · Sorted by Newest Listed
Start with the numbers that matter to you
Real estate in 64016 in Buckner, Missouri
Buckner 64016 has about 1,734 households and a median household income of $98,323. Roughly 83% of homes are owner-occupied, the median owner's home value is $214,800, 25% of adults hold a bachelor's degree or higher. The average commute runs 27.9 minutes. About 4,603 people live in Buckner 64016, per the U.S. Census Bureau's American Community Survey 5-year estimate (2020–2024).
Buckner 64016 has 14 homes for sale right now, 1 of them coming soon, with a median list price of $270,000. These homes were built between 1875 and 2026. They range from 1,092 to 4,699 square feet.
Housing market trends in 64016 in Buckner, Missouri
As of Oct 17, 2026, Buckner 64016: 14 homes for sale · 2 new in the last 7 days · median asking $270,000 · 9 price reductions · a median of 26 days to contract. 6 homes closed in the last 30 days, at a median of $232,500. At the pace of the last 90 days that is 2.05 months of supply.
| Measure | Jul–Sep 2026 | Apr–Jun 2026 | Jul–Sep 2025 | Change |
|---|---|---|---|---|
| Median sale price | $232,500 | $244,450 | $250,000 | −7% |
| Median price per sq ft | $147 | $172 | $182 | −19.2% |
| Median days to contract | 26 | 17 | 62 | −36 days |
| Sell-to-list ratio | 100% | 100% | 100% | 0 pts |
| Homes sold, three months | 18 | 14 | 11 | +63.6% |
| New listings | 15 | 25 | 23 | −34.8% |
| Went under contract | 16 | 15 | 14 | +14.3% |
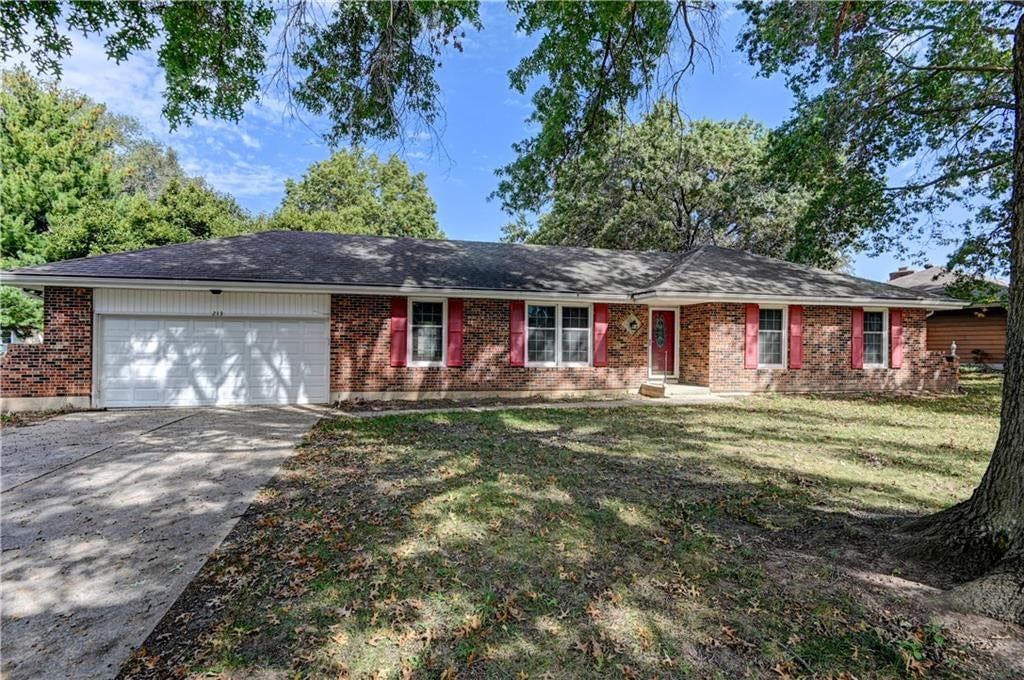
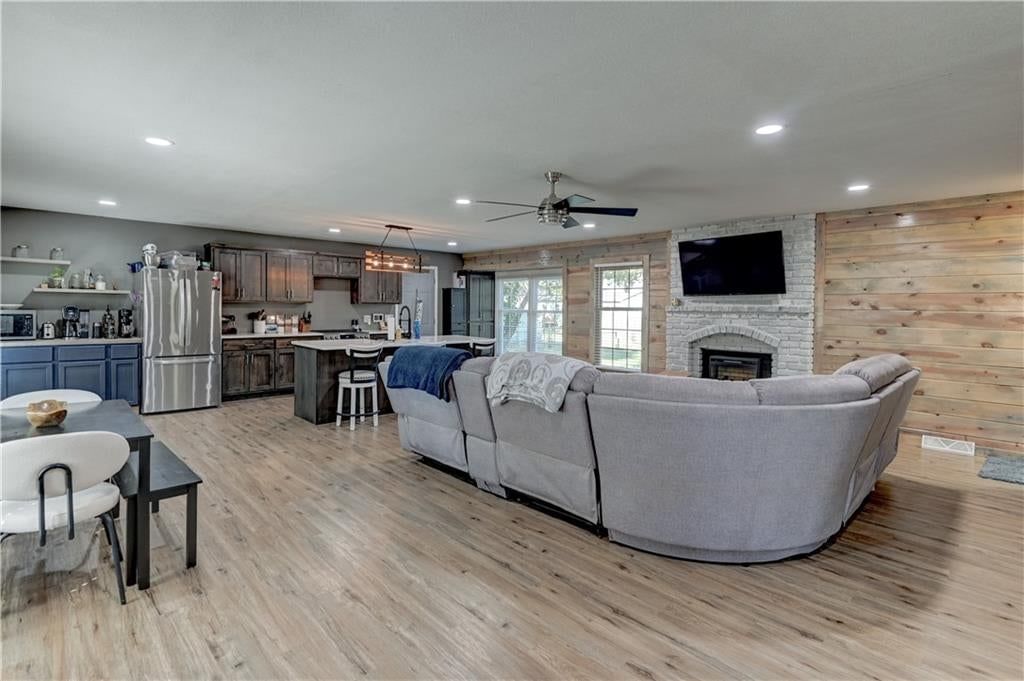
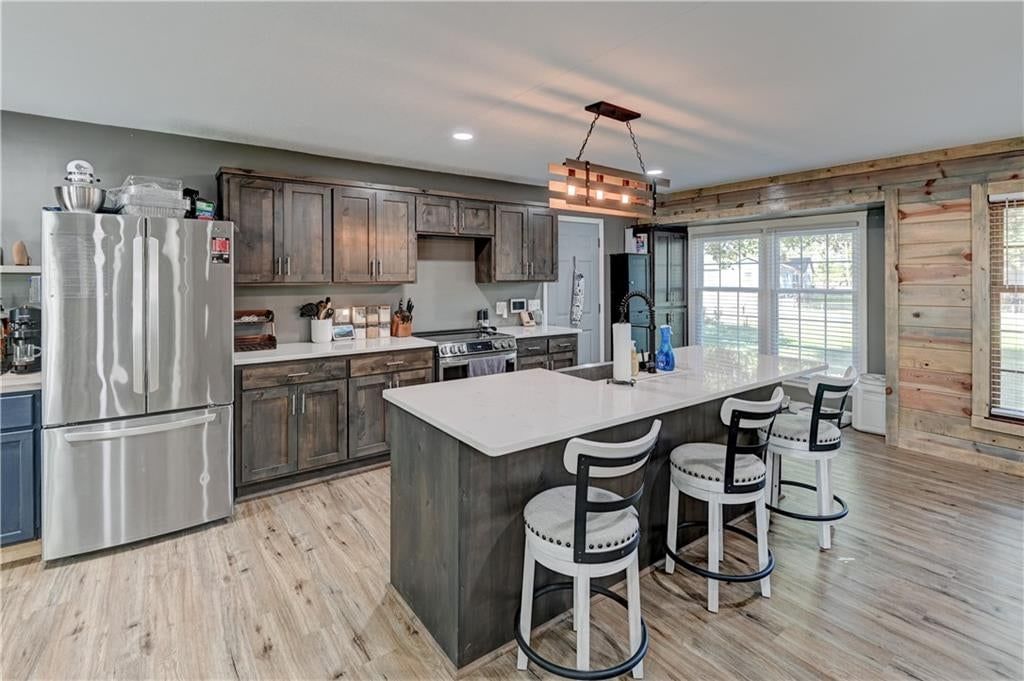
213 Johnson St, Buckner, MO
New · 23h ago
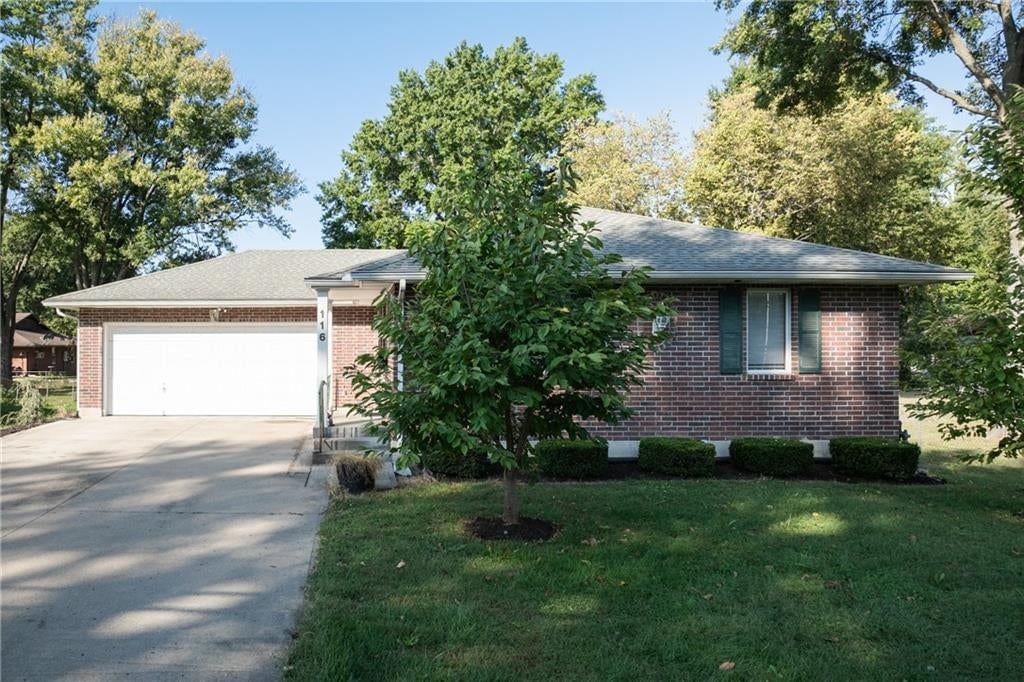
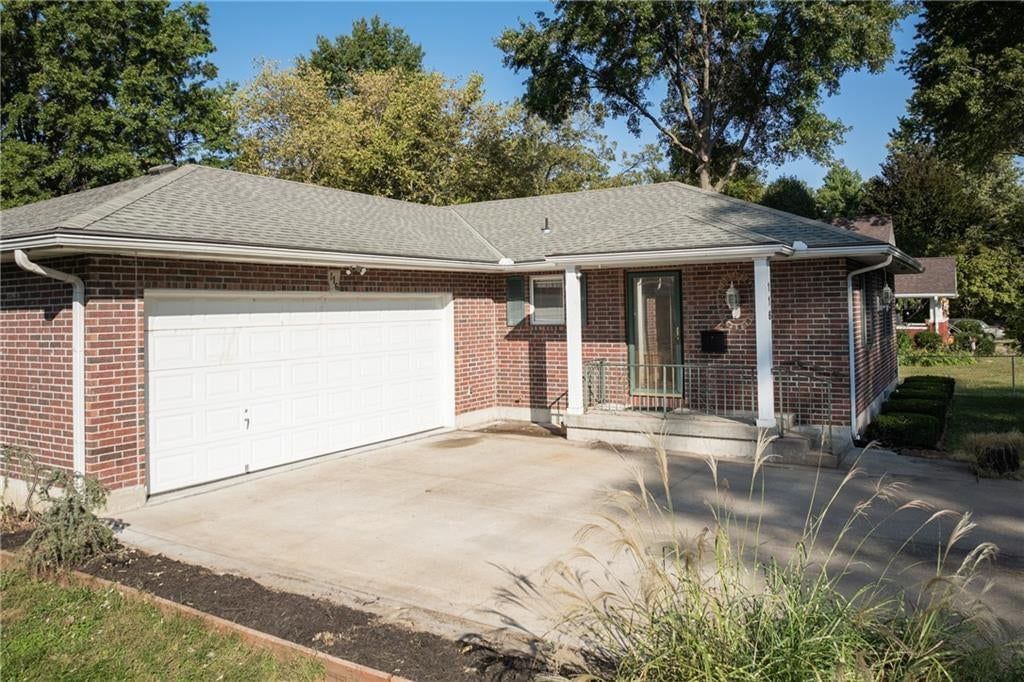
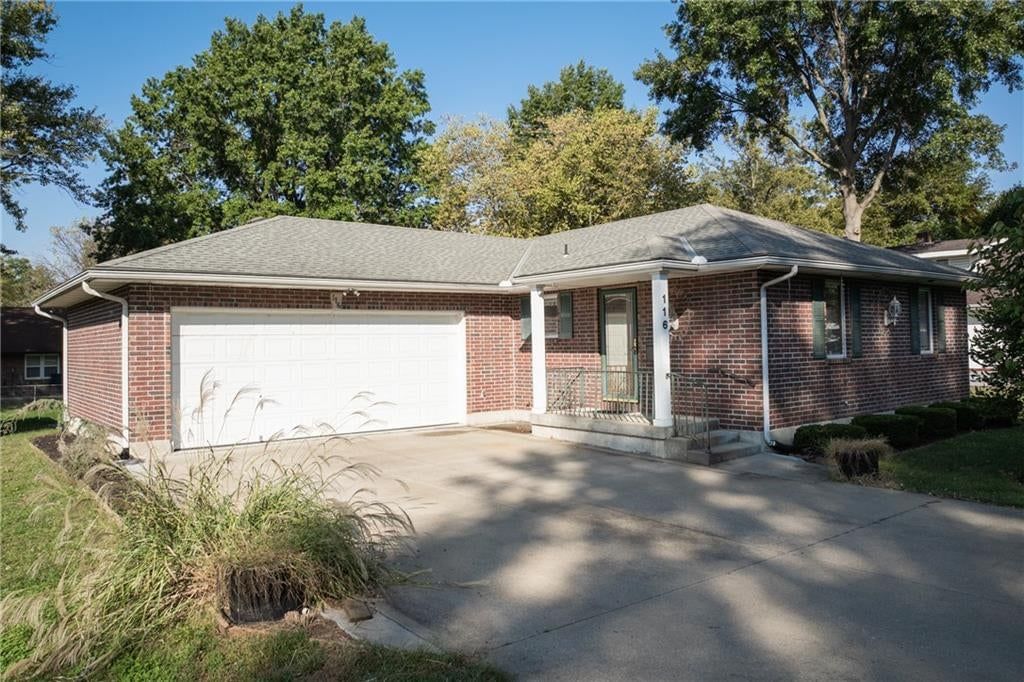
116 Sibley St, Buckner, MO
New · 2d ago
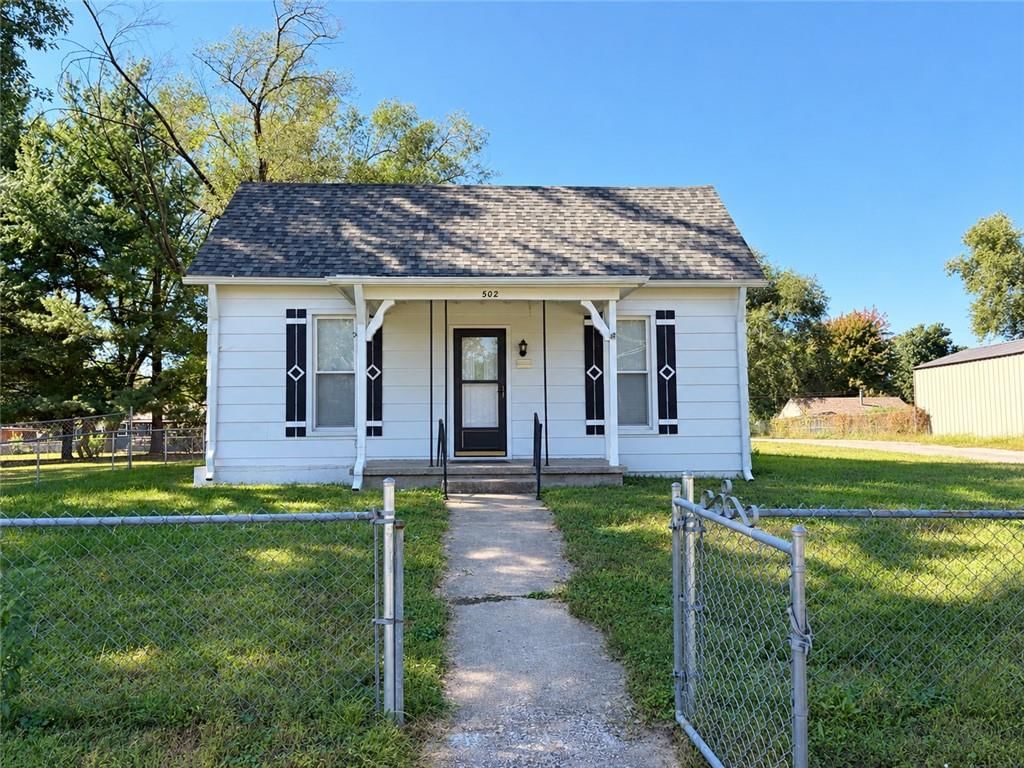
502 Zoe St, Buckner, MO
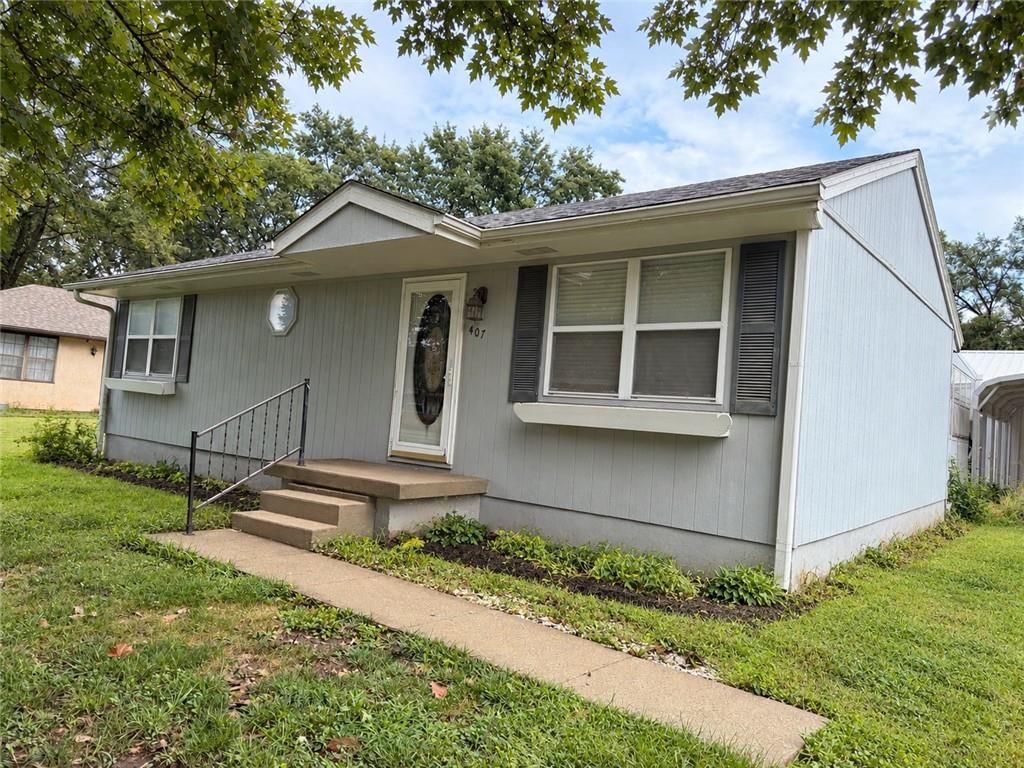
407 Vernon St, Buckner, MO
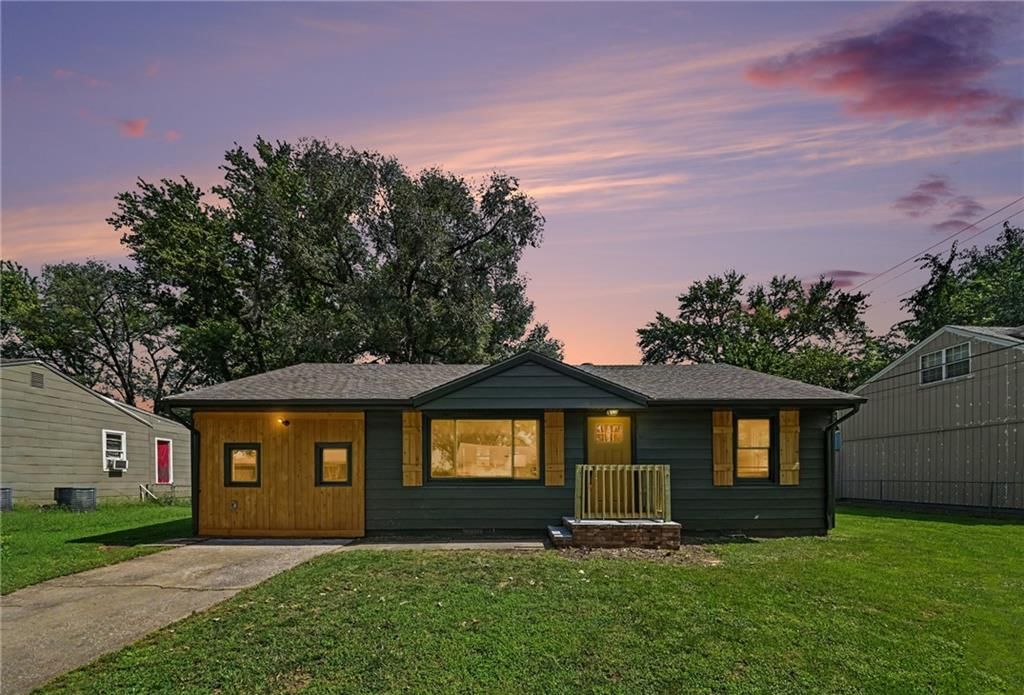
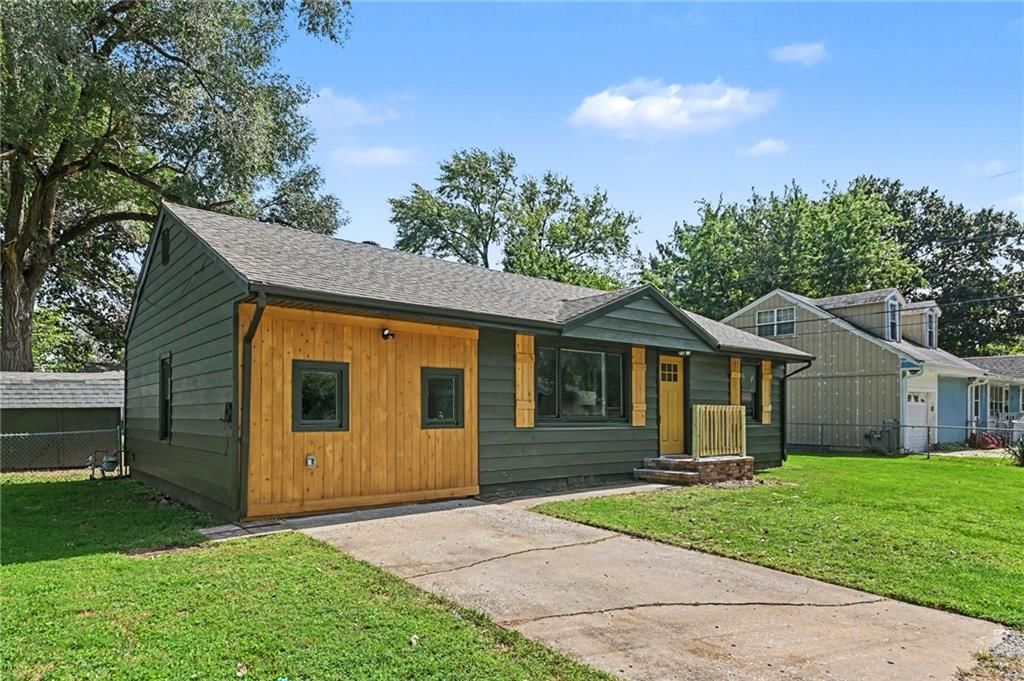
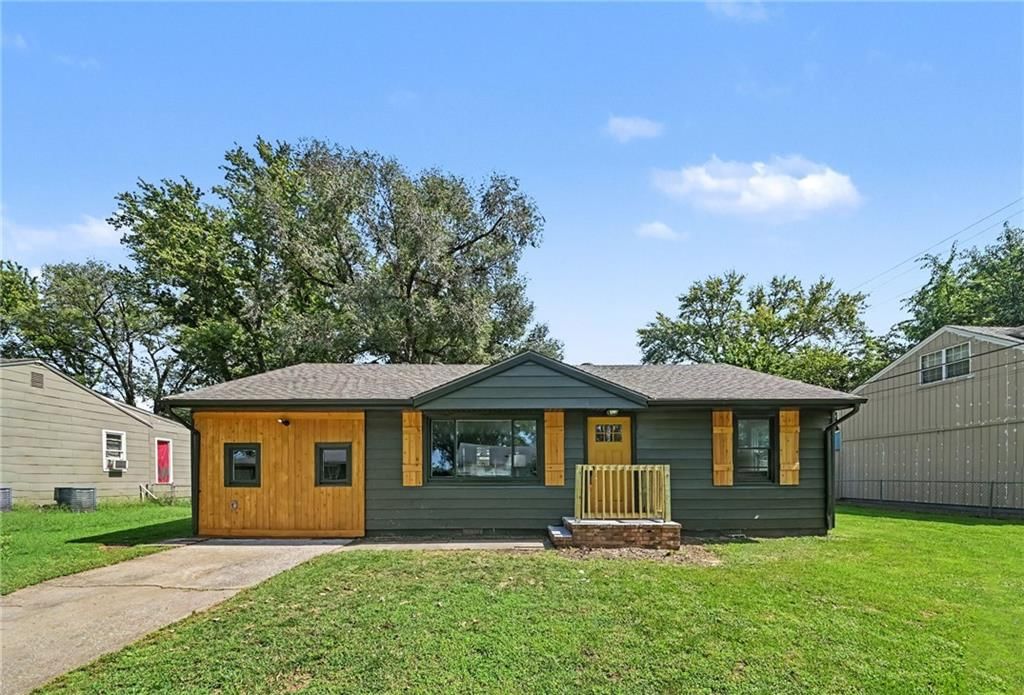
311 N Hudson St, Buckner, MO
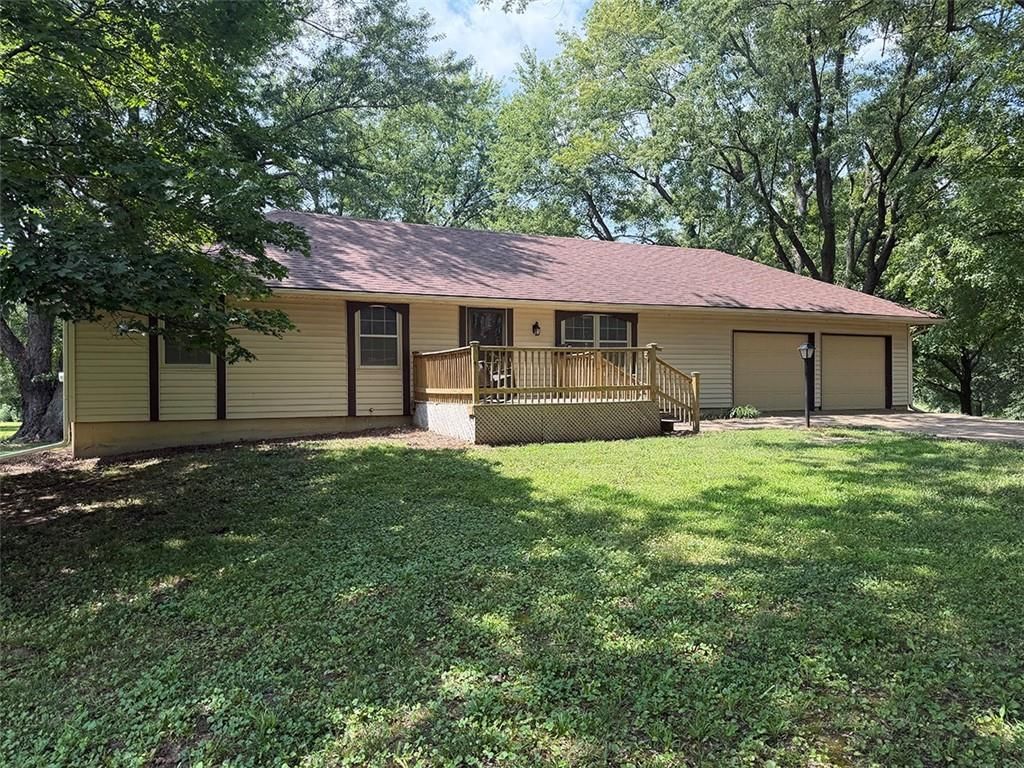
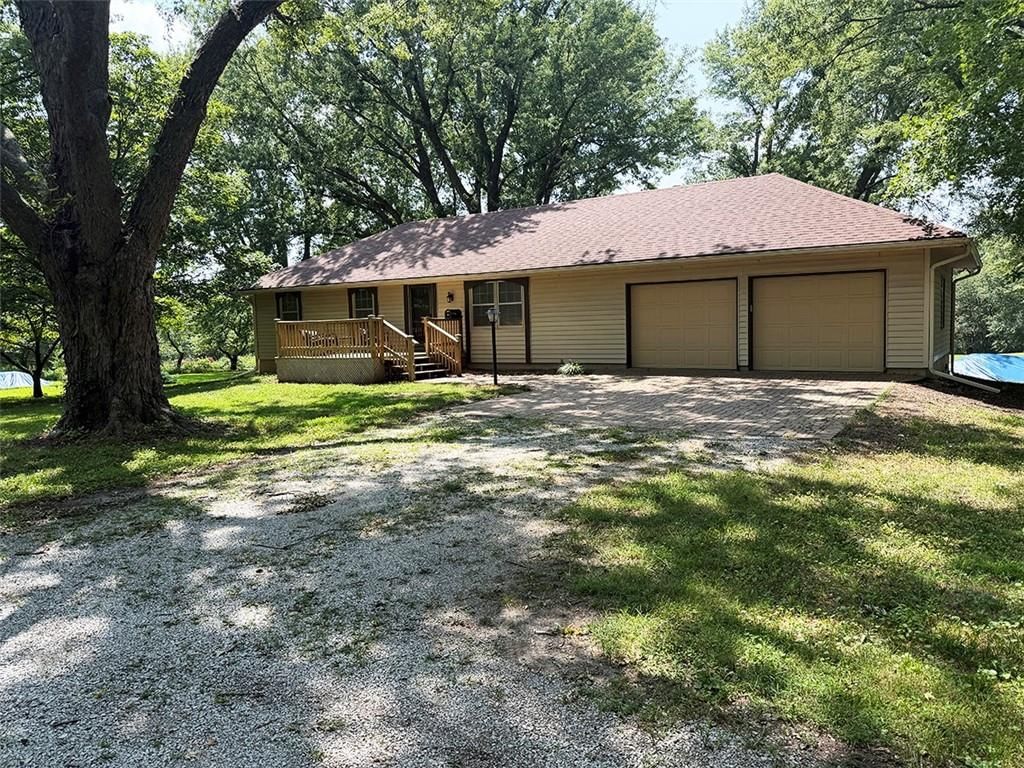
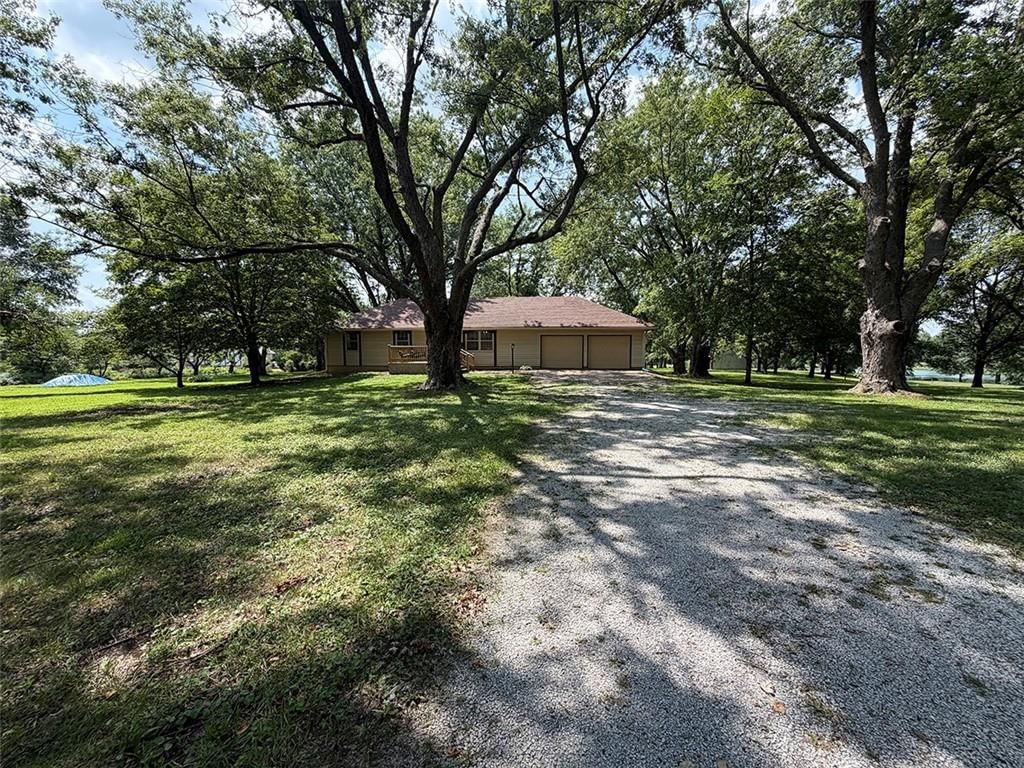
2414 N Hoover Rd, Buckner, MO
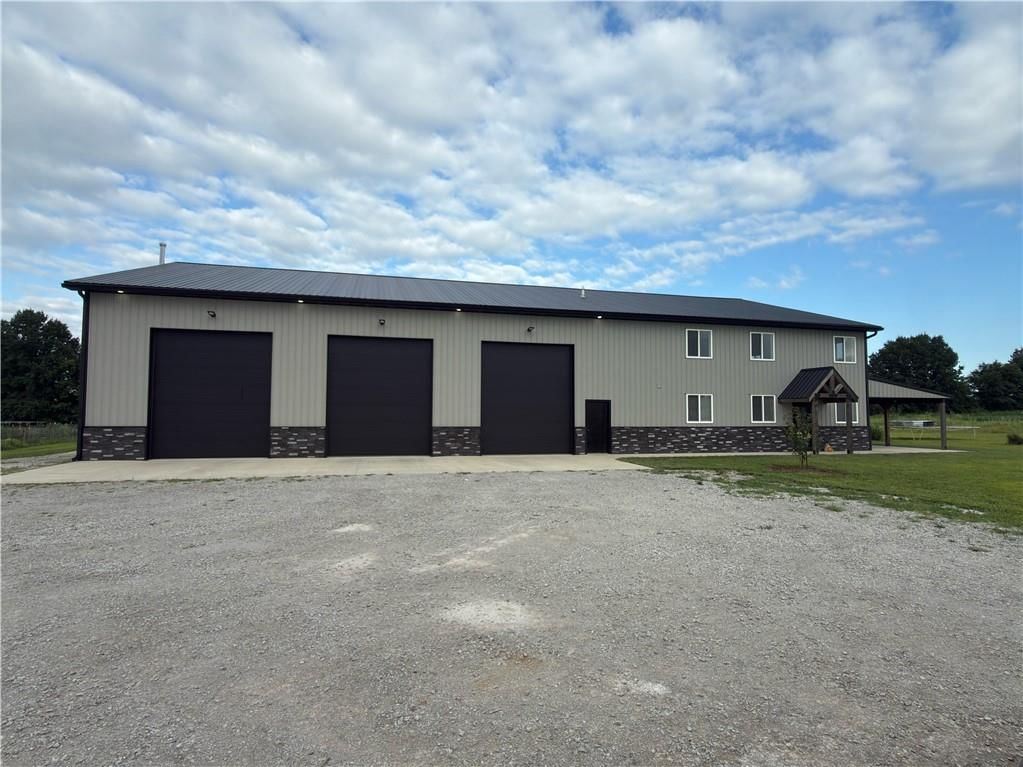
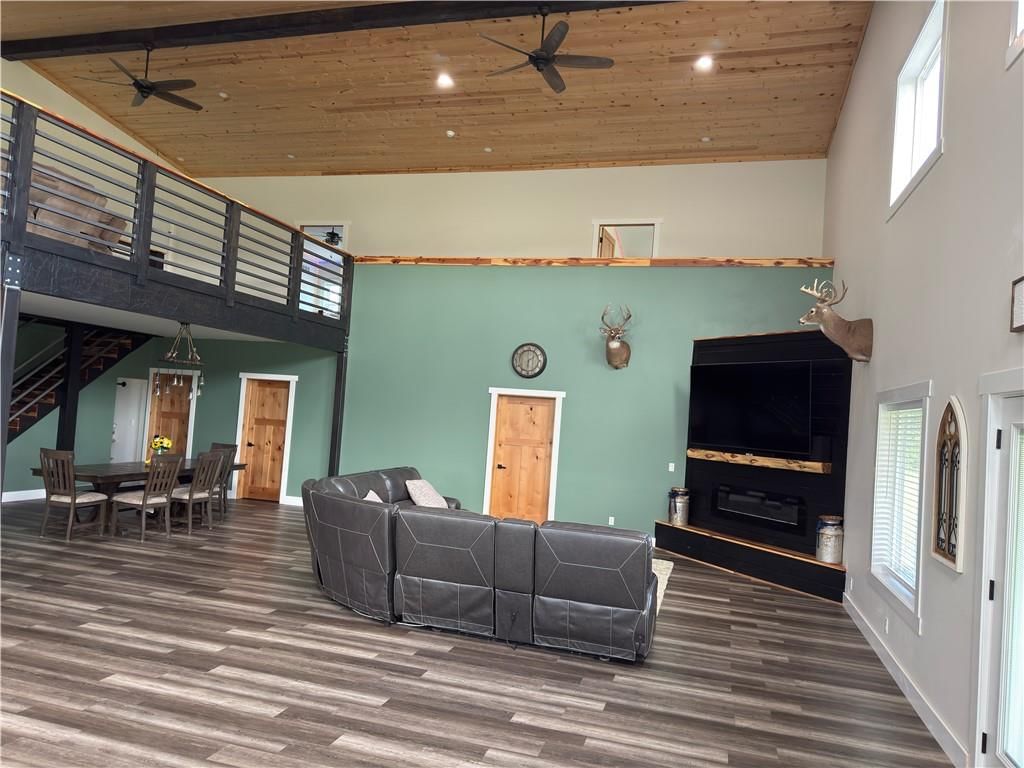
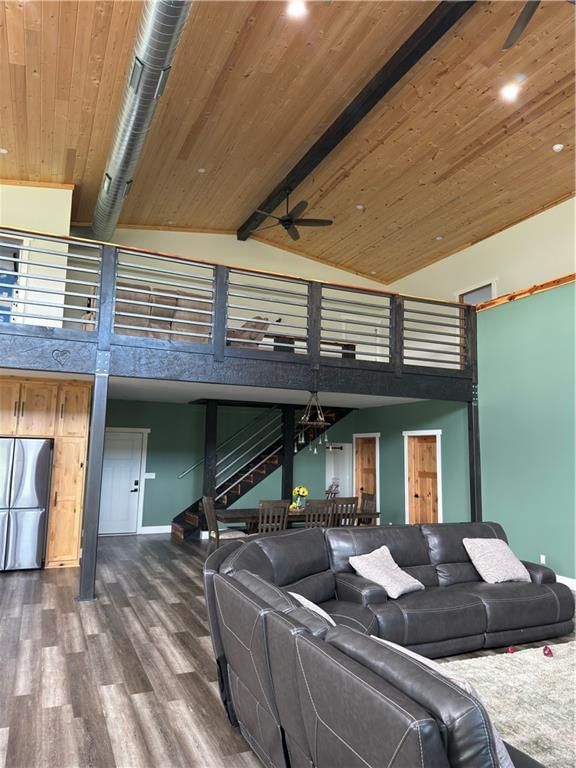
34705 E Mabry Rd, Buckner, MO
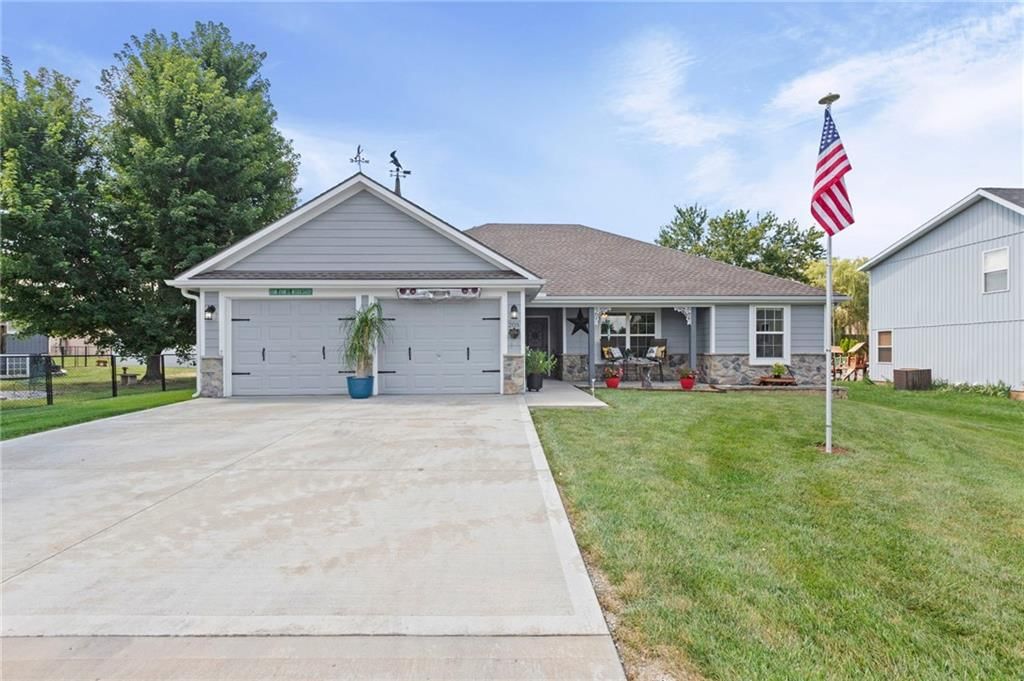
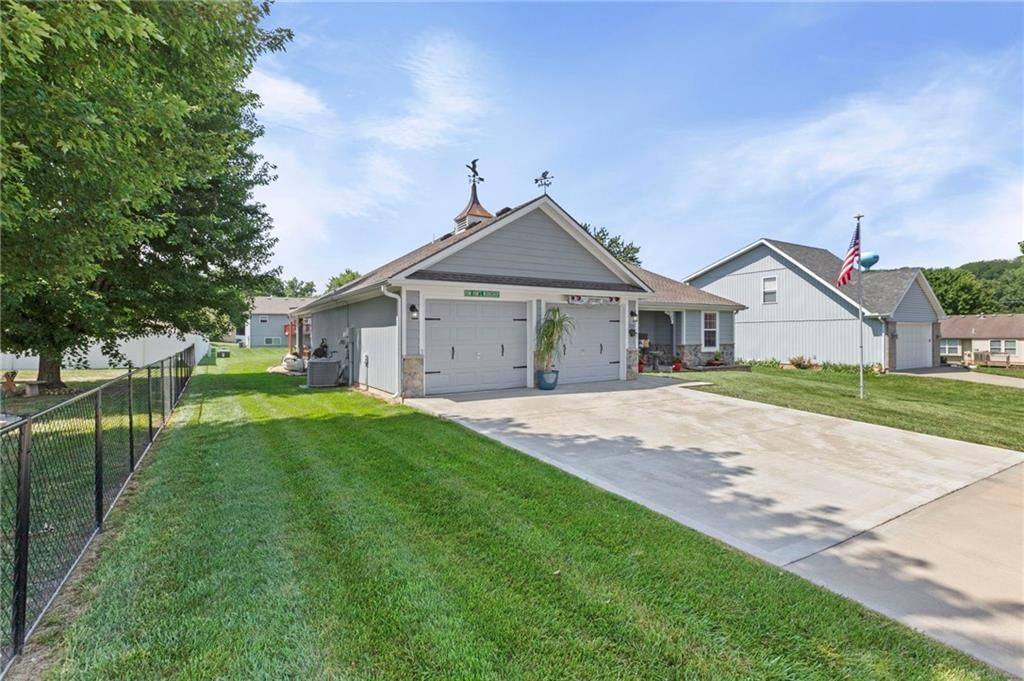
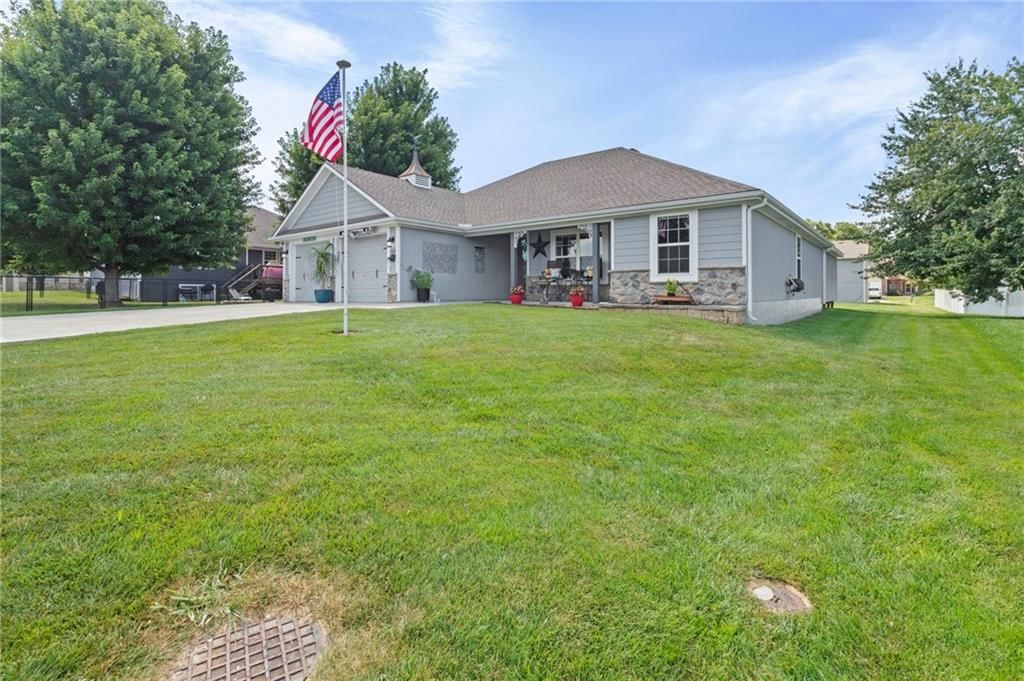
205 Ceremonial Dr, Buckner, MO
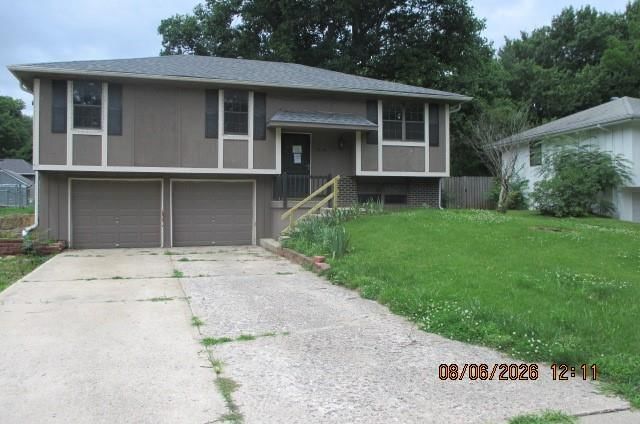
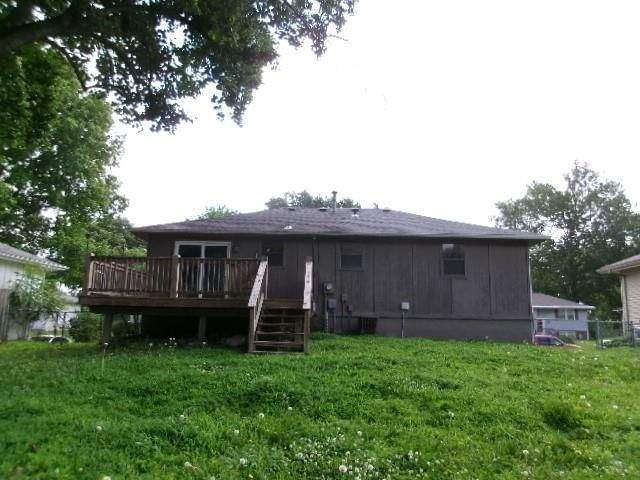
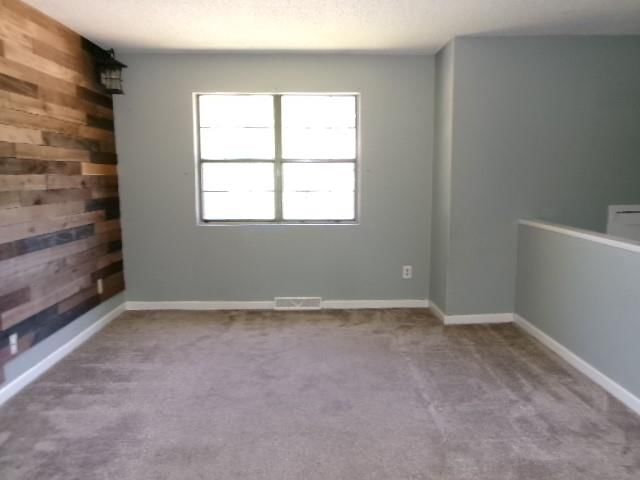
504 Alfalfa Ln, Buckner, MO


1620 S Borgan Rd, Buckner, MO


30500 E US-24 Highway, Buckner, MO
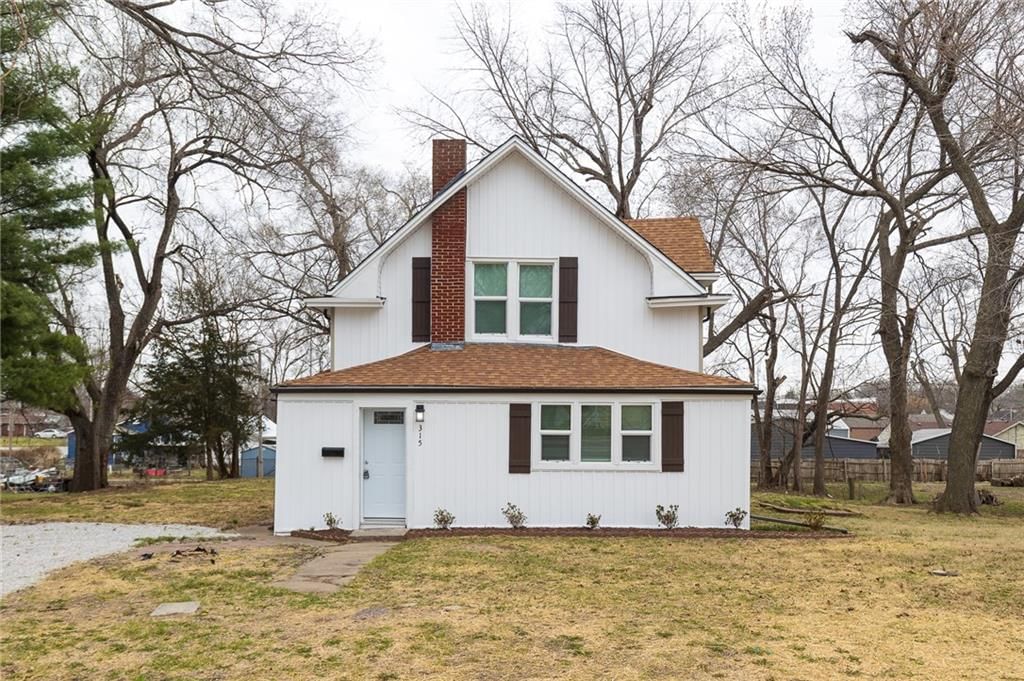
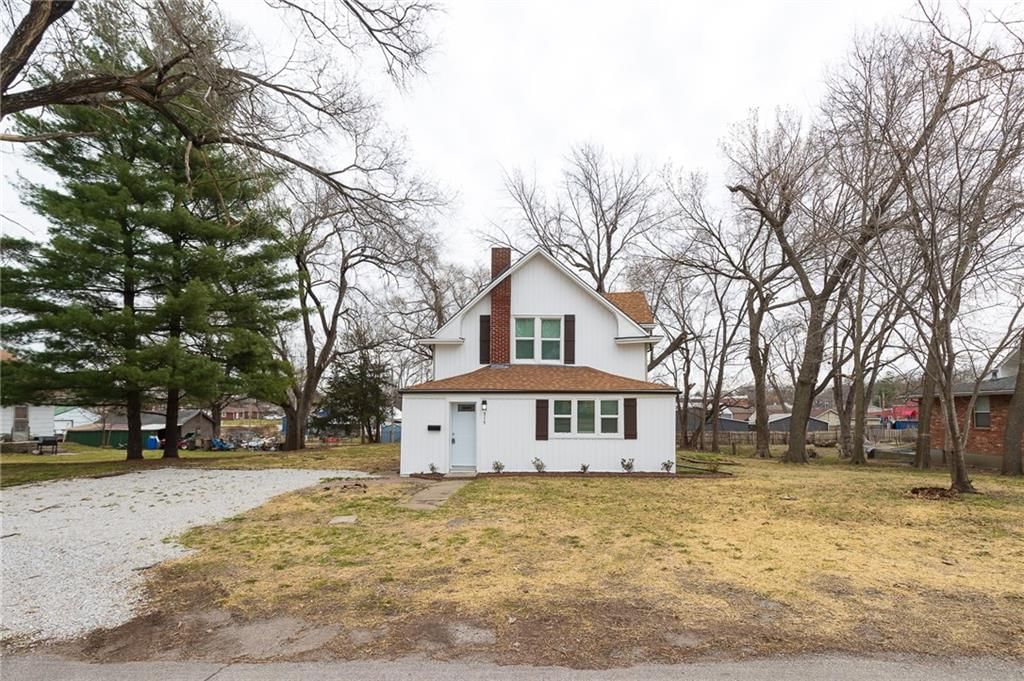
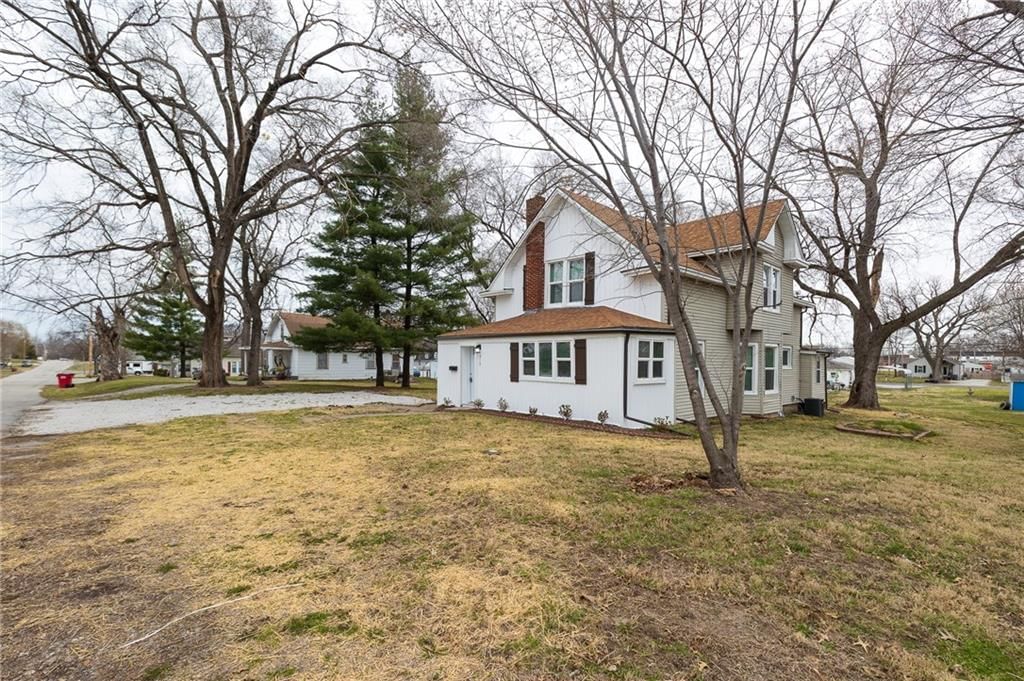
315 Osage St, Buckner, MO
Real estate FAQs about 64016
How many homes are for sale in 64016?
How much does a home in 64016 cost?
What is the price per square foot in 64016?
How fast do homes sell in 64016?
How many homes have sold in 64016 in the past year?
Is 64016 a buyer's or seller's market?
What does recent activity look like in 64016?
When were the homes in 64016 built?
Are there older homes for sale in 64016?
How big are the homes for sale in 64016?
How big are the lots in 64016?
How many bedrooms do homes in 64016 have?
Do homes in 64016 have HOA fees?
Are there single-story homes for sale in 64016?
What schools serve 64016?
What is the most common flooring in 64016 homes?
What are the nearby places to 64016?
Schools serving 64016
| School | Median list | For sale |
|---|---|---|
| School districts | ||
| Fort Osage School District | Median— | — |
| High schools | ||
| Fort Osage | Median— | — |
| Middle schools | ||
| Fort Osage | Median— | — |
| Elementary schools | ||
| Buckner | Median— | — |
How we compute these
- Median list.
- The middle asking price among the homes for sale right now. Half are listed above it, half below.
- For sale.
- Homes listed as active right now. A live count, not a monthly average.
Homes by feature in 64016
| Feature | For sale |
|---|---|
| No HOA | For sale14 |
| Homes with public water | For sale12 |
| 2+ car garage | For sale8 |
| Homes with a public sewer | For sale8 |
How we compute these
- For sale.
- Homes listed as active right now. A live count, not a monthly average.
Nearby neighborhoods to Buckner
| Neighborhood | Market (Market type is set by months of supply — how long it would take to sell every home for sale at the current pace. Under ~4 months favors sellers (low inventory, faster sales, homes near or above asking); over ~6 favors buyers (more choice, more negotiating room). 4–6 is balanced.) | Months supply | For sale | Median sale | Sell-to-list | Days to contract | Coming soon | Under contract |
|---|---|---|---|---|---|---|---|---|
| Millview | Strong Buyer's | 12 mo | 1 | Median$210,000 | — | 7d | 0 | 0 |
How we compute these
- Market.
- Market type is set by months of supply — how long it would take to sell every home for sale at the current pace. Under ~4 months favors sellers (low inventory, faster sales, homes near or above asking); over ~6 favors buyers (more choice, more negotiating room). 4–6 is balanced.
- Months supply.
- How many months it would take to sell every home now for sale at the pace of the last 90 days: homes for sale ÷ (closings in the last 90 days ÷ 3).
- For sale.
- Homes listed as active right now. A live count, not a monthly average.
- Days to contract.
- The middle number of days between a home being listed and going under contract, over the last 90 days of closings. It is not days-to-close, and it is not how long today's listings have been sitting. Newly built homes are excluded, because a build finishing is not a market moving.
- Coming soon.
- Homes announced but not yet accepting showings. A live count.
- Under contract.
- Homes with an accepted contract that have not closed yet. A live count.
Search homes nearby 64016
| Place | Market (Market type is set by months of supply — how long it would take to sell every home for sale at the current pace. Under ~4 months favors sellers (low inventory, faster sales, homes near or above asking); over ~6 favors buyers (more choice, more negotiating room). 4–6 is balanced.) | Months supply | Median list | Sell-to-list | Days to contract | For sale | Coming soon | Under contract |
|---|---|---|---|---|---|---|---|---|
| Buckner | Seller's | 2.4 mo | Median$287,498 | 96% | 28d | 12 | 1 | 3 |
| Kansas City | Seller's | 4 mo | Median$265,000 | 100% | 21d | 2,125 | 106 | 815 |
| Independence | Seller's | 3.3 mo | Median$225,000 | 100% | 20d | 434 | 21 | 157 |
| Lee's Summit | Seller's | 2.9 mo | Median$504,500 | 98% | 19d | 406 | 24 | 197 |
| Blue Springs | Seller's | 2.7 mo | Median$387,000 | 99% | 18d | 204 | 5 | 124 |
How we compute these
- Market.
- Market type is set by months of supply — how long it would take to sell every home for sale at the current pace. Under ~4 months favors sellers (low inventory, faster sales, homes near or above asking); over ~6 favors buyers (more choice, more negotiating room). 4–6 is balanced.
- Months supply.
- How many months it would take to sell every home now for sale at the pace of the last 90 days: homes for sale ÷ (closings in the last 90 days ÷ 3).
- Median list.
- The middle asking price among the homes for sale right now. Half are listed above it, half below.
- Days to contract.
- The middle number of days between a home being listed and going under contract, over the last 90 days of closings. It is not days-to-close, and it is not how long today's listings have been sitting. Newly built homes are excluded, because a build finishing is not a market moving.
- For sale.
- Homes listed as active right now. A live count, not a monthly average.
- Coming soon.
- Homes announced but not yet accepting showings. A live count.
- Under contract.
- Homes with an accepted contract that have not closed yet. A live count.