
Homes with On-Street Parking for Sale in Jackson County, MO
34 homes for sale in Jackson County · Sorted by Newest Listed


203 N Mersington Avenue, Kansas City, MO
New · 5h ago

4300 - 4302 Virginia Avenue, Kansas City, MO
New · 1d ago


3612 Wyandotte Street, Kansas City, MO
New · 2d ago


8721 Countryshire Lane, Kansas City, MO
New · 7d ago


2909 Topping Avenue, Kansas City, MO


3035 Harrison Street, Kansas City, MO


409 E Armour Boulevard, Kansas City, MO


11426 & 11428 E 27th Street S, Independence, MO


4340 Holly Street, Kansas City, MO


5208 E 8th Street, Kansas City, MO


1813 W 41st Street, Kansas City, MO


535 Bellefontaine Avenue, Kansas City, MO
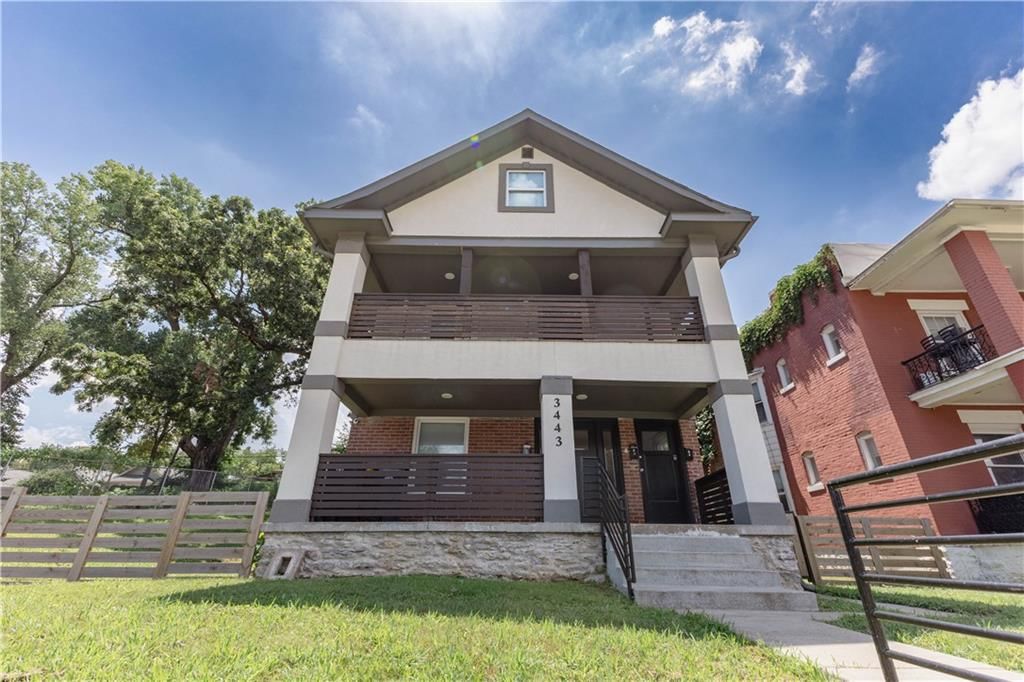

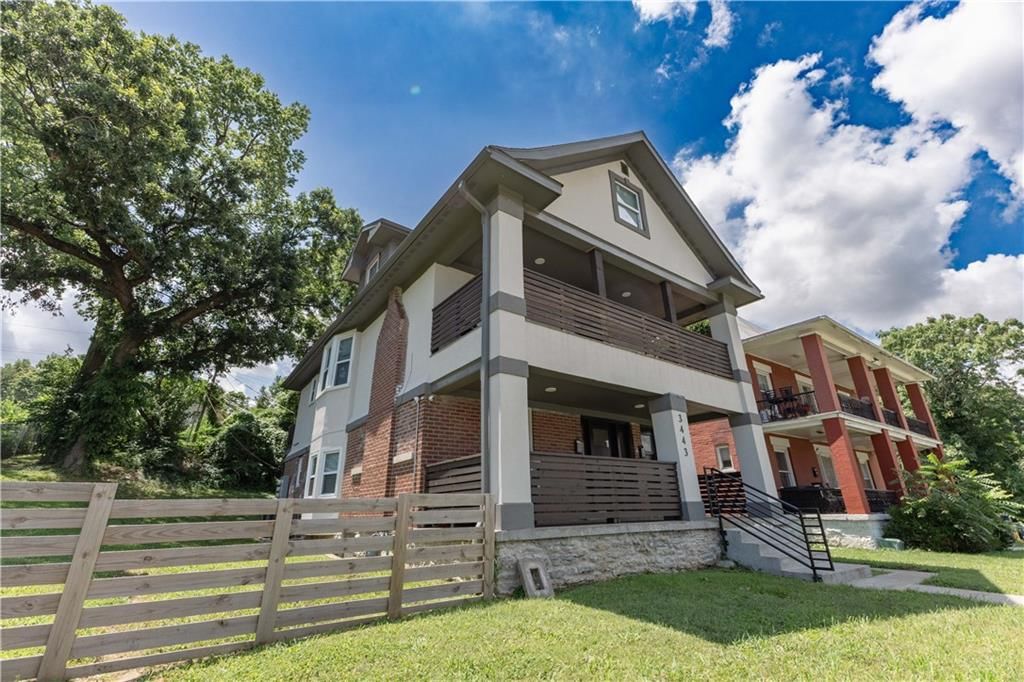
3443 E 6th Street, Kansas City, MO


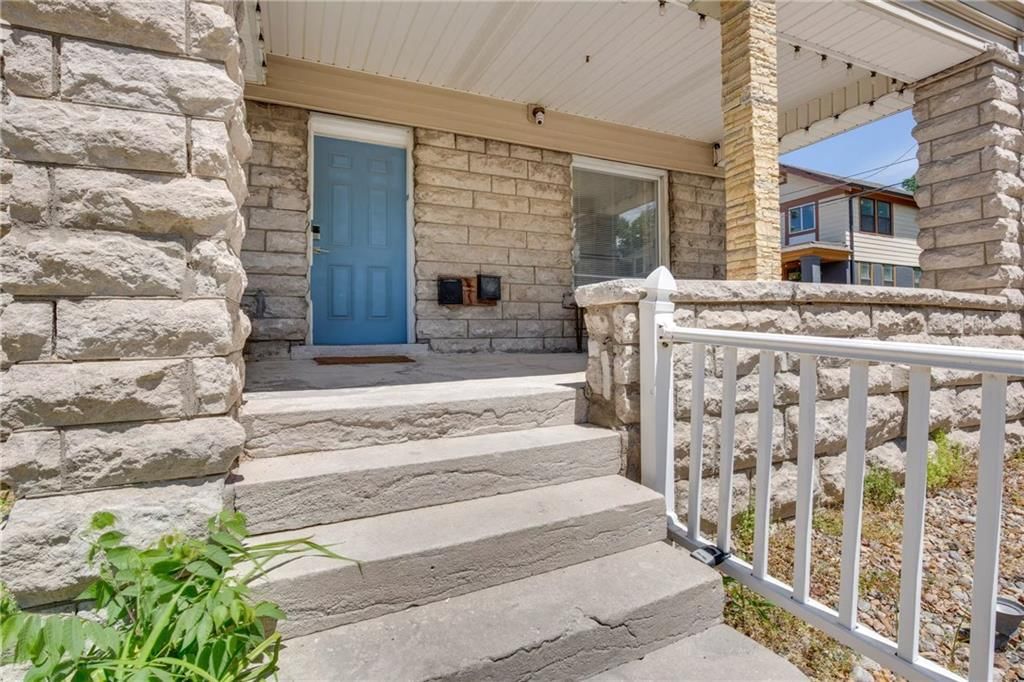
708 E 34th Street, Kansas City, MO
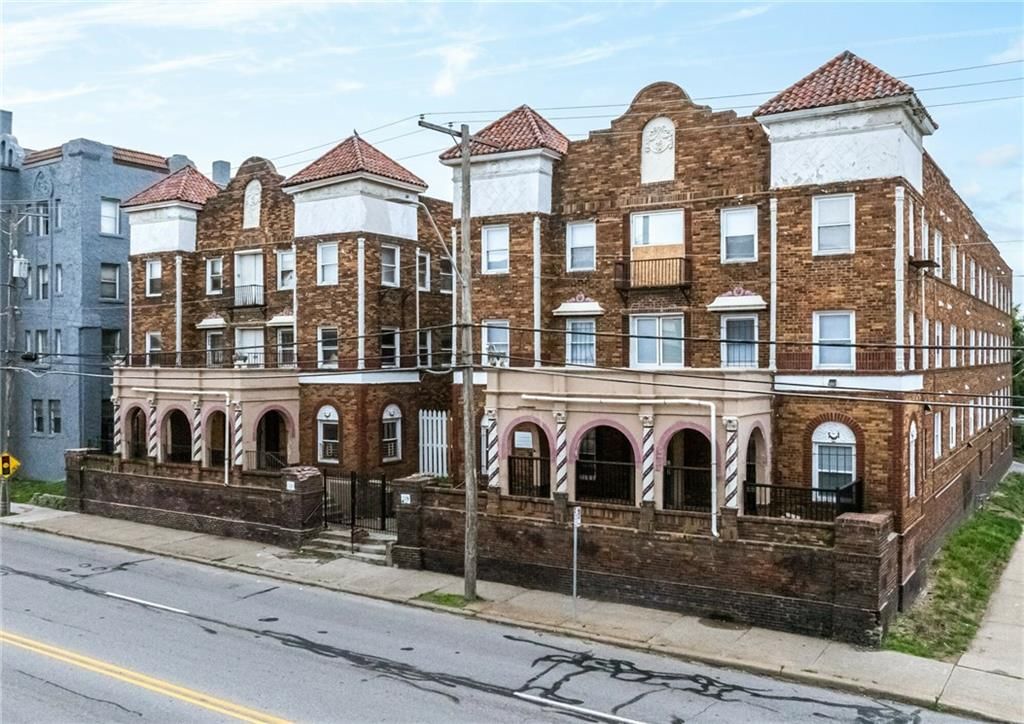


115-119 W 39th Street, Kansas City, MO


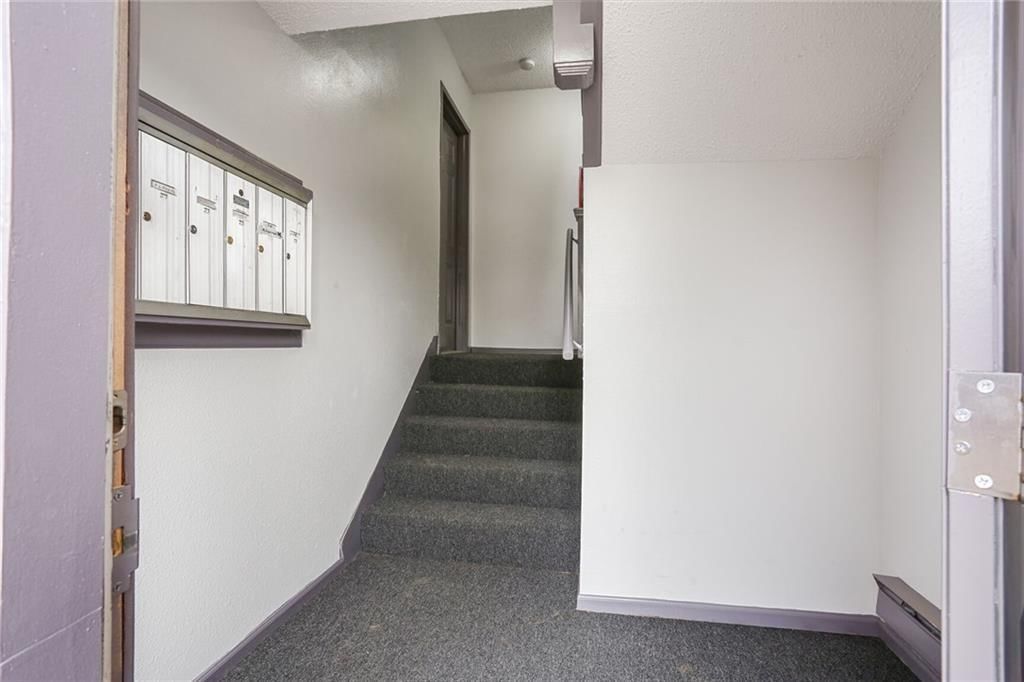
2408 E 29th Street, Kansas City, MO

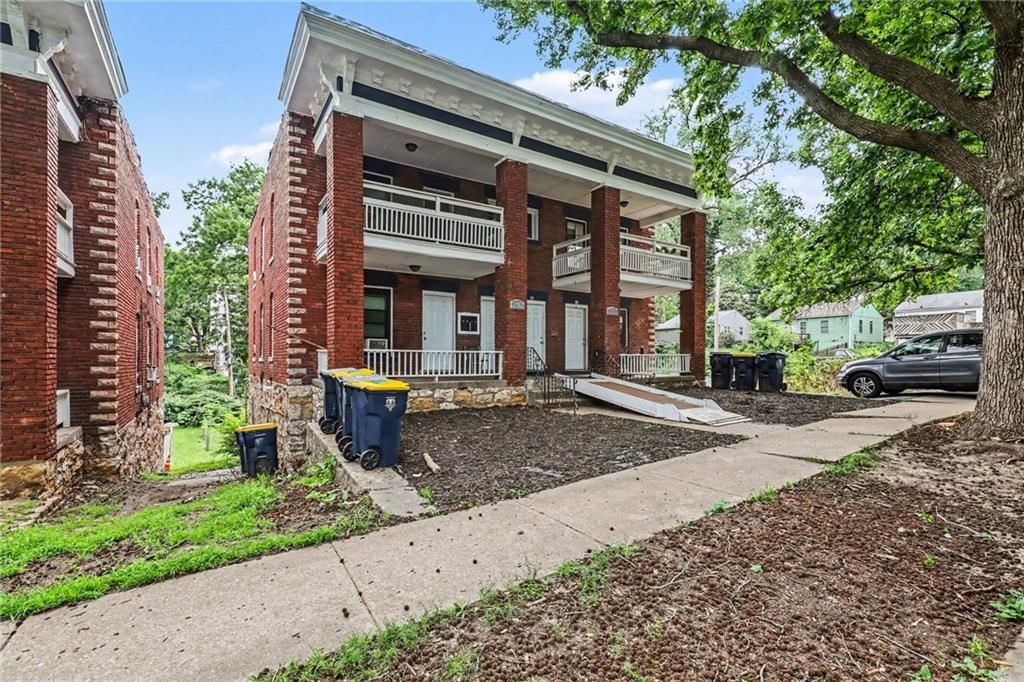

3915 Norledge Avenue, Kansas City, MO


3906 E 123 Terrace, Grandview, MO


2210 E 34th Street, Kansas City, MO


137 S FULLER Street, Independence, MO


133 S FULLER Street, Independence, MO


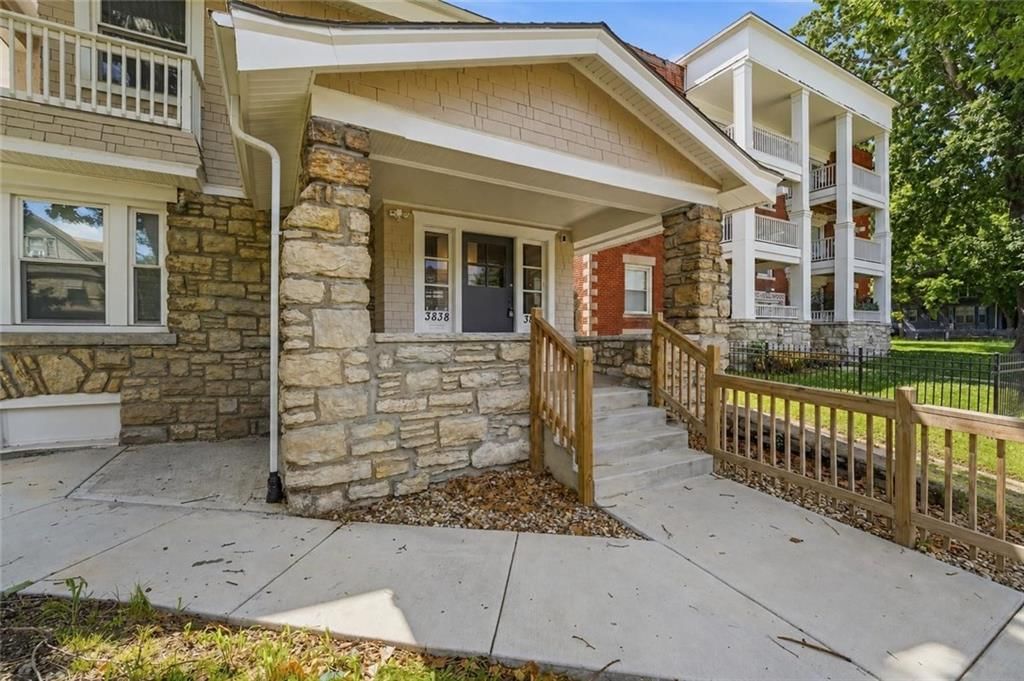
3836 Wyandotte Street, Kansas City, MO


1836 E 78th Street, Kansas City, MO
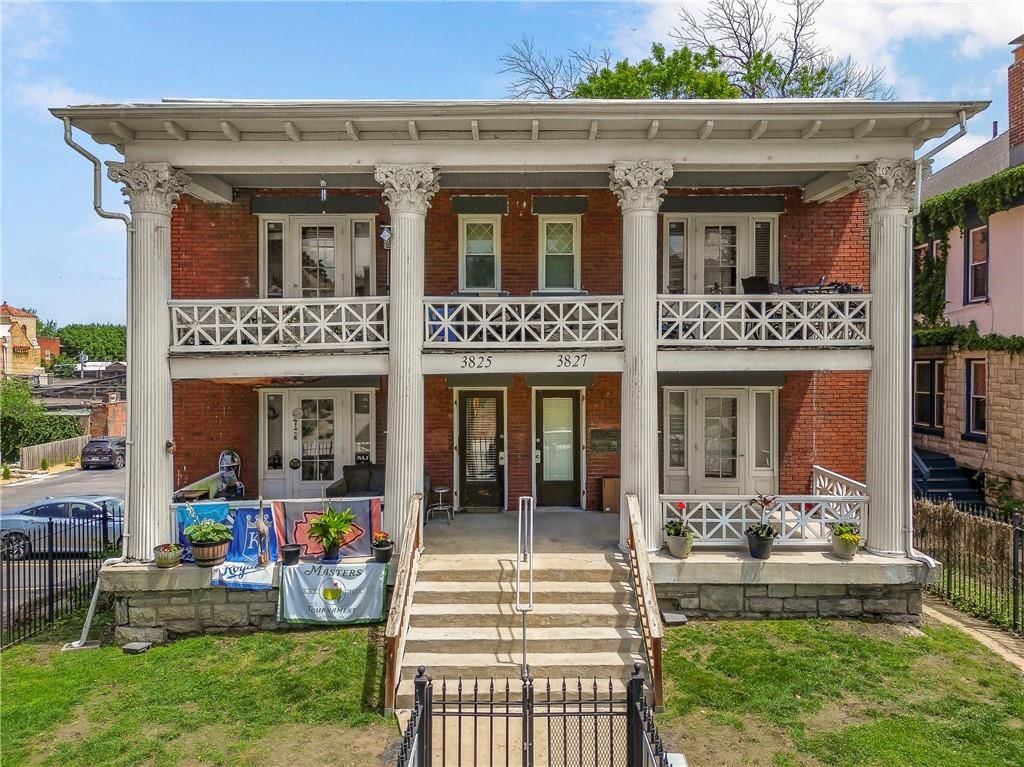


3825 Baltimore Avenue, Kansas City, MO
Start withthe numbers that matter to you
Jackson County offers 2,600+ homes from the $100s to $1M+, with a $280K median list price and 72 days on market — enough room to breathe, but the best stuff still moves.
Real estate inJackson County, Missouri
Jackson County, MO has about 302,726 households and a median household income of $67,178. Roughly 59% of homes are owner-occupied, the median owner's home value is $213,300, 33% of adults hold a bachelor's degree or higher. The average commute runs 23.4 minutes. The Census counts 717,021 residents. New construction is still adding supply: 243 building permits were issued in 2026-07.
The real question every buyer in Jackson County faces right now is whether to wait for prices to soften or accept that $280,000 is genuinely close to the floor for a move-in-ready home in a decent zip code. The short answer: waiting hasn't paid off here. With 2,827 active listings and homes averaging 72 days on market, there's more breathing room than during the frenzy years, but that average is pulled up by overpriced listings that sit. Well-priced homes in good condition still attract multiple offers fast. Sellers who price realistically move. Sellers who test the market learn a hard lesson around day 45.
Kansas City proper is the county's anchor and its most complicated market. Neighborhoods like Brookside, Waldo, and the Crossroads attract buyers who want walkability, character homes from the 1920s and 30s, and proximity to some of the best restaurants in the metro. Prices here stretch well above the county median and inventory is tight by comparison. The east side and urban core offer genuine affordability — often under $200K — but buyers need to do careful homework on condition, insurance costs, and block-by-block resale dynamics.
Independence is the county's most underrated value play. It's the largest city in the county outside KC proper, with its own downtown, strong community identity, and a wide range of housing stock — from sub-$150K fixer-uppers to well-maintained $300K family homes. The Truman area and Sugar Creek neighborhoods have loyal buyer pools. Lee's Summit, on the southern end, is where families with school-age kids tend to land. The Lee's Summit R-7 school district consistently draws buyers willing to pay a premium, and the downtown has enough coffee shops and locally-owned restaurants to feel like a real town, not just a suburb.
Blue Springs sits just east of Lee's Summit and offers similar family-oriented appeal at a slight discount — good schools, newer subdivisions, easy access to I-70, and a lot of ranch and two-story homes built between the 1980s and 2000s. Raytown and Grandview are the county's most affordable incorporated cities for buyers who need to stretch a budget without leaving the metro area entirely. Both have older housing stock, which means more maintenance risk but also more square footage per dollar. Grain Valley, Oak Grove, and Lone Jack represent the county's eastern frontier — newer construction, larger lots, quieter pace, and a tradeoff of longer commutes into Kansas City. Greenwood is small and semi-rural, with acreage properties that attract buyers who want space without leaving Jackson County.
The year-built range running from 1843 into what appears to be a data quirk on the high end tells a real story: Jackson County has genuine historic inventory. That means charm, and it means costs. Buyers should budget for inspections that turn up knob-and-tube wiring, older HVAC systems, and foundation quirks on anything pre-1970. At an average list price of $484 per square foot on the higher end of the market and genuine starter homes still available well below the median, this county remains one of the more accessible major metros in the Midwest — but it rewards buyers who move decisively and sellers who price with honesty from day one.
Sources — demographics: U.S. Census Bureau, American Community Survey 5-year estimates (2023) · listings, prices and days on market: Heartland MLS as distributed by MLS GRID, as of September 17, 2026 · analysis and home values: HouseLoop calculations
Housing market trendsin Jackson County, Missouri
Jackson County, MO: 2,749 homes for sale · 344 new in the last 7 days · median asking $280,000 · 1,266 price reductions · a median of 17 days to contract. 848 homes closed in the last 30 days, at a median of $293,250. At the pace of the last 90 days that is 3.2 months of supply.
| Measure | Aug 2026 |
|---|---|
| Median sale price | $295,000 |
| Median price per sq ft | $168 |
| Median days to contract | 20 |
| Sell-to-list ratio | 100% |
| Homes sold | 814 |
| New listings | 1,210 |
| Went under contract | 908 |
Real estateFAQs about Jackson County
How many homes are for sale in Jackson County?
How much does a home in Jackson County cost?
What is the price per square foot in Jackson County?
How fast do homes sell in Jackson County?
How many homes have sold in Jackson County in the past year?
When were the homes in Jackson County built?
What are the newest homes for sale in Jackson County?
Are there older homes for sale in Jackson County?
How big are the homes for sale in Jackson County?
How big are the lots in Jackson County?
How many bedrooms do homes in Jackson County have?
Do homes in Jackson County have HOA fees?
Are there single-story homes for sale in Jackson County?
Are there homes with a pool in Jackson County?
What kind of garages do homes in Jackson County have?
What schools serve Jackson County?
Schoolsserving Jackson County
How we compute these
- Median list.
- The middle asking price among the homes for sale right now. Half are listed above it, half below.
- For sale.
- Homes listed as active right now. A live count, not a monthly average.
Newly listedin Jackson County, MO
| Address | Price |
|---|---|
| 1405 N McCoy Street | Price$255,000 |
| 7310 Ruskin Way | Price$134,900 |
| 30402 E 138th Street | Price$949,900 |
| 30600 E 138th Street | Price$899,900 |
| 30606 E 138th Street | Price$949,900 |
| 30300 E 138th Street | Price$949,900 |
| 30405 138th Street | Price$949,900 |
| 11203 N Monroe Court | Price$209,900 |
| 734 E 121st Terrace | Price$225,000 |
| 2634 SW Wintervalley Drive | Price$700,000 |
| 207 SE CLAREMONT Street | Price$310,000 |
| 203 N Mersington Avenue | Price$550,000 |
Recently went under contractin Jackson County, MO
| Address | List price |
|---|---|
| 11243 Grand Avenue | List price$207,000 |
| 4002 S Hocker Avenue | List price$189,000 |
| 13000 Gammon Road | List price$625,000 |
| 3200 Robinson Pike Road | List price$560,000 |
| 7016 Monroe Avenue | List price$149,750 |
| 7703 E 108 Terrace | List price$120,000 |
| 1608 SW 9th Street | List price$337,900 |
| 2906 SW 13th Terrace | List price$565,000 |
| 5518-5520 E Truman Road | List price$295,000 |
| 25 Beach Drive | List price$555,000 |
| 1130 Deer Run Drive | List price$675,000 |
| 4808 NE PEBBLE BEACH Street | List price$440,000 |
How we compute these
- Under contract.
- Homes with an accepted contract that have not closed yet. A live count.
- Days to contract.
- The middle number of days between a home being listed and going under contract, over the last 90 days of closings. It is not days-to-close, and it is not how long today's listings have been sitting. Newly built homes are excluded, because a build finishing is not a market moving.
Popular home searchesin Jackson County
| Search | For sale |
|---|---|
| Open houses | 159 |
| Luxury homes | 103 |
| Just listed homes | 322 |
| Price-reduced homes | 1,223 |
| Coming soon homes | 214 |
| Homes under contract | 1,133 |
How we compute these
- For sale.
- Homes listed as active right now. A live count, not a monthly average.
Homes by pricein Jackson County
How we compute these
- For sale.
- Homes listed as active right now. A live count, not a monthly average.
Homes by featurein Jackson County
How we compute these
- For sale.
- Homes listed as active right now. A live count, not a monthly average.
Search by property typein Jackson County
| Property type | Median sale |
|---|---|
| Single Family | $290,000 |
| Townhouse | $221,750 |
| Villa | Median— |
| Condo / Loft | $205,000 |
| Half Duplex | Median— |
| Duplex | Median— |
| Triplex | Median— |
| Quadruplex | Median— |
| Lots / Land | $112,500 |
How we compute these
- Market.
- Market type is set by months of supply — how long it would take to sell every home for sale at the current pace. Under ~4 months favors sellers (low inventory, faster sales, homes near or above asking); over ~6 favors buyers (more choice, more negotiating room). 4–6 is balanced.
- Months supply.
- How many months it would take to sell every home now for sale at the pace of the last 90 days: homes for sale ÷ (closings in the last 90 days ÷ 3).
- For sale.
- Homes listed as active right now. A live count, not a monthly average.
- Days to contract.
- The middle number of days between a home being listed and going under contract, over the last 90 days of closings. It is not days-to-close, and it is not how long today's listings have been sitting. Newly built homes are excluded, because a build finishing is not a market moving.
- Coming soon.
- Homes announced but not yet accepting showings. A live count.
- Under contract.
- Homes with an accepted contract that have not closed yet. A live count.
Search homesin Jackson County
| City | Median list |
|---|---|
| Kansas City | $261,500 |
| Independence | $225,000 |
| Lee's Summit | $525,000 |
| Blue Springs | $399,900 |
| Raytown | $237,000 |
| Grandview | $274,900 |
How we compute these
- Market.
- Market type is set by months of supply — how long it would take to sell every home for sale at the current pace. Under ~4 months favors sellers (low inventory, faster sales, homes near or above asking); over ~6 favors buyers (more choice, more negotiating room). 4–6 is balanced.
- Months supply.
- How many months it would take to sell every home now for sale at the pace of the last 90 days: homes for sale ÷ (closings in the last 90 days ÷ 3).
- Median list.
- The middle asking price among the homes for sale right now. Half are listed above it, half below.
- Days to contract.
- The middle number of days between a home being listed and going under contract, over the last 90 days of closings. It is not days-to-close, and it is not how long today's listings have been sitting. Newly built homes are excluded, because a build finishing is not a market moving.
- For sale.
- Homes listed as active right now. A live count, not a monthly average.
- Coming soon.
- Homes announced but not yet accepting showings. A live count.
- Under contract.
- Homes with an accepted contract that have not closed yet. A live count.
ZIP codesin Jackson County
How we compute these
- Market.
- Market type is set by months of supply — how long it would take to sell every home for sale at the current pace. Under ~4 months favors sellers (low inventory, faster sales, homes near or above asking); over ~6 favors buyers (more choice, more negotiating room). 4–6 is balanced.
- Months supply.
- How many months it would take to sell every home now for sale at the pace of the last 90 days: homes for sale ÷ (closings in the last 90 days ÷ 3).
- Median list.
- The middle asking price among the homes for sale right now. Half are listed above it, half below.
- Days to contract.
- The middle number of days between a home being listed and going under contract, over the last 90 days of closings. It is not days-to-close, and it is not how long today's listings have been sitting. Newly built homes are excluded, because a build finishing is not a market moving.
- For sale.
- Homes listed as active right now. A live count, not a monthly average.
- Coming soon.
- Homes announced but not yet accepting showings. A live count.
- Under contract.
- Homes with an accepted contract that have not closed yet. A live count.
Search homes for salein every city we cover
How we compute these
- Market.
- Market type is set by months of supply — how long it would take to sell every home for sale at the current pace. Under ~4 months favors sellers (low inventory, faster sales, homes near or above asking); over ~6 favors buyers (more choice, more negotiating room). 4–6 is balanced.
- Months supply.
- How many months it would take to sell every home now for sale at the pace of the last 90 days: homes for sale ÷ (closings in the last 90 days ÷ 3).
- Median list.
- The middle asking price among the homes for sale right now. Half are listed above it, half below.
- Days to contract.
- The middle number of days between a home being listed and going under contract, over the last 90 days of closings. It is not days-to-close, and it is not how long today's listings have been sitting. Newly built homes are excluded, because a build finishing is not a market moving.
- For sale.
- Homes listed as active right now. A live count, not a monthly average.
- Coming soon.
- Homes announced but not yet accepting showings. A live count.
- Under contract.
- Homes with an accepted contract that have not closed yet. A live count.
Search for homesin popular markets
| Market | For sale |
|---|---|
| Heritage Ranch | 28 |
| Ruskin Heights | 25 |
| Canyon Lakes | 25 |
| Garrett Ranch | 24 |
| Seven Bridges | 23 |
| Tomahawk Valley | 23 |
How we compute these
- Market.
- Market type is set by months of supply — how long it would take to sell every home for sale at the current pace. Under ~4 months favors sellers (low inventory, faster sales, homes near or above asking); over ~6 favors buyers (more choice, more negotiating room). 4–6 is balanced.
- For sale.
- Homes listed as active right now. A live count, not a monthly average.
Or go wider stillcounty, metro and state
How we compute these
- Market.
- Market type is set by months of supply — how long it would take to sell every home for sale at the current pace. Under ~4 months favors sellers (low inventory, faster sales, homes near or above asking); over ~6 favors buyers (more choice, more negotiating room). 4–6 is balanced.
- Months supply.
- How many months it would take to sell every home now for sale at the pace of the last 90 days: homes for sale ÷ (closings in the last 90 days ÷ 3).
- Median list.
- The middle asking price among the homes for sale right now. Half are listed above it, half below.
- Days to contract.
- The middle number of days between a home being listed and going under contract, over the last 90 days of closings. It is not days-to-close, and it is not how long today's listings have been sitting. Newly built homes are excluded, because a build finishing is not a market moving.
- For sale.
- Homes listed as active right now. A live count, not a monthly average.
- Coming soon.
- Homes announced but not yet accepting showings. A live count.
- Under contract.
- Homes with an accepted contract that have not closed yet. A live count.