
Fort Scott Real Estate & Homes For Sale
151 homes in Fort Scott · Sorted by Newest Listed
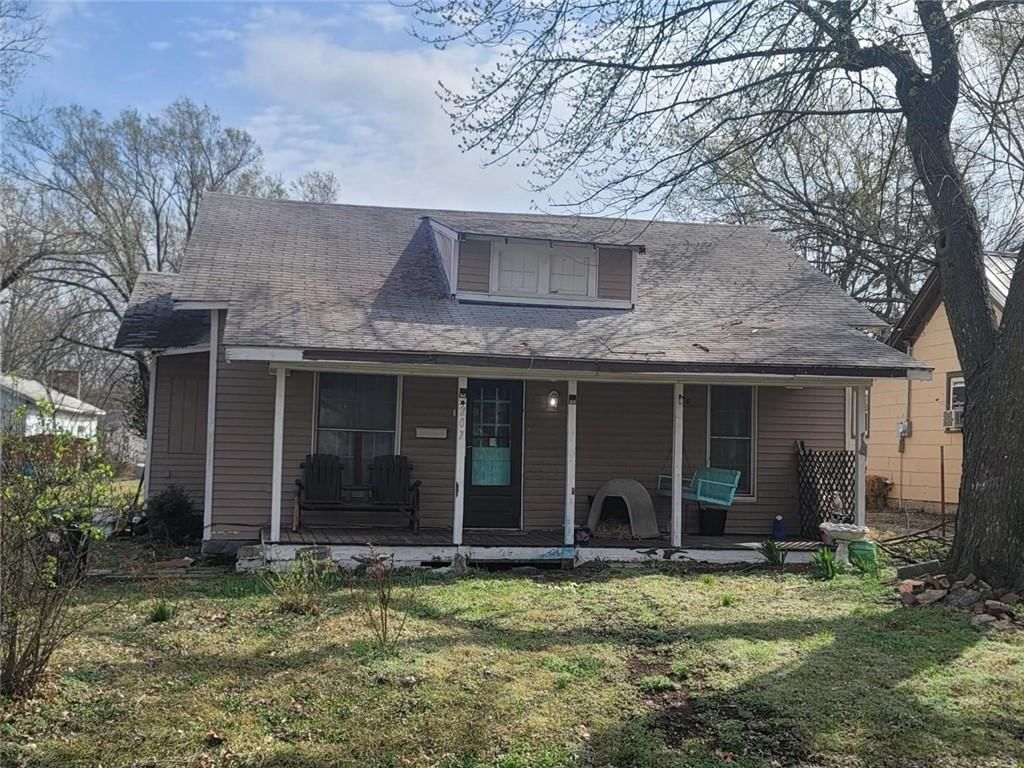

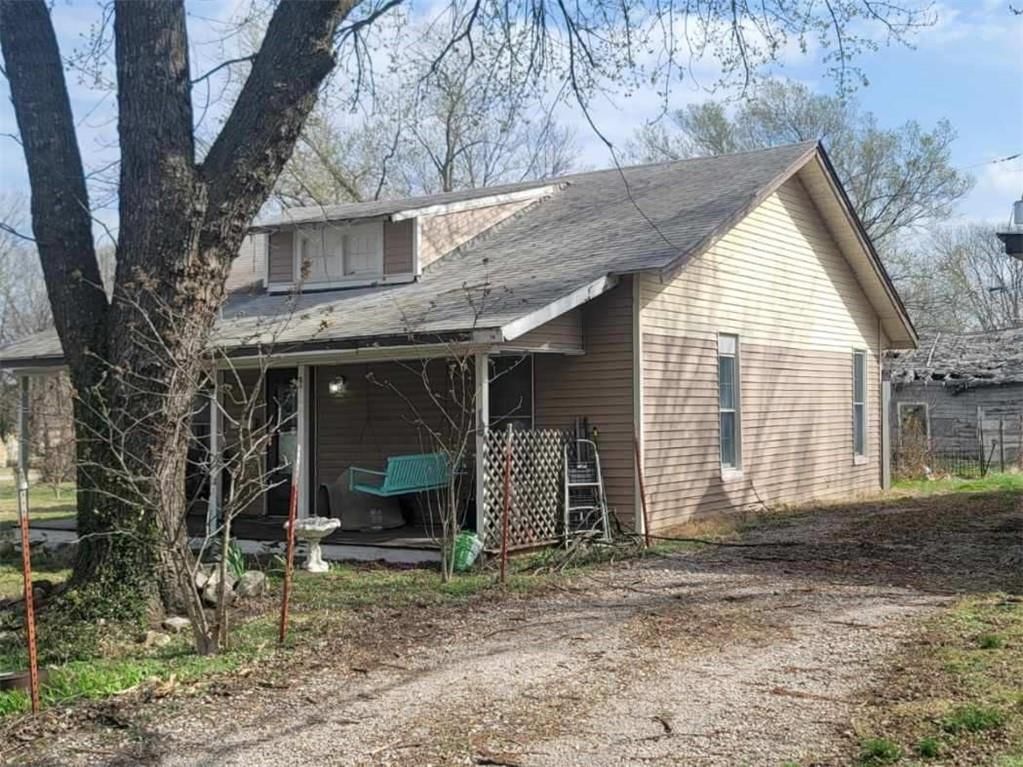
207 S Washington Street, Fort Scott, KS
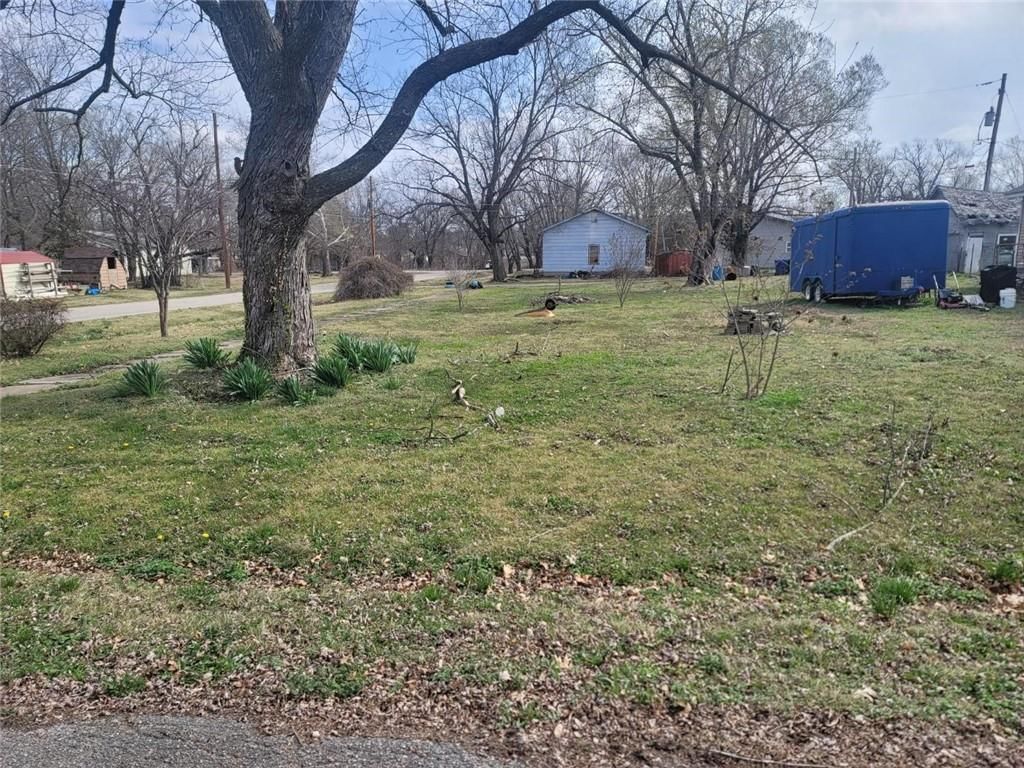

201 S Washington Street, Fort Scott, KS
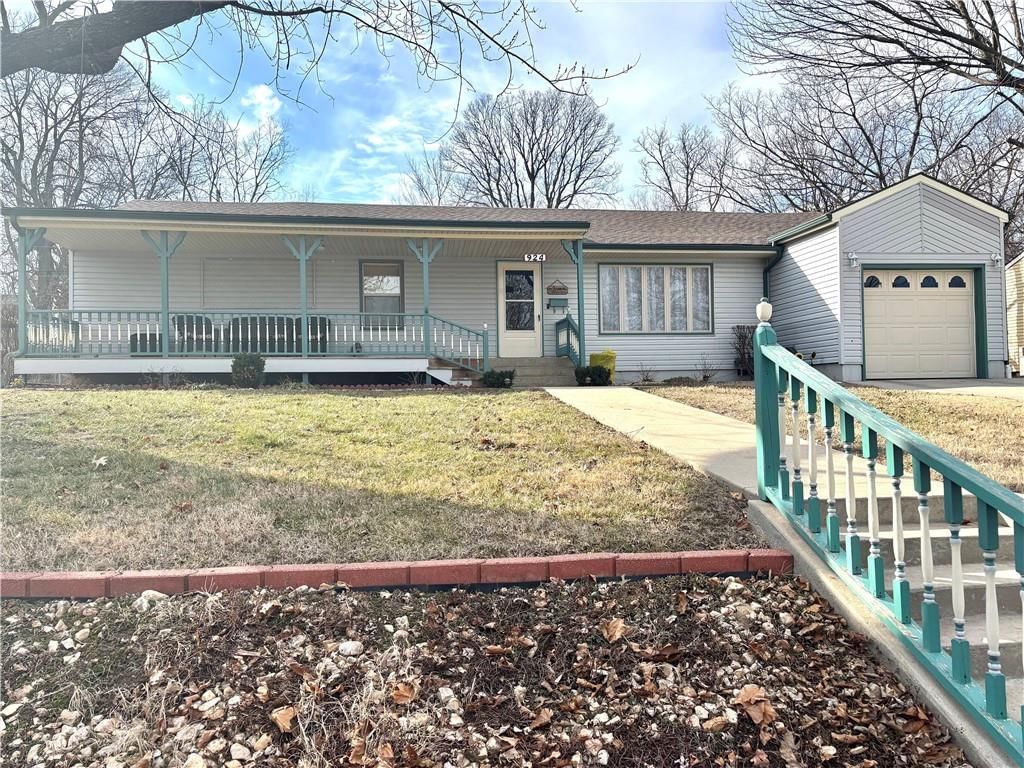
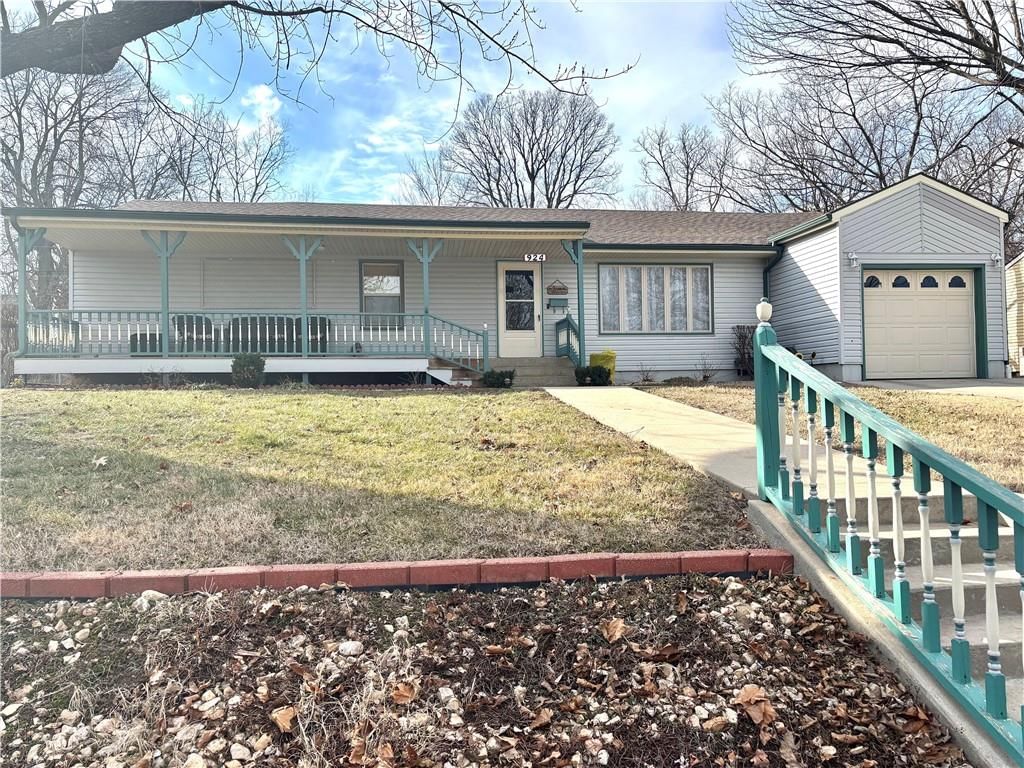
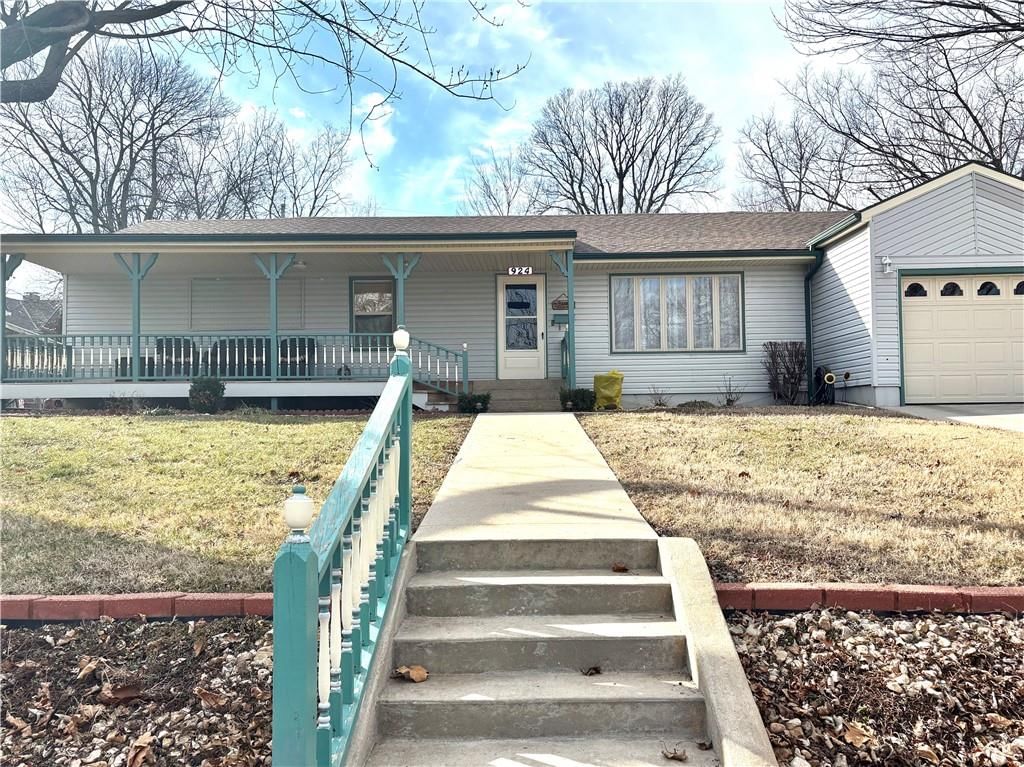
924 Osbun Street, Fort Scott, KS
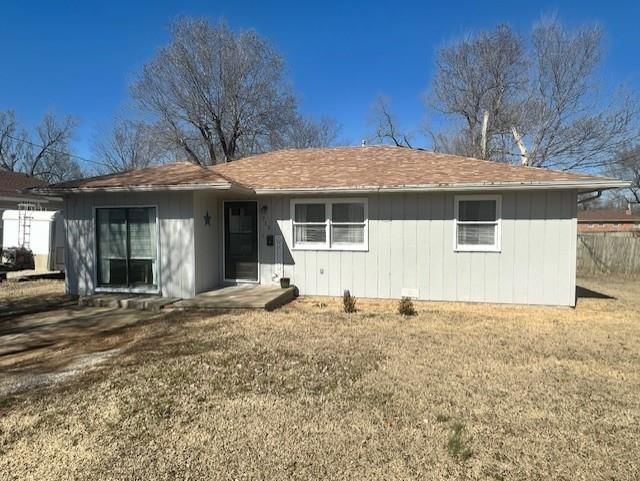


715 E National Avenue, Fort Scott, KS
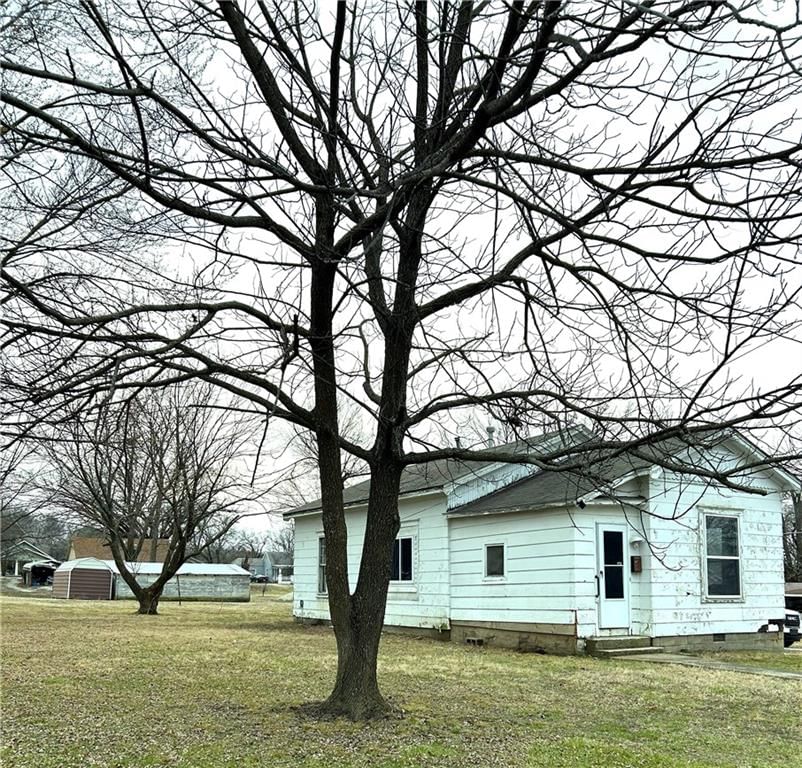

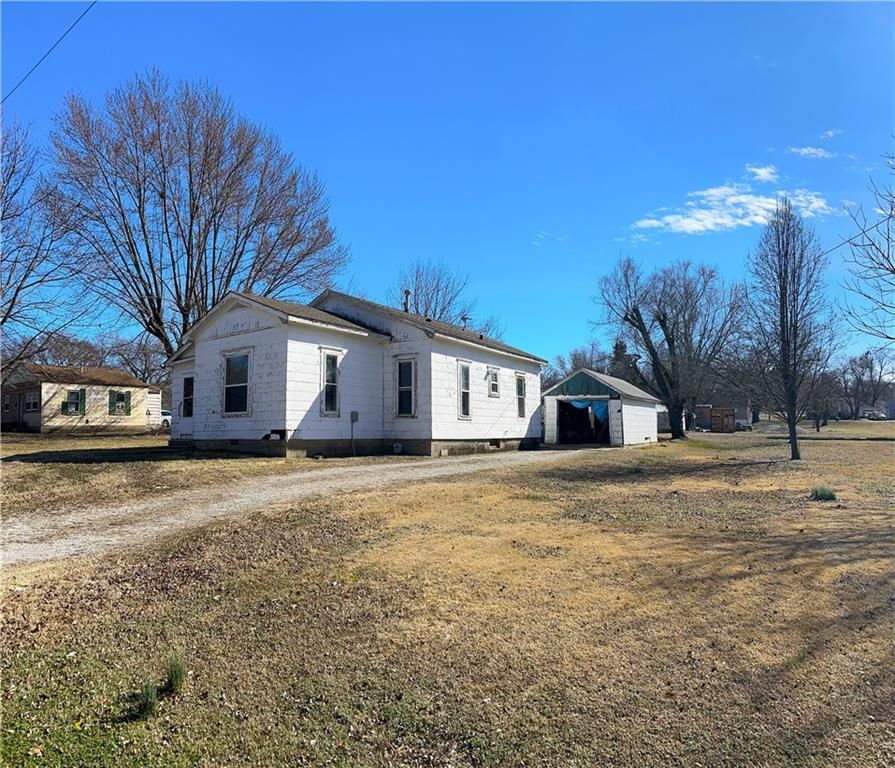
1732 E Oak Street, Fort Scott, KS
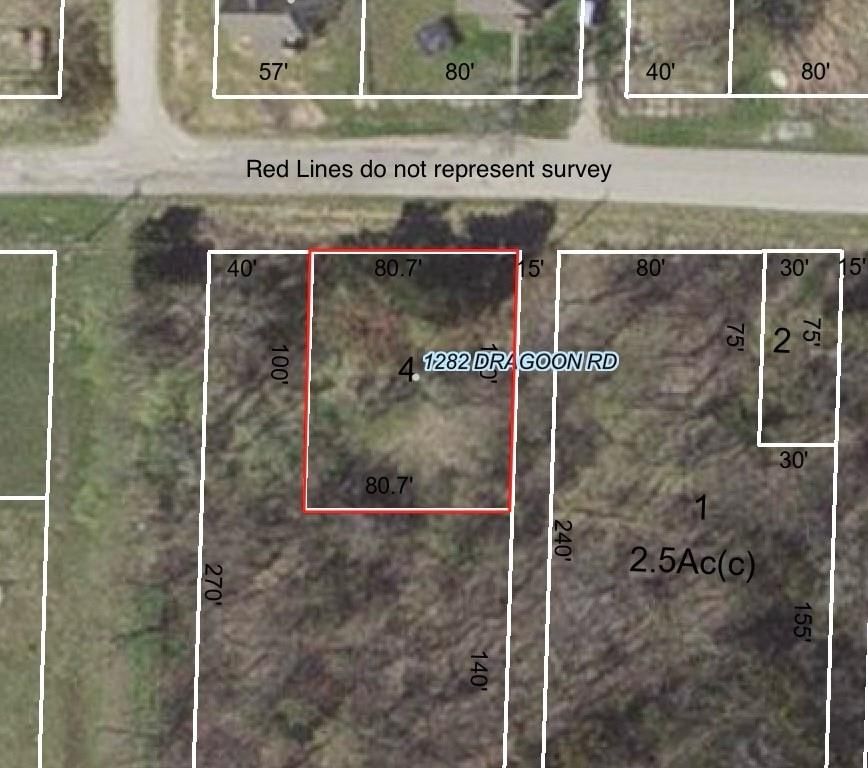

1282 Dragoon Road, Fort Scott, KS
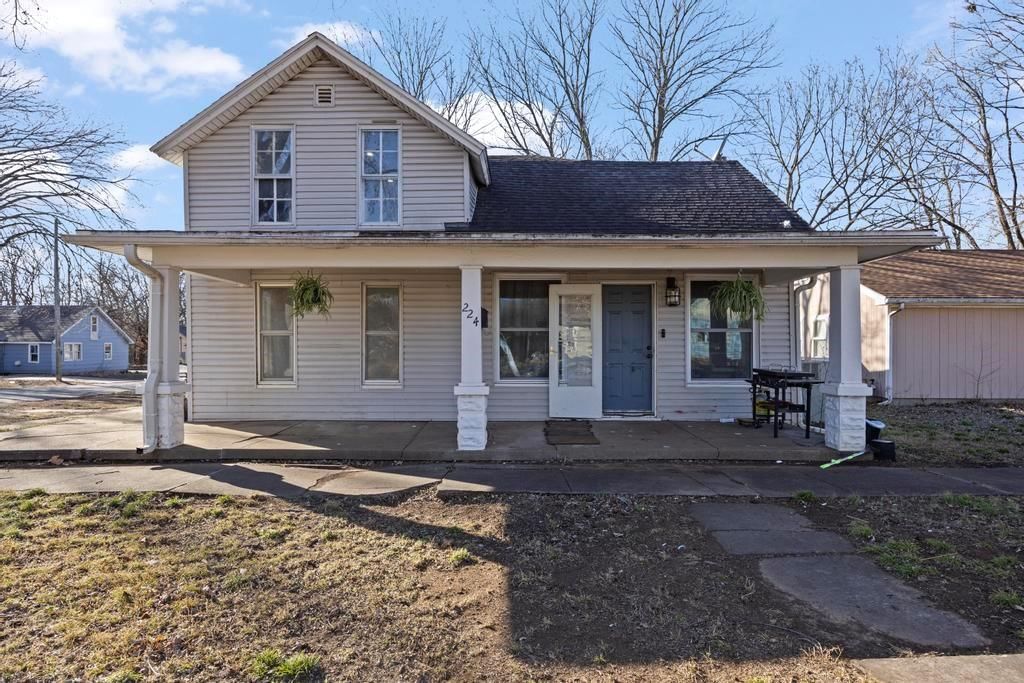


224 S Lowman Street, Fort Scott, KS
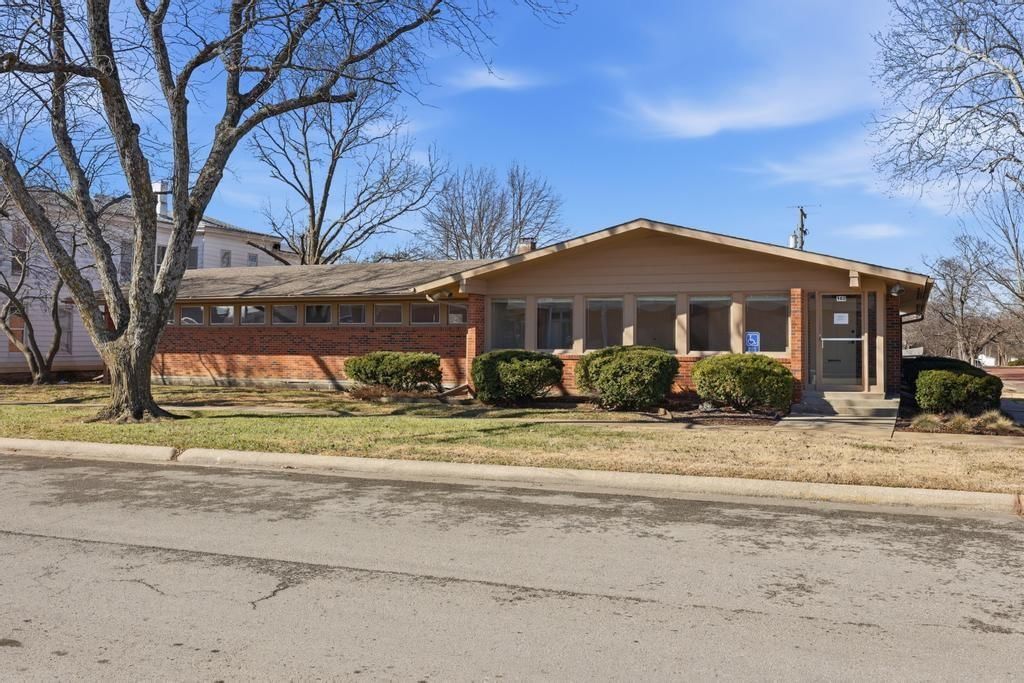


102 S Judson Street, Fort Scott, KS
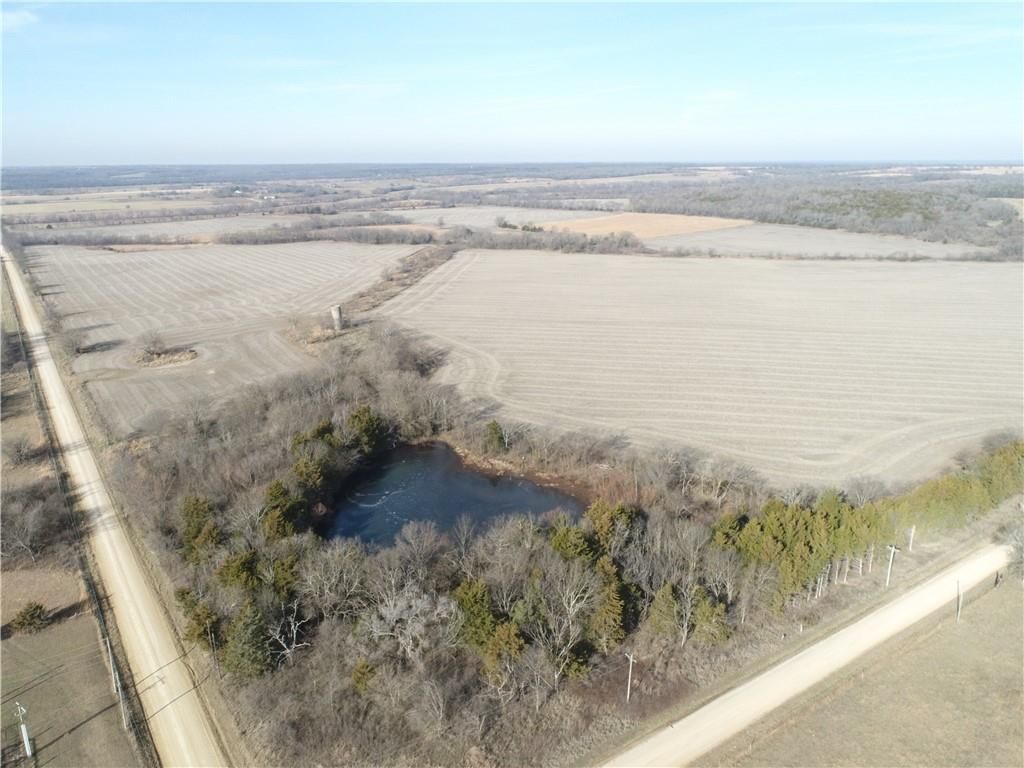

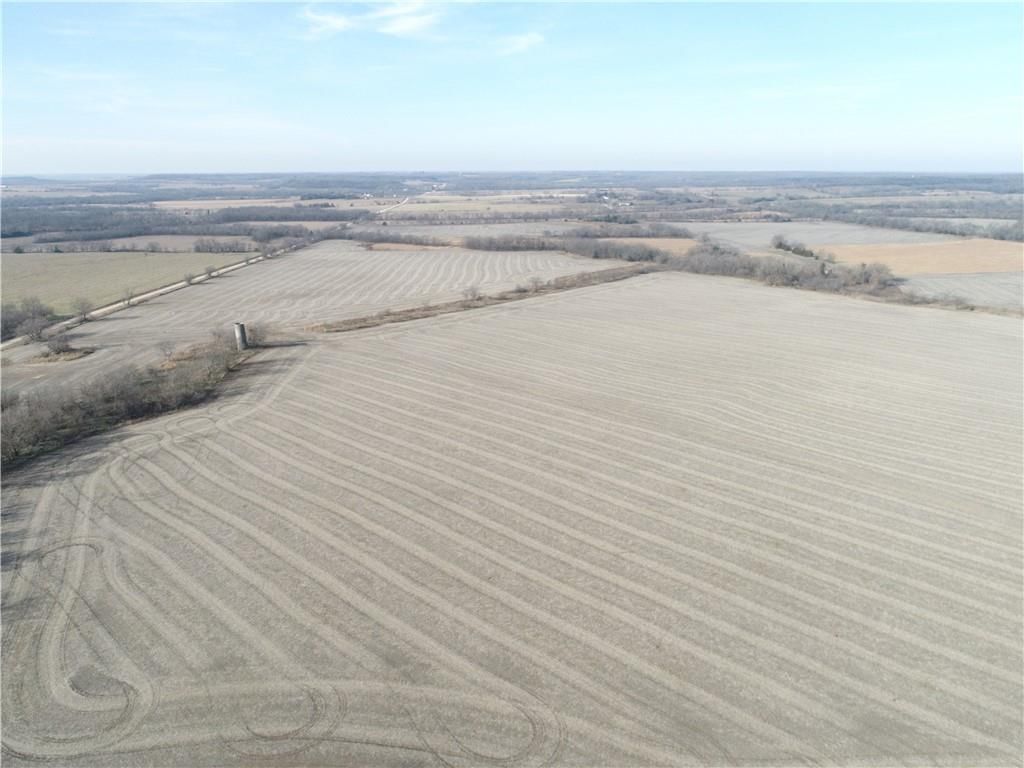
135? Range Rd Road, Fort Scott, KS
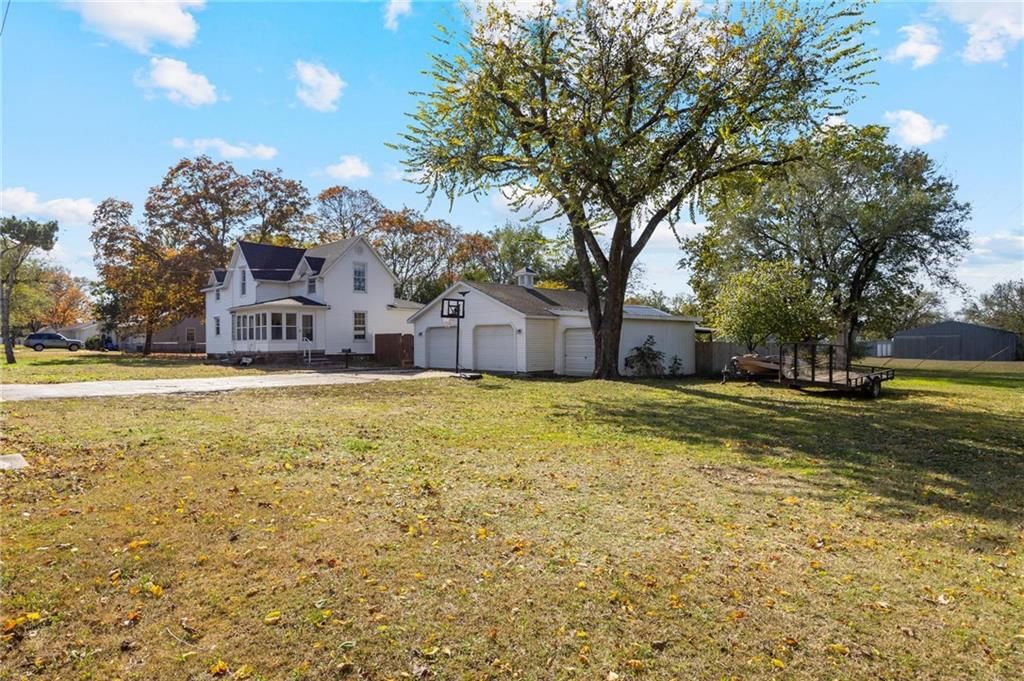


912 S Margrave Street, Fort Scott, KS
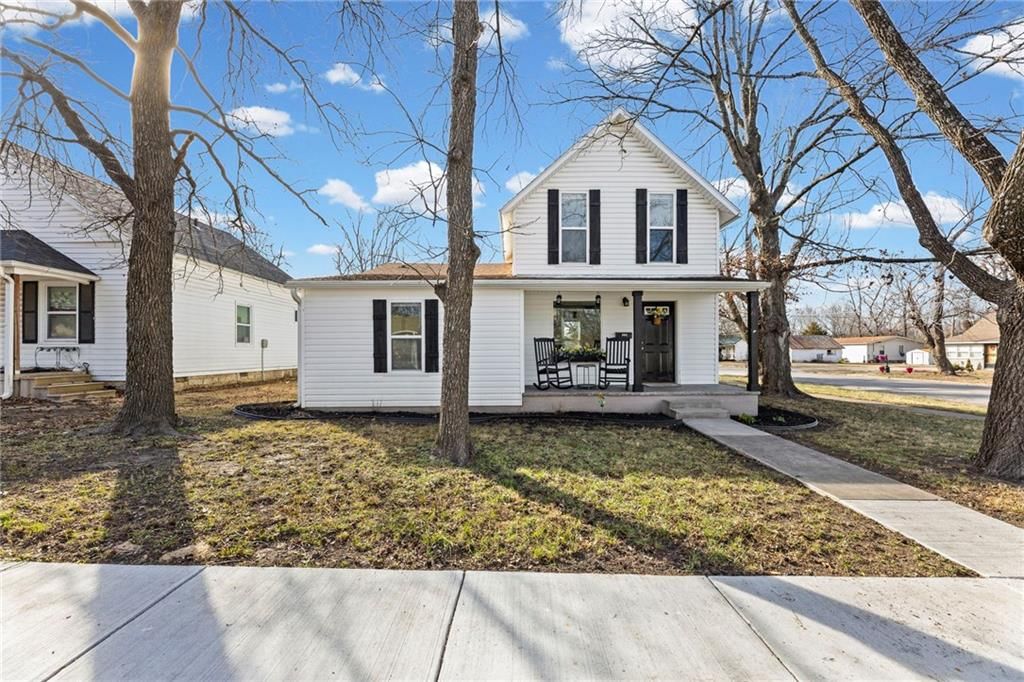


602 Horton Street, Fort Scott, KS
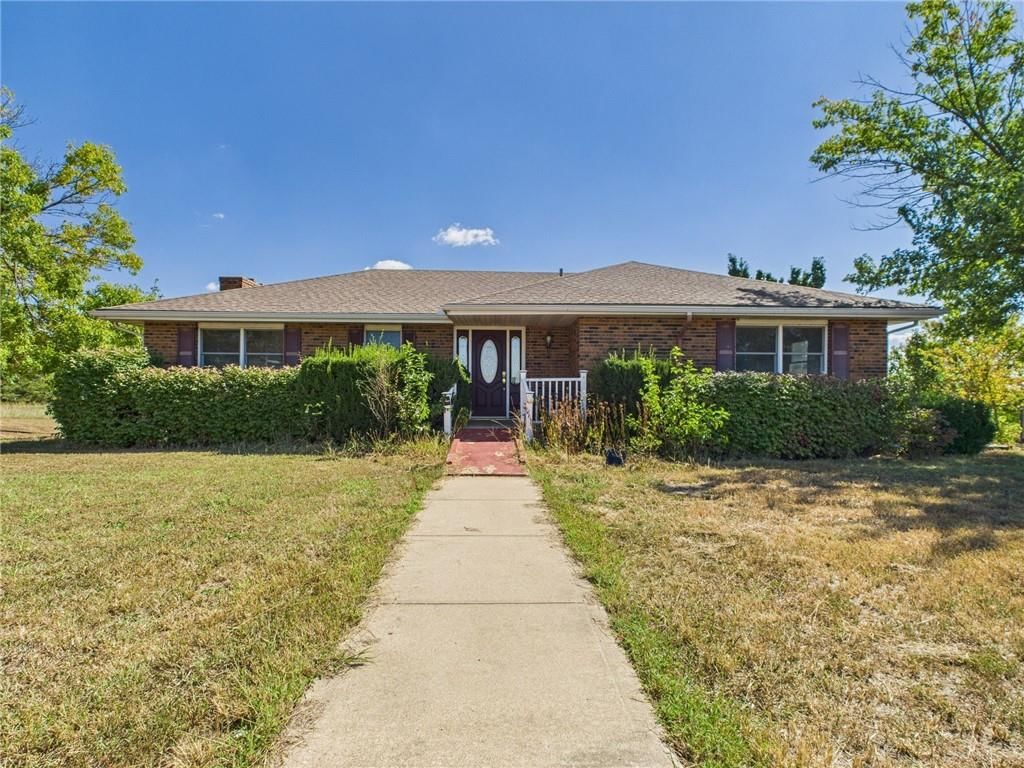


1345 165th Street, Fort Scott, KS
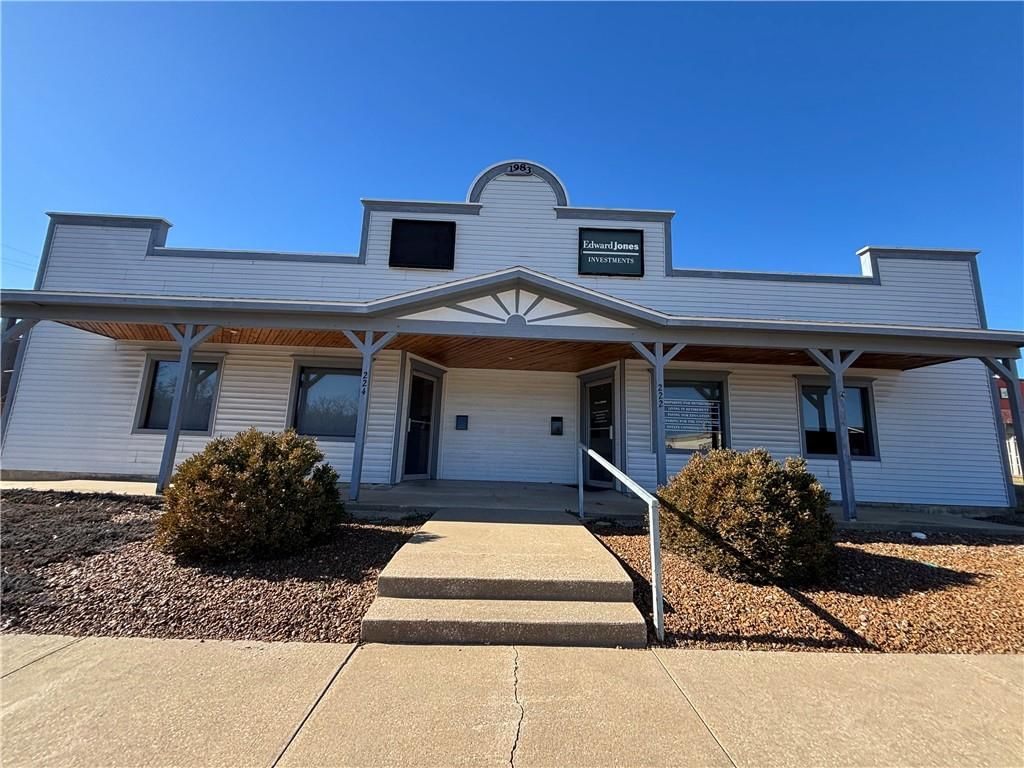
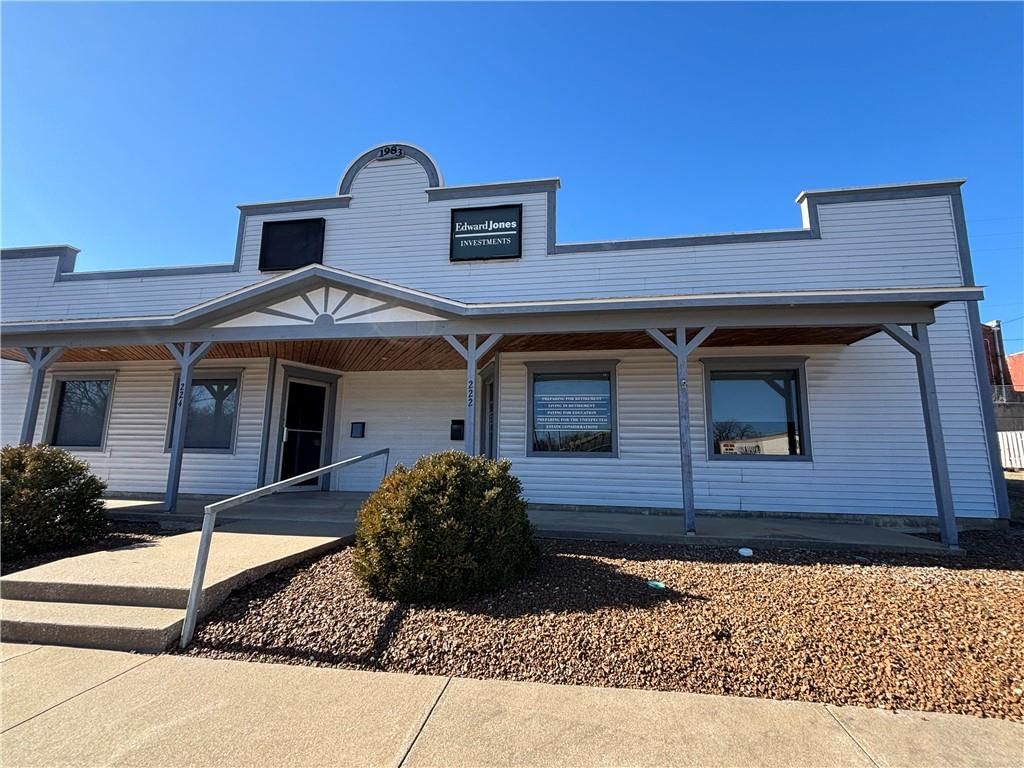
322-324 S State Street, Fort Scott, KS
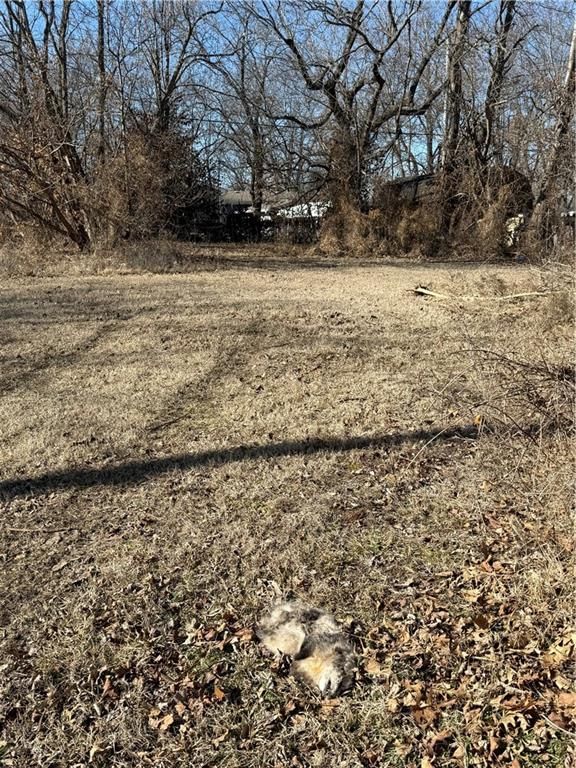


624 S Broadway Street, Fort Scott, KS
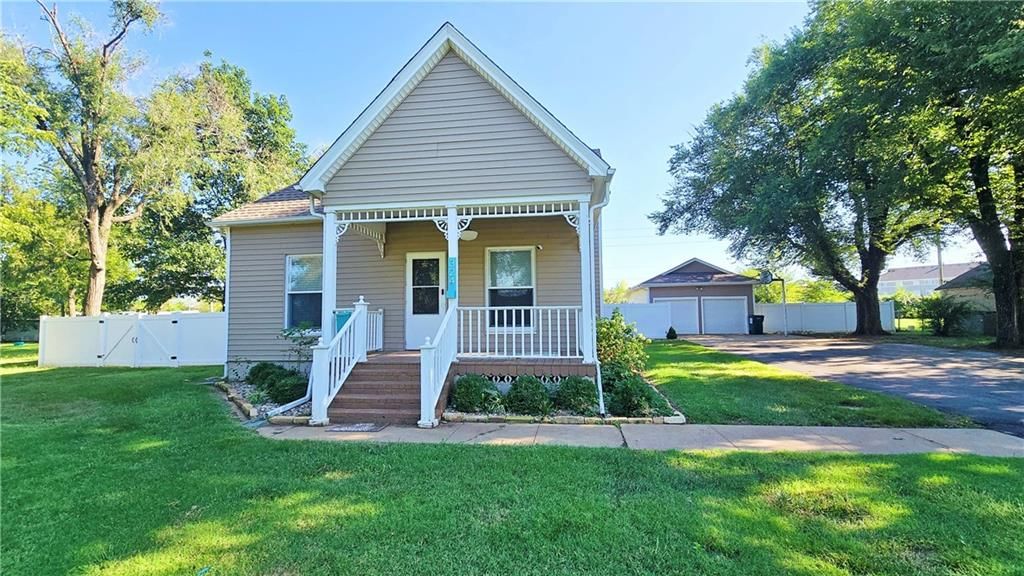

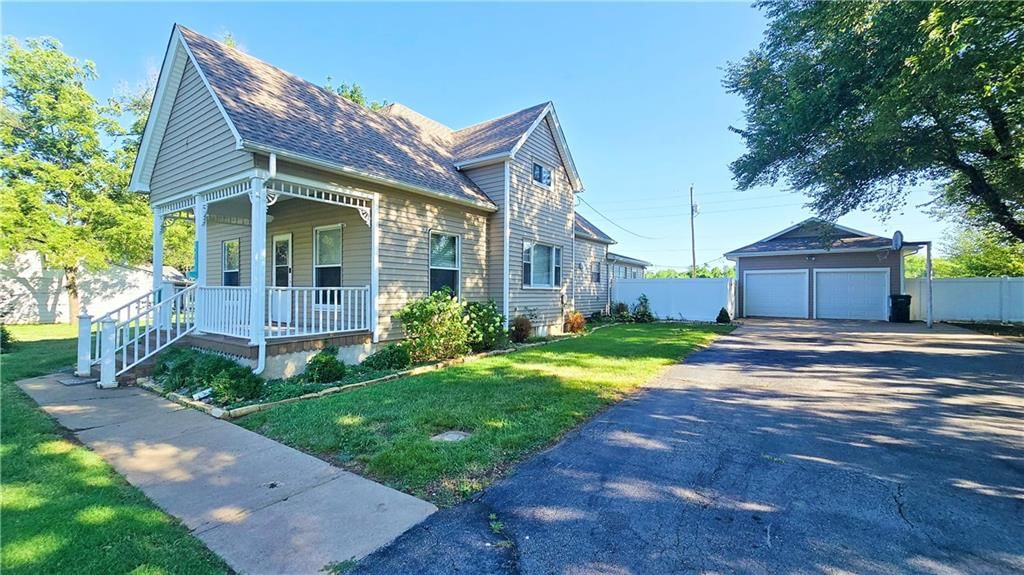
324 W 23rd Street, Fort Scott, KS
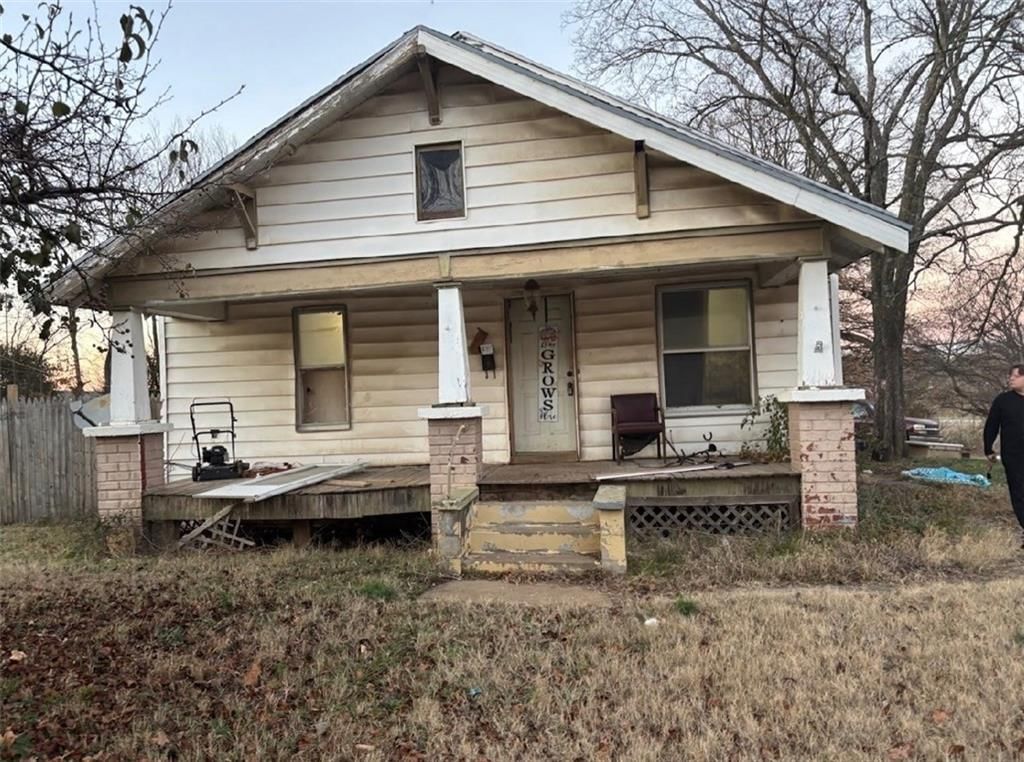

850 State Street, Fort Scott, KS
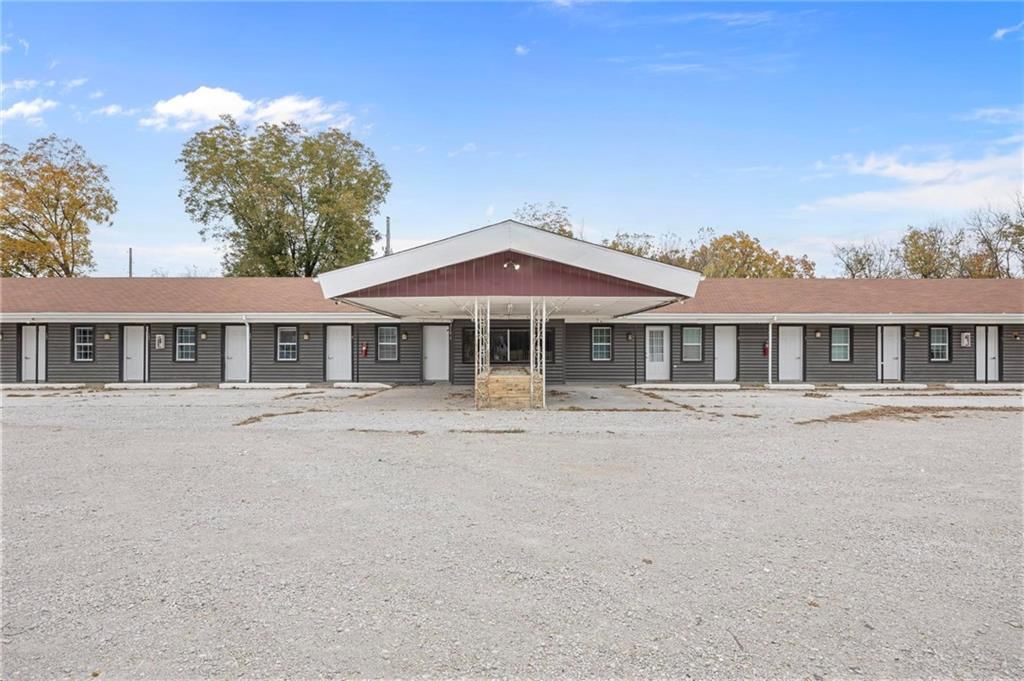


701 N NATIONAL Avenue, Fort Scott, KS
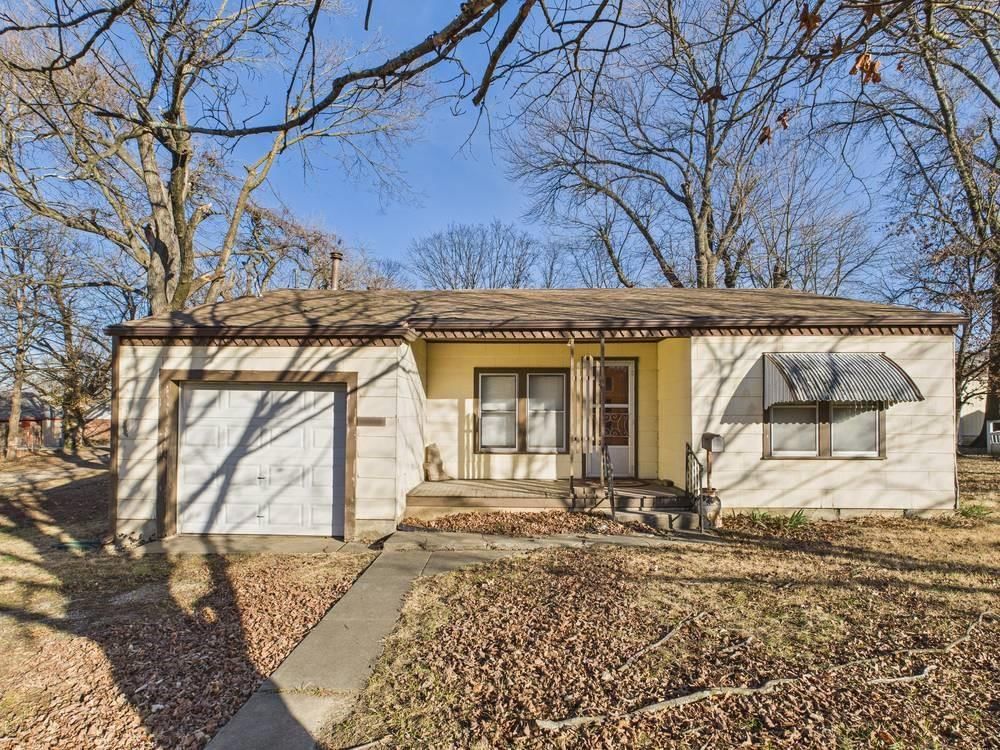


1227 S Crawford Street, Fort Scott, KS
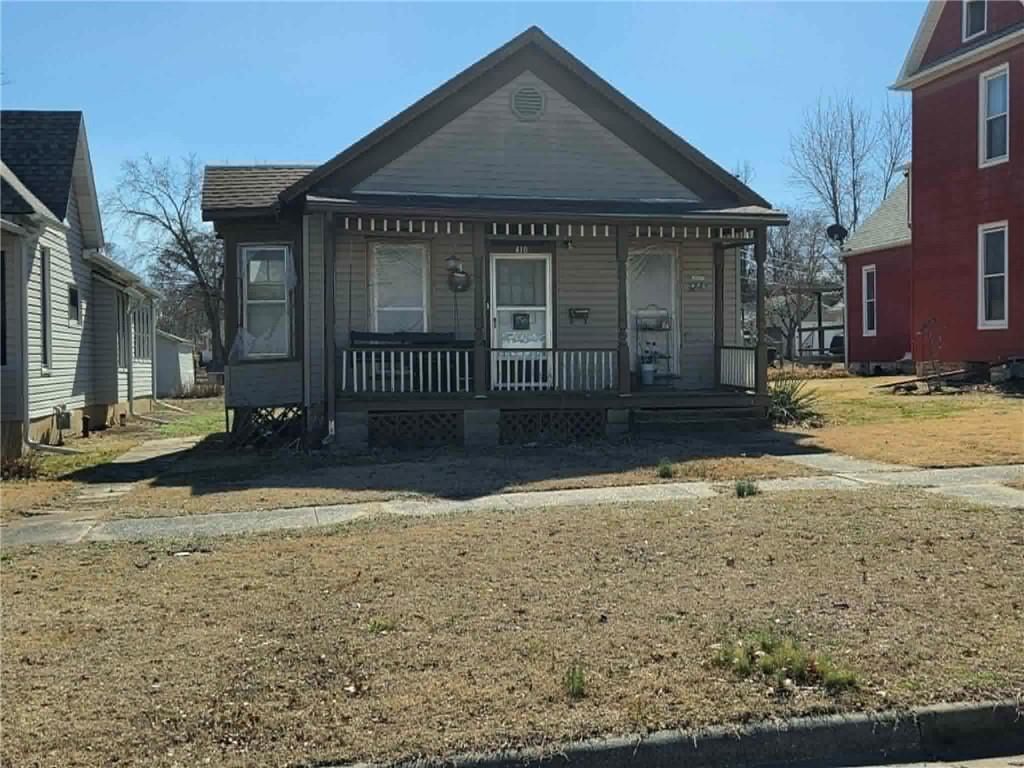

410 W 8th Street, Fort Scott, KS
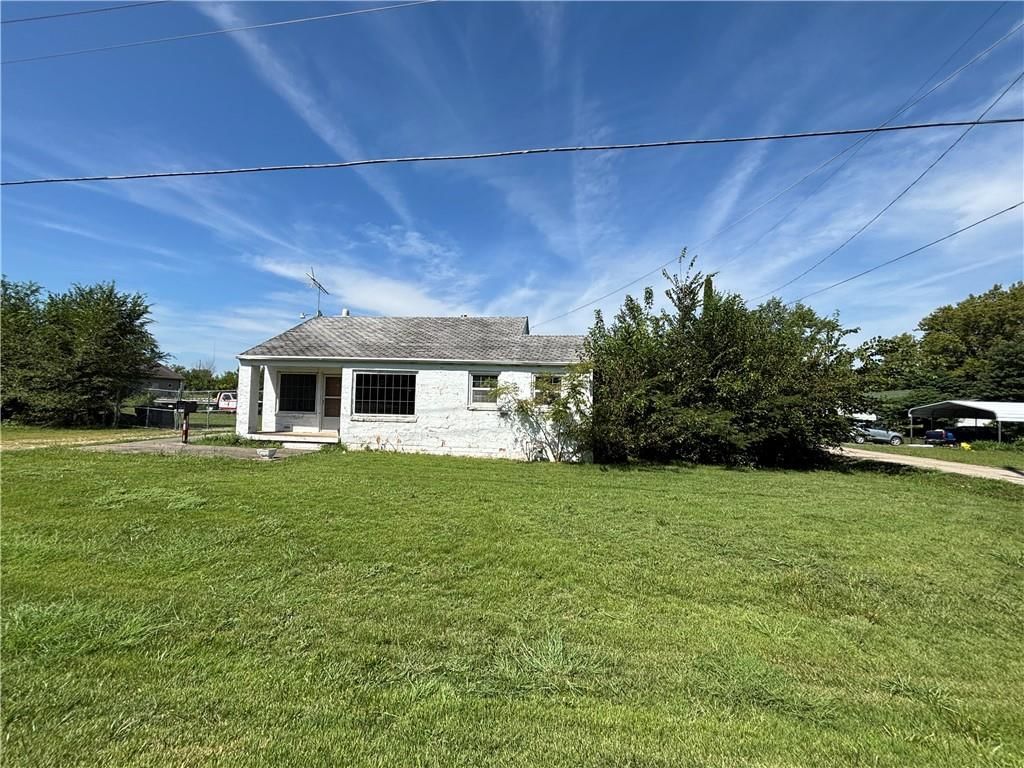


1812 S Margrave Street, Fort Scott, KS
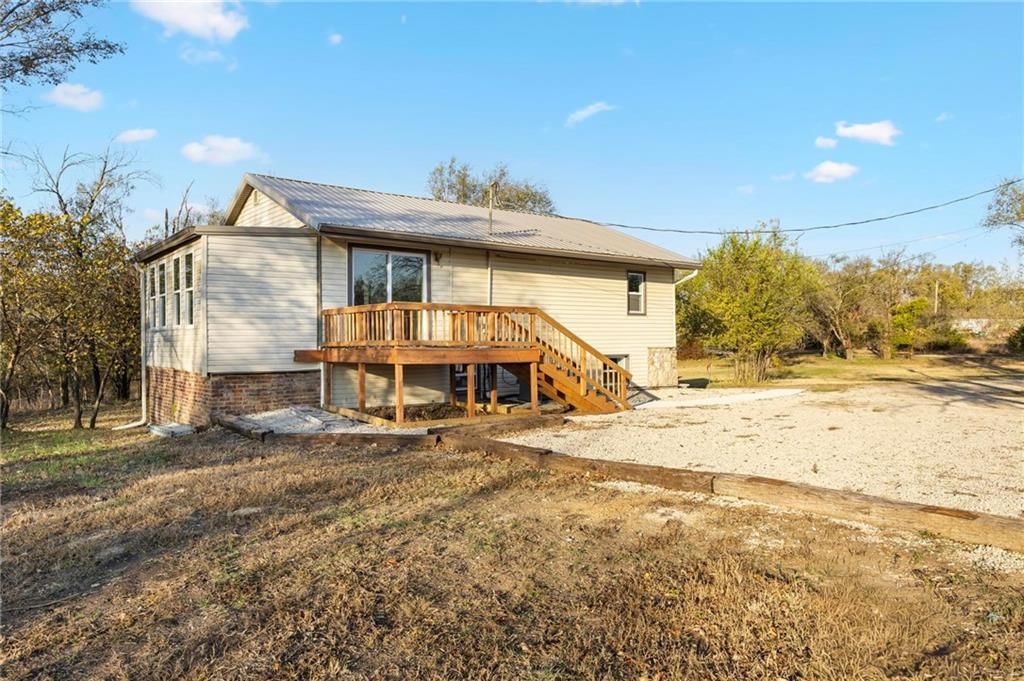

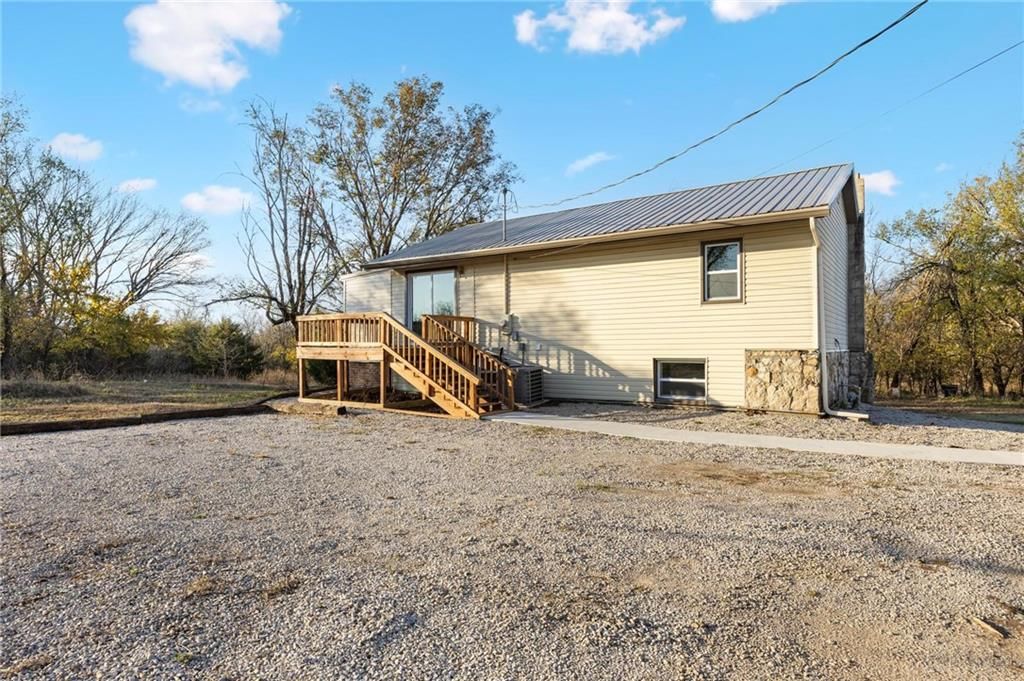
1233 235th Street, Fort Scott, KS
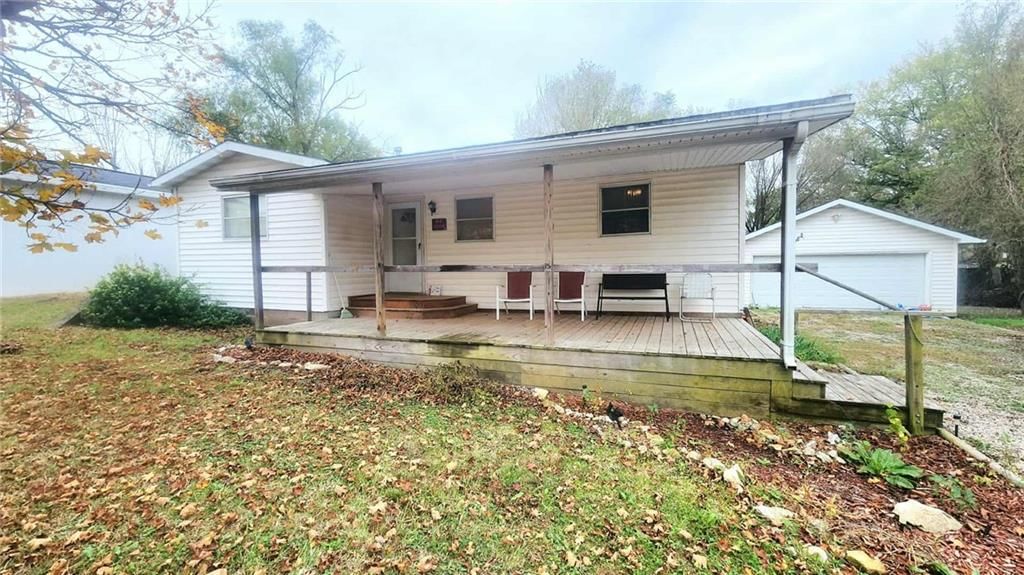


1570 Redbud Street, Fort Scott, KS
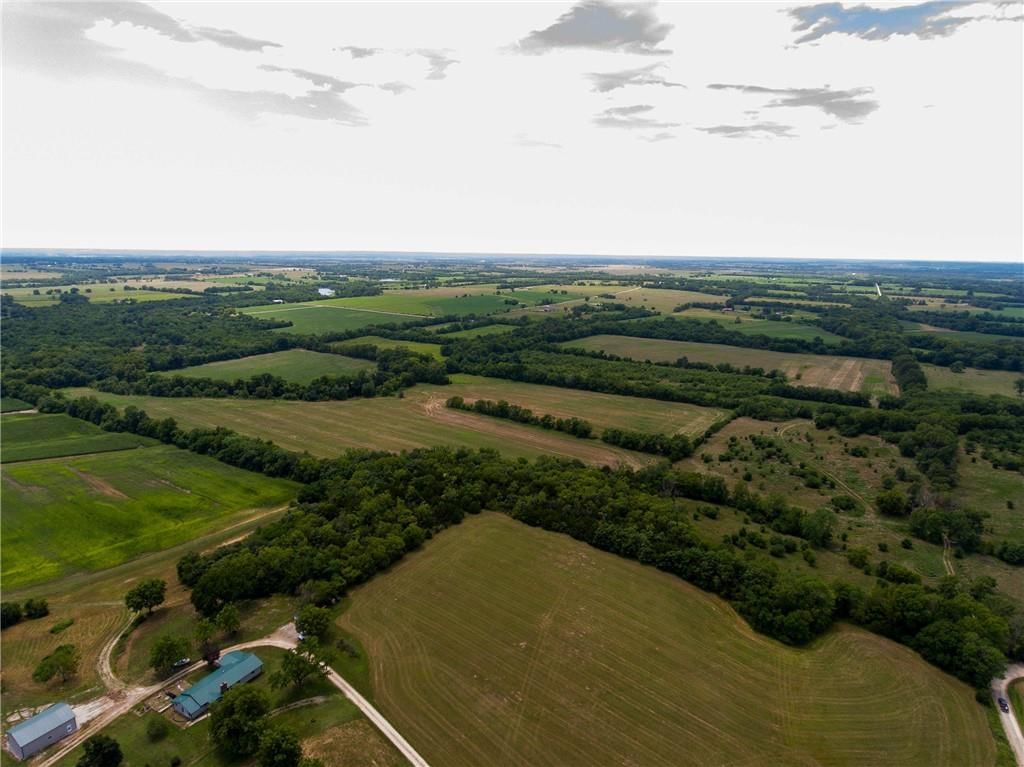

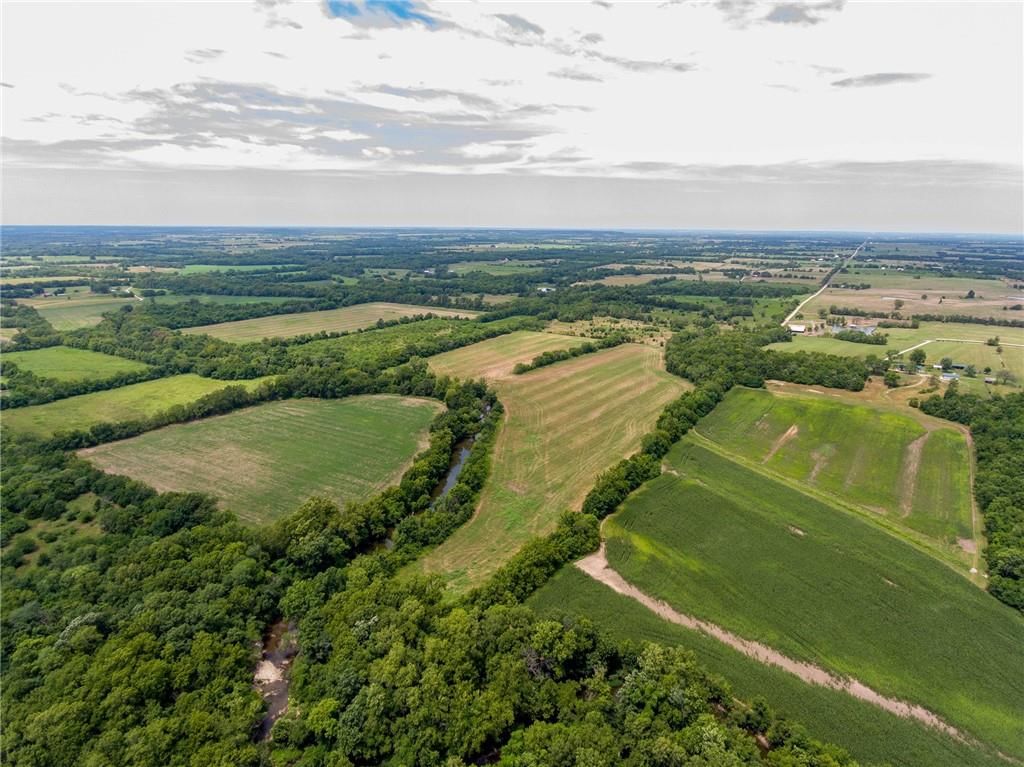
00 Prairie Road, Fort Scott, KS
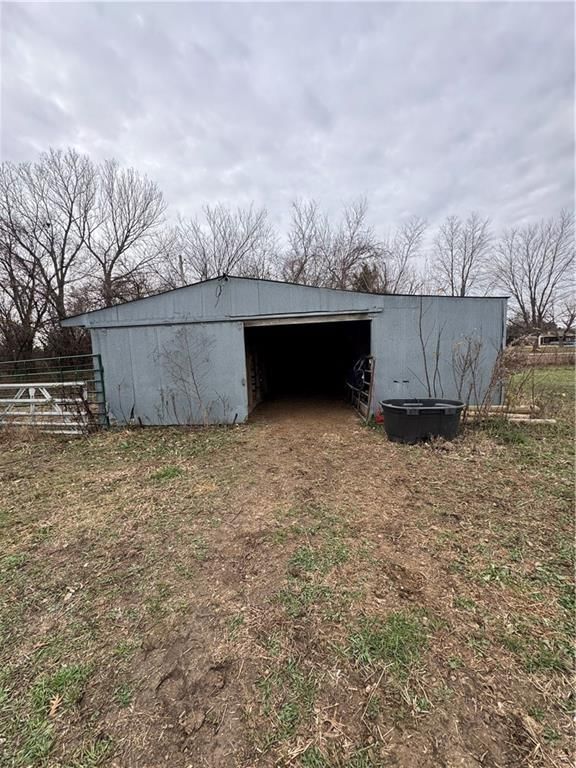


1696 Maple Road, Fort Scott, KS
Popular home searchesin Kansas City
How we compute these
- For sale.
- Homes listed as active right now. A live count, not a monthly average.
Homes by pricein Kansas City
How we compute these
- For sale.
- Homes listed as active right now. A live count, not a monthly average.
NearbyZIP codes
How we compute these
- Market.
- Market type is set by months of supply — how long it would take to sell every home for sale at the current pace. Under ~4 months favors sellers (low inventory, faster sales, homes near or above asking); over ~6 favors buyers (more choice, more negotiating room). 4–6 is balanced.
- Months supply.
- How many months it would take to sell every home now for sale at the pace of the last 90 days: homes for sale ÷ (closings in the last 90 days ÷ 3).
- Median list.
- The middle asking price among the homes for sale right now. Half are listed above it, half below.
- Days to contract.
- The middle number of days between a home being listed and going under contract, over the last 90 days of closings. It is not days-to-close, and it is not how long today's listings have been sitting. Newly built homes are excluded, because a build finishing is not a market moving.
- For sale.
- Homes listed as active right now. A live count, not a monthly average.
- Coming soon.
- Homes announced but not yet accepting showings. A live count.
- Under contract.
- Homes with an accepted contract that have not closed yet. A live count.
Search homes for salein every city we cover
How we compute these
- Market.
- Market type is set by months of supply — how long it would take to sell every home for sale at the current pace. Under ~4 months favors sellers (low inventory, faster sales, homes near or above asking); over ~6 favors buyers (more choice, more negotiating room). 4–6 is balanced.
- Months supply.
- How many months it would take to sell every home now for sale at the pace of the last 90 days: homes for sale ÷ (closings in the last 90 days ÷ 3).
- Median list.
- The middle asking price among the homes for sale right now. Half are listed above it, half below.
- Days to contract.
- The middle number of days between a home being listed and going under contract, over the last 90 days of closings. It is not days-to-close, and it is not how long today's listings have been sitting. Newly built homes are excluded, because a build finishing is not a market moving.
- For sale.
- Homes listed as active right now. A live count, not a monthly average.
- Coming soon.
- Homes announced but not yet accepting showings. A live count.
- Under contract.
- Homes with an accepted contract that have not closed yet. A live count.
Search for homesin popular markets
| Market | For sale |
|---|---|
| Heritage Ranch | 28 |
| Canyon Lakes | 25 |
| Ruskin Heights | 24 |
| Garrett Ranch | 24 |
| Tomahawk Valley | 23 |
| Seven Bridges | 23 |
How we compute these
- Market.
- Market type is set by months of supply — how long it would take to sell every home for sale at the current pace. Under ~4 months favors sellers (low inventory, faster sales, homes near or above asking); over ~6 favors buyers (more choice, more negotiating room). 4–6 is balanced.
- For sale.
- Homes listed as active right now. A live count, not a monthly average.
Search homesby county
How we compute these
- Market.
- Market type is set by months of supply — how long it would take to sell every home for sale at the current pace. Under ~4 months favors sellers (low inventory, faster sales, homes near or above asking); over ~6 favors buyers (more choice, more negotiating room). 4–6 is balanced.
- Months supply.
- How many months it would take to sell every home now for sale at the pace of the last 90 days: homes for sale ÷ (closings in the last 90 days ÷ 3).
- Median list.
- The middle asking price among the homes for sale right now. Half are listed above it, half below.
- Days to contract.
- The middle number of days between a home being listed and going under contract, over the last 90 days of closings. It is not days-to-close, and it is not how long today's listings have been sitting. Newly built homes are excluded, because a build finishing is not a market moving.
- For sale.
- Homes listed as active right now. A live count, not a monthly average.
- Coming soon.
- Homes announced but not yet accepting showings. A live count.
- Under contract.
- Homes with an accepted contract that have not closed yet. A live count.