
Homes on a Cul-de-Sac for Sale in Cass County, MO
51 homes fit this search · Sorted by Newest Listed


702 Andy Court, Belton, MO
New · 1d ago

1715 Overbrook Lane, Raymore, MO
New · 2d ago


300 Hawthorne Court, Belton, MO
New · 2d ago


1201 Serenity Court, Raymore, MO
New · 2d ago


304 SW Green Teal Street, Lee's Summit, MO
New · 3d ago


817 Shane Court, Belton, MO
New · 4d ago


50 Hever Knoll, Loch Lloyd, MO
New · 5d ago


21535 Carrara Circle, Peculiar, MO
New · 6d ago


21800 Vinci Circle, Peculiar, MO
New · 6d ago


1301 Saddle Court, Raymore, MO


910 Sweet Cherry Place, Belton, MO


1704 Wildhorse Court, Raymore, MO


808 Glenn Circle, Raymore, MO


806 Glenn Circle, Raymore, MO


180 Hever Knoll, Loch Lloyd, MO


1702 Goose Creek Court, Raymore, MO


21531 Carrara Circle, Peculiar, MO


12100 Canna Court, Peculiar, MO


906 Fairview Circle, Pleasant Hill, MO

1401 Upton Court, Raymore, MO


124 Teton Ridge, Lake Winnebago, MO


2509 JONES RANCH Parkway, Harrisonville, MO


16912 E 170th Court, Belton, MO
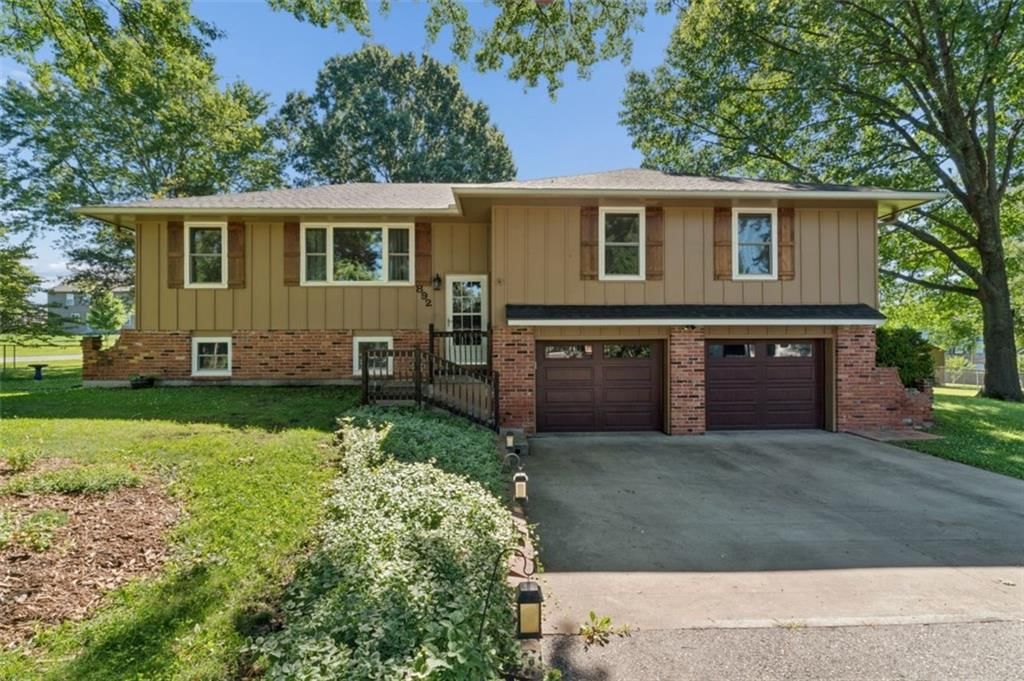

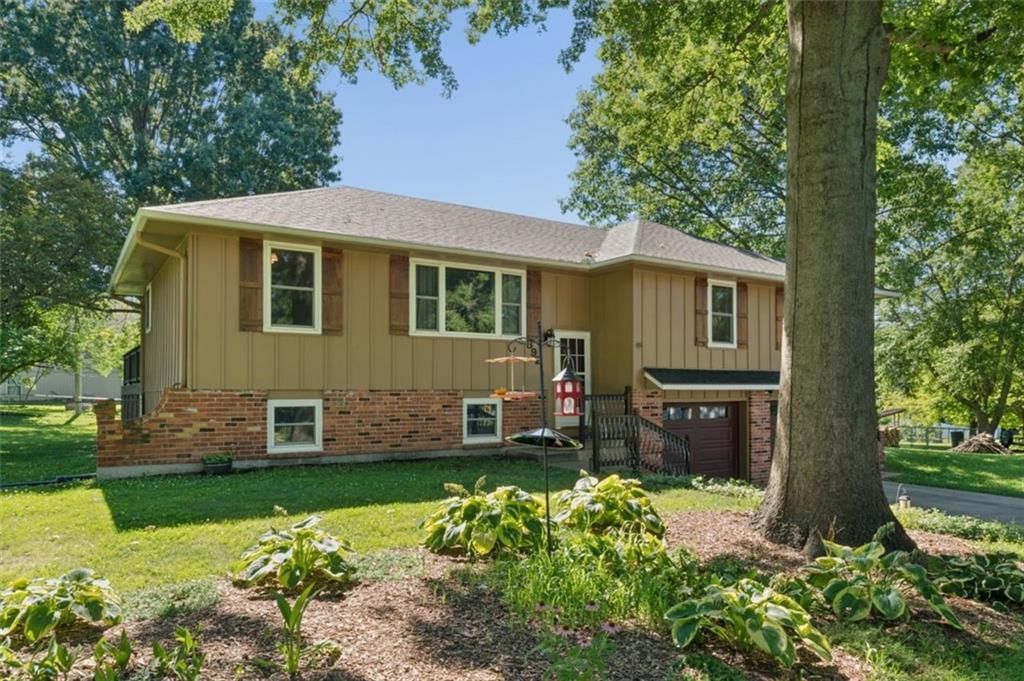
892 Gregory Street, Peculiar, MO
About Homes with Cul-de-sac in Cass County, MO
Cass County, MO has 51 homes with cul-de-sac for sale right now, with a median list price of $364,900 as of Sep 20 These homes with cul-de-sac were built between 1975 and 2026, ranging from 1,231 to 7,091 square feet.
Homes with Cul-de-sac market trends Cass County, MO
Cass County, MO: 592 homes for sale · 33 new in the last 7 days · median asking $365,000 · 217 price reductions · a median of 23 days to contract. 139 homes closed in the last 30 days, at a median of $350,000. At the pace of the last 90 days that is 3.53 months of supply.
| Measure | Aug 2026 |
|---|---|
| Median sale price | $367,500 |
| Median price per sq ft | $183 |
| Median days to contract | 22 |
| Sell-to-list ratio | 100% |
| Homes sold | 170 |
| New listings | 235 |
| Went under contract | 163 |
Homes with Cul-de-sac FAQs Cass County, MO
How many homes with cul-de-sac are for sale in Cass County, MO?
What is the median list price of homes with cul-de-sac in Cass County, MO?
Schools serving Cass County
| School | Median list | |
|---|---|---|
| School districts | ||
| Raymore-Peculiar School District | $414,990 | |
| Belton School District | $385,000 | |
| Pleasant Hill School District | $329,900 | |
| Harrisonville School District | $275,000 | |
| Sherwood School District | $225,010 | |
| Archie School District | $339,000 | |
| Cass-Midway School District | $299,000 | |
| East Lynne School District | Median— | |
| Lee's Summit School District | Median— | |
| Drexel School District | Median— | |
| Strasburg School District | Median— | |
| High schools | ||
| Raymore-Peculiar | $423,385 | |
How we compute these
- Median list.
- The middle asking price among the homes for sale right now. Half are listed above it, half below.
- For sale.
- Homes listed as active right now. A live count, not a monthly average.
Newly listed in Cass County, MO
| Address | Price |
|---|---|
| 14806 E 200th Street | Price$499,500 |
| 119 & 121 E Main Street | Price$38,000 |
| 105 Spruce Street | Price$295,000 |
| 702 Andy Court | Price$414,500 |
| 100 E South Avenue | Price$350,000 |
| 23805 S Scottsdale Drive | Price$499,900 |
| 1304 Larkspur Place | Price$699,900 |
| 1226 Larkspur Place | Price$669,900 |
| 22010 S Excelsior Road | Price$925,000 |
| 501 Ohio Street | Price$299,900 |
| 300 Hawthorne Court | Price$299,000 |
| 8004 E 233rd Street | Price$650,000 |
Recently went under contract in Cass County, MO
| Address | List price |
|---|---|
| 504 Younger Drive | List price$270,000 |
| 509 Indian Trail | List price$189,900 |
| 1101 S Highland Drive | List price$215,000 |
| 903 Silver Lake Circle | List price$378,900 |
| 1915 Meadowlark Drive | List price$375,000 |
| 201-203 Brookridge Drive | List price$300,000 |
| 712 Shishir Road | List price$325,000 |
| Independence Street | List price$126,000 |
| 705 Solstice Circle | List price$386,990 |
| 3308 E 303rd Street | List price$475,000 |
| 730 E Cambridge Road | List price$425,000 |
| 1804 WINCHESTER Drive | List price$405,000 |
How we compute these
- Under contract.
- Homes with an accepted contract that have not closed yet. A live count.
- Days to contract.
- The middle number of days between a home being listed and going under contract, over the last 90 days of closings. It is not days-to-close, and it is not how long today's listings have been sitting. Newly built homes are excluded, because a build finishing is not a market moving.
Popular home searches in Cass County
| Search | For sale |
|---|---|
| Open houses | 8 |
| Luxury homes | 50 |
| Just listed homes | 51 |
| Price-reduced homes | 217 |
| Coming soon homes | 36 |
| Homes under contract | 267 |
How we compute these
- For sale.
- Homes listed as active right now. A live count, not a monthly average.
Homes by price in Cass County
How we compute these
- For sale.
- Homes listed as active right now. A live count, not a monthly average.
Homes by feature in Cass County
How we compute these
- For sale.
- Homes listed as active right now. A live count, not a monthly average.
Search by property type in Cass County
| Property type | Median sale |
|---|---|
| Single Family | $356,000 |
| Townhouse | Median— |
| Villa | Median— |
| Half Duplex | Median— |
| Duplex | Median— |
| Quadruplex | Median— |
| Lots / Land | $199,999 |
How we compute these
- Market.
- Market type is set by months of supply — how long it would take to sell every home for sale at the current pace. Under ~4 months favors sellers (low inventory, faster sales, homes near or above asking); over ~6 favors buyers (more choice, more negotiating room). 4–6 is balanced.
- Months supply.
- How many months it would take to sell every home now for sale at the pace of the last 90 days: homes for sale ÷ (closings in the last 90 days ÷ 3).
- For sale.
- Homes listed as active right now. A live count, not a monthly average.
- Days to contract.
- The middle number of days between a home being listed and going under contract, over the last 90 days of closings. It is not days-to-close, and it is not how long today's listings have been sitting. Newly built homes are excluded, because a build finishing is not a market moving.
- Coming soon.
- Homes announced but not yet accepting showings. A live count.
- Under contract.
- Homes with an accepted contract that have not closed yet. A live count.
Search homes in Cass County
| City | Median list |
|---|---|
| Raymore | $400,190 |
| Belton | $335,000 |
| Pleasant Hill | $295,000 |
| Harrisonville | $282,000 |
| Peculiar | $378,000 |
| Lee's Summit | $530,000 |
How we compute these
- Market.
- Market type is set by months of supply — how long it would take to sell every home for sale at the current pace. Under ~4 months favors sellers (low inventory, faster sales, homes near or above asking); over ~6 favors buyers (more choice, more negotiating room). 4–6 is balanced.
- Months supply.
- How many months it would take to sell every home now for sale at the pace of the last 90 days: homes for sale ÷ (closings in the last 90 days ÷ 3).
- Median list.
- The middle asking price among the homes for sale right now. Half are listed above it, half below.
- Days to contract.
- The middle number of days between a home being listed and going under contract, over the last 90 days of closings. It is not days-to-close, and it is not how long today's listings have been sitting. Newly built homes are excluded, because a build finishing is not a market moving.
- For sale.
- Homes listed as active right now. A live count, not a monthly average.
- Coming soon.
- Homes announced but not yet accepting showings. A live count.
- Under contract.
- Homes with an accepted contract that have not closed yet. A live count.
ZIP codes in Cass County
How we compute these
- Market.
- Market type is set by months of supply — how long it would take to sell every home for sale at the current pace. Under ~4 months favors sellers (low inventory, faster sales, homes near or above asking); over ~6 favors buyers (more choice, more negotiating room). 4–6 is balanced.
- Months supply.
- How many months it would take to sell every home now for sale at the pace of the last 90 days: homes for sale ÷ (closings in the last 90 days ÷ 3).
- Median list.
- The middle asking price among the homes for sale right now. Half are listed above it, half below.
- Days to contract.
- The middle number of days between a home being listed and going under contract, over the last 90 days of closings. It is not days-to-close, and it is not how long today's listings have been sitting. Newly built homes are excluded, because a build finishing is not a market moving.
- For sale.
- Homes listed as active right now. A live count, not a monthly average.
- Coming soon.
- Homes announced but not yet accepting showings. A live count.
- Under contract.
- Homes with an accepted contract that have not closed yet. A live count.
Search homes for sale in every city we cover
How we compute these
- Market.
- Market type is set by months of supply — how long it would take to sell every home for sale at the current pace. Under ~4 months favors sellers (low inventory, faster sales, homes near or above asking); over ~6 favors buyers (more choice, more negotiating room). 4–6 is balanced.
- Months supply.
- How many months it would take to sell every home now for sale at the pace of the last 90 days: homes for sale ÷ (closings in the last 90 days ÷ 3).
- Median list.
- The middle asking price among the homes for sale right now. Half are listed above it, half below.
- Days to contract.
- The middle number of days between a home being listed and going under contract, over the last 90 days of closings. It is not days-to-close, and it is not how long today's listings have been sitting. Newly built homes are excluded, because a build finishing is not a market moving.
- For sale.
- Homes listed as active right now. A live count, not a monthly average.
- Coming soon.
- Homes announced but not yet accepting showings. A live count.
- Under contract.
- Homes with an accepted contract that have not closed yet. A live count.
Search for homes in popular markets
| Market | For sale |
|---|---|
| Heritage Ranch | 29 |
| Canyon Lakes | 25 |
| Ruskin Heights | 25 |
| Garrett Ranch | 24 |
| Seven Bridges | 23 |
| Tomahawk Valley | 23 |
How we compute these
- Market.
- Market type is set by months of supply — how long it would take to sell every home for sale at the current pace. Under ~4 months favors sellers (low inventory, faster sales, homes near or above asking); over ~6 favors buyers (more choice, more negotiating room). 4–6 is balanced.
- For sale.
- Homes listed as active right now. A live count, not a monthly average.
Or go wider still county, metro and state
How we compute these
- Market.
- Market type is set by months of supply — how long it would take to sell every home for sale at the current pace. Under ~4 months favors sellers (low inventory, faster sales, homes near or above asking); over ~6 favors buyers (more choice, more negotiating room). 4–6 is balanced.
- Months supply.
- How many months it would take to sell every home now for sale at the pace of the last 90 days: homes for sale ÷ (closings in the last 90 days ÷ 3).
- Median list.
- The middle asking price among the homes for sale right now. Half are listed above it, half below.
- Days to contract.
- The middle number of days between a home being listed and going under contract, over the last 90 days of closings. It is not days-to-close, and it is not how long today's listings have been sitting. Newly built homes are excluded, because a build finishing is not a market moving.
- For sale.
- Homes listed as active right now. A live count, not a monthly average.
- Coming soon.
- Homes announced but not yet accepting showings. A live count.
- Under contract.
- Homes with an accepted contract that have not closed yet. A live count.