
Real Estate & Homes For Sale
242 homes fit this search · Sorted by Newest Listed


891 S Clearwater Creek Drive, Olathe, KS
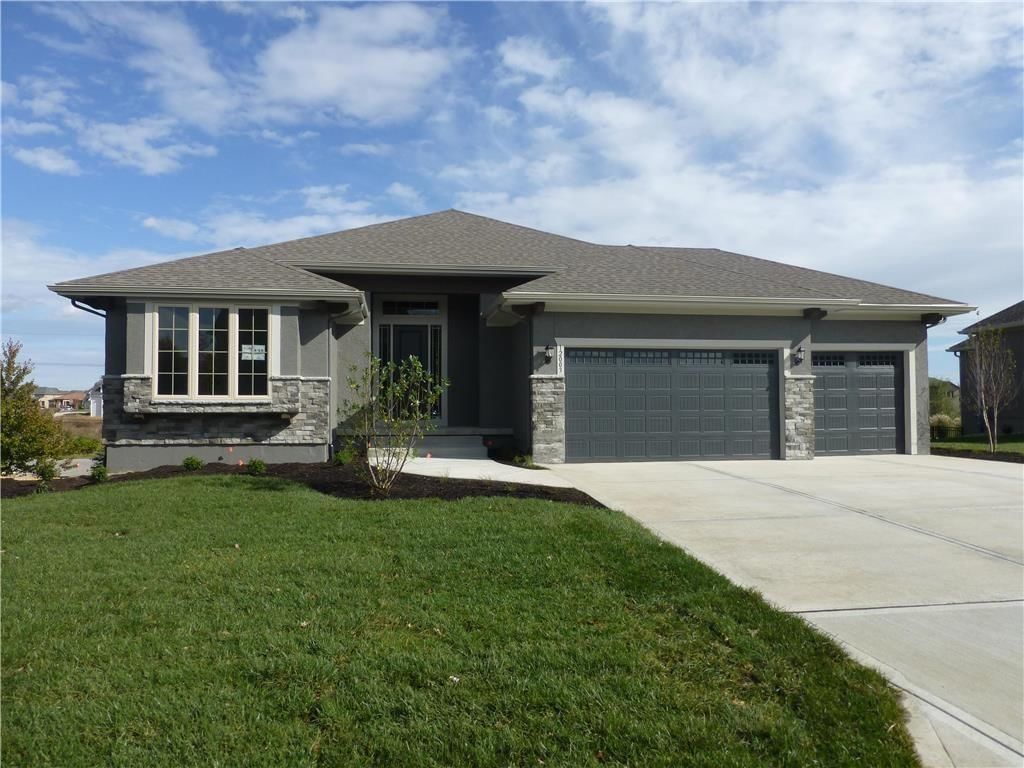


12496 S Barth Road, Olathe, KS


22364 W 90th Terrace, Lenexa, KS


23910 W 112th Terrace, Olathe, KS


16683 S Allman Road, Olathe, KS


336 E Park Street, Olathe, KS


414 E Cedar Street, Olathe, KS


1819 S STAGECOACH Drive, Olathe, KS


2275 W Elm Terrace, Olathe, KS


24309 W 91 Place, Lenexa, KS


12975 S Frontier Road, Olathe, KS


No Address W 119th Street, Olathe, KS


22640 W 119th Street, Olathe, KS


25150 W 141st Street, Olathe, KS
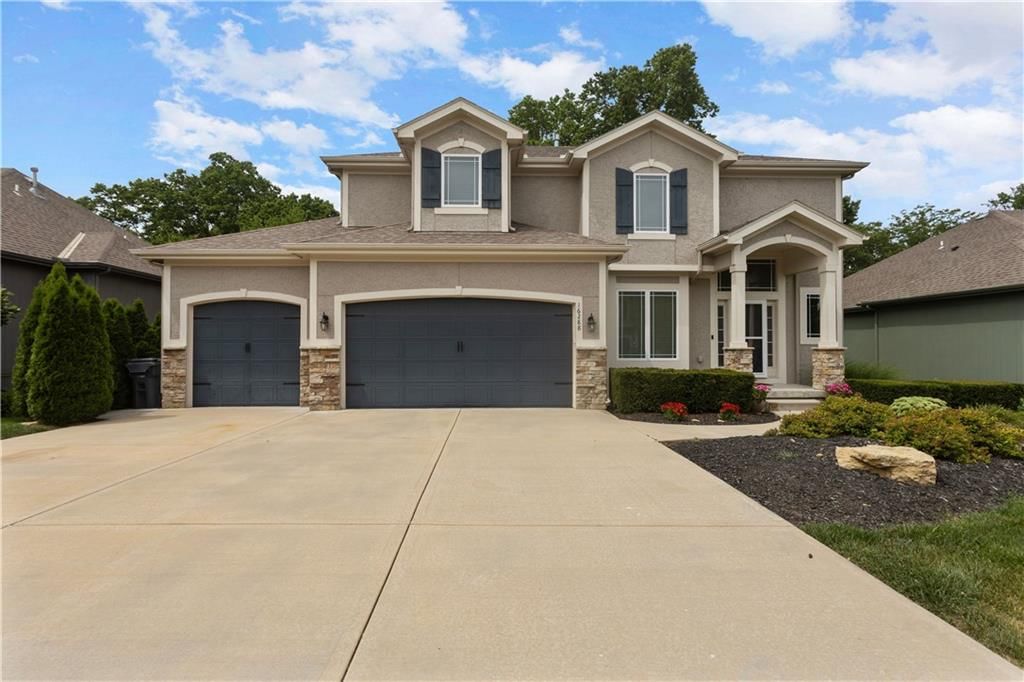


16288 W 171st Street, Olathe, KS
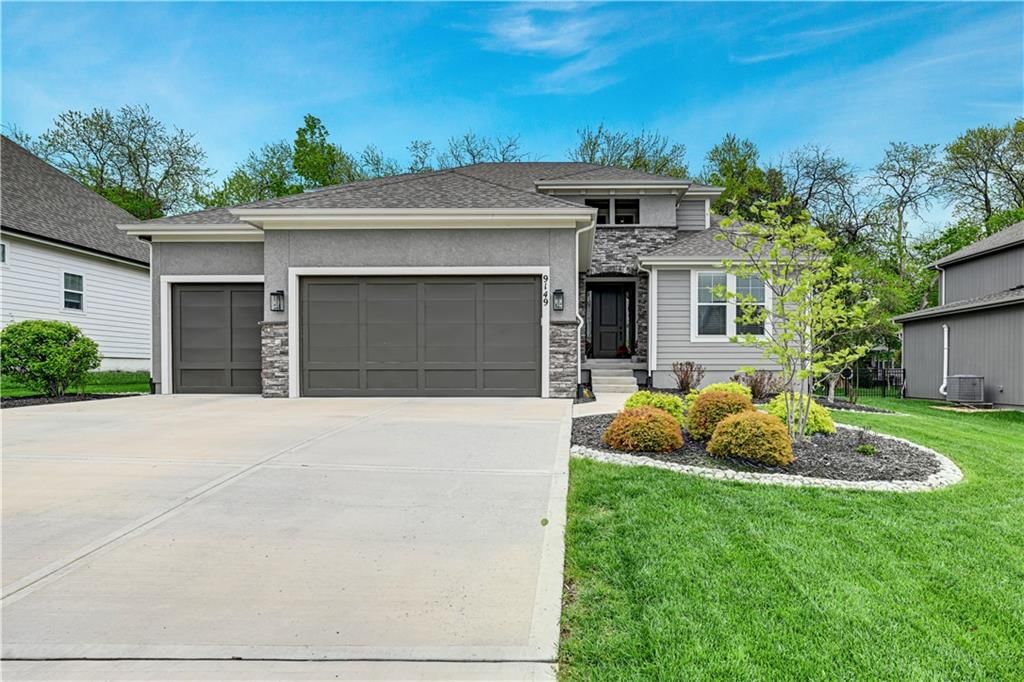


9149 Green Road, Lenexa, KS


25152 W 141st Terrace, Olathe, KS


17218 S Heatherwood Street, Olathe, KS


19317 Skyview Lane, Spring Hill, KS


19324 Mahaffie Street, Spring Hill, KS


25390 W 143rd Street, Olathe, KS


17174 W 164th Terrace, Olathe, KS


16481 S Penrose Lane, Olathe, KS


17132 W 164th Terrace, Olathe, KS
Popular home searches in Kansas City
How we compute these
- For sale.
- Homes listed as active right now. A live count, not a monthly average.
Homes by price in Kansas City
How we compute these
- For sale.
- Homes listed as active right now. A live count, not a monthly average.
Nearby ZIP codes
How we compute these
- Market.
- Market type is set by months of supply — how long it would take to sell every home for sale at the current pace. Under ~4 months favors sellers (low inventory, faster sales, homes near or above asking); over ~6 favors buyers (more choice, more negotiating room). 4–6 is balanced.
- Months supply.
- How many months it would take to sell every home now for sale at the pace of the last 90 days: homes for sale ÷ (closings in the last 90 days ÷ 3).
- Median list.
- The middle asking price among the homes for sale right now. Half are listed above it, half below.
- Days to contract.
- The middle number of days between a home being listed and going under contract, over the last 90 days of closings. It is not days-to-close, and it is not how long today's listings have been sitting. Newly built homes are excluded, because a build finishing is not a market moving.
- For sale.
- Homes listed as active right now. A live count, not a monthly average.
- Coming soon.
- Homes announced but not yet accepting showings. A live count.
- Under contract.
- Homes with an accepted contract that have not closed yet. A live count.
Search homes for sale in every city we cover
How we compute these
- Market.
- Market type is set by months of supply — how long it would take to sell every home for sale at the current pace. Under ~4 months favors sellers (low inventory, faster sales, homes near or above asking); over ~6 favors buyers (more choice, more negotiating room). 4–6 is balanced.
- Months supply.
- How many months it would take to sell every home now for sale at the pace of the last 90 days: homes for sale ÷ (closings in the last 90 days ÷ 3).
- Median list.
- The middle asking price among the homes for sale right now. Half are listed above it, half below.
- Days to contract.
- The middle number of days between a home being listed and going under contract, over the last 90 days of closings. It is not days-to-close, and it is not how long today's listings have been sitting. Newly built homes are excluded, because a build finishing is not a market moving.
- For sale.
- Homes listed as active right now. A live count, not a monthly average.
- Coming soon.
- Homes announced but not yet accepting showings. A live count.
- Under contract.
- Homes with an accepted contract that have not closed yet. A live count.
Search for homes in popular markets
| Market | For sale |
|---|---|
| Heritage Ranch | 28 |
| Canyon Lakes | 27 |
| Seven Bridges | 27 |
| Garrett Ranch | 25 |
| Tomahawk Valley | 22 |
| Ruskin Heights | 22 |
How we compute these
- Market.
- Market type is set by months of supply — how long it would take to sell every home for sale at the current pace. Under ~4 months favors sellers (low inventory, faster sales, homes near or above asking); over ~6 favors buyers (more choice, more negotiating room). 4–6 is balanced.
- For sale.
- Homes listed as active right now. A live count, not a monthly average.
Search homes by county
How we compute these
- Market.
- Market type is set by months of supply — how long it would take to sell every home for sale at the current pace. Under ~4 months favors sellers (low inventory, faster sales, homes near or above asking); over ~6 favors buyers (more choice, more negotiating room). 4–6 is balanced.
- Months supply.
- How many months it would take to sell every home now for sale at the pace of the last 90 days: homes for sale ÷ (closings in the last 90 days ÷ 3).
- Median list.
- The middle asking price among the homes for sale right now. Half are listed above it, half below.
- Days to contract.
- The middle number of days between a home being listed and going under contract, over the last 90 days of closings. It is not days-to-close, and it is not how long today's listings have been sitting. Newly built homes are excluded, because a build finishing is not a market moving.
- For sale.
- Homes listed as active right now. A live count, not a monthly average.
- Coming soon.
- Homes announced but not yet accepting showings. A live count.
- Under contract.
- Homes with an accepted contract that have not closed yet. A live count.