Independence School District in Independence, MO

319 homes for sale in Independence School District · Sorted by Newest Listed

Real estate in Independence, Missouri

Independence, MO has about 51,477 households and a median household income of $60,339. Roughly 61% of homes are owner-occupied, the median owner's home value is $172,900, 22% of adults hold a bachelor's degree or higher. The average commute runs 23.9 minutes. About 121,740 people live in Independence, MO, per the U.S. Census Bureau's American Community Survey 5-year estimate (2020–2024). New construction is still adding supply: 4 building permits were issued in September 2026.

Independence, MO has 423 homes for sale right now, 20 of them coming soon, with a median list price of $225,000. These homes were built between 1840 and 2026. They range from 360 to 64,236 square feet.

This week's Kansas City market report

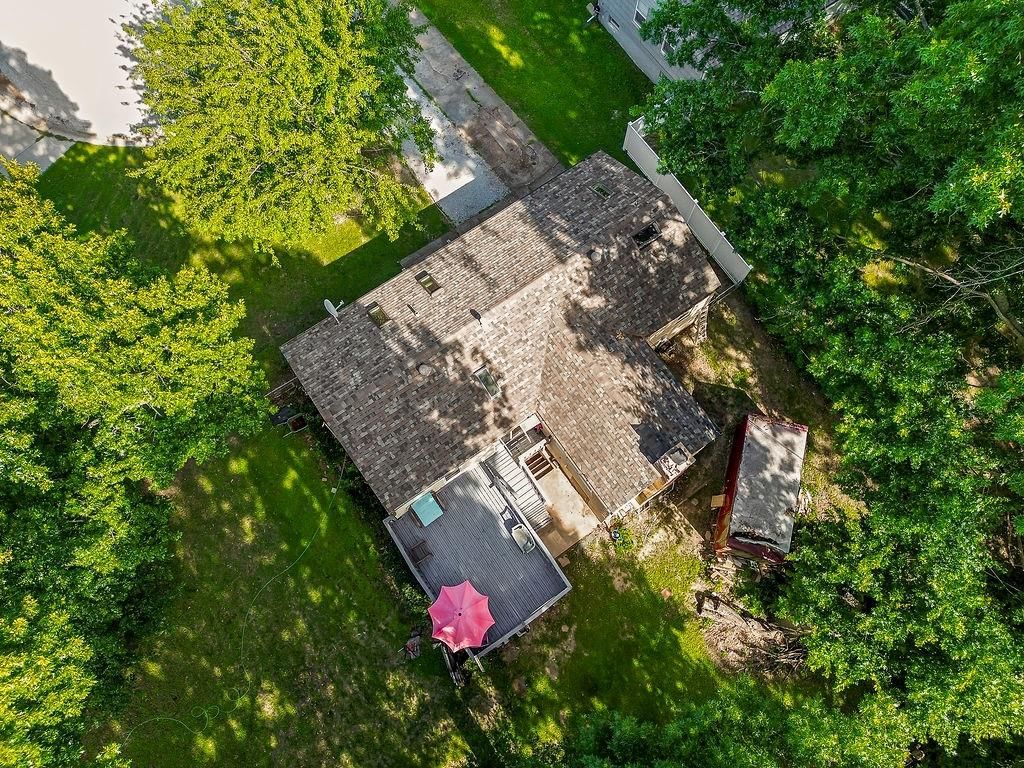
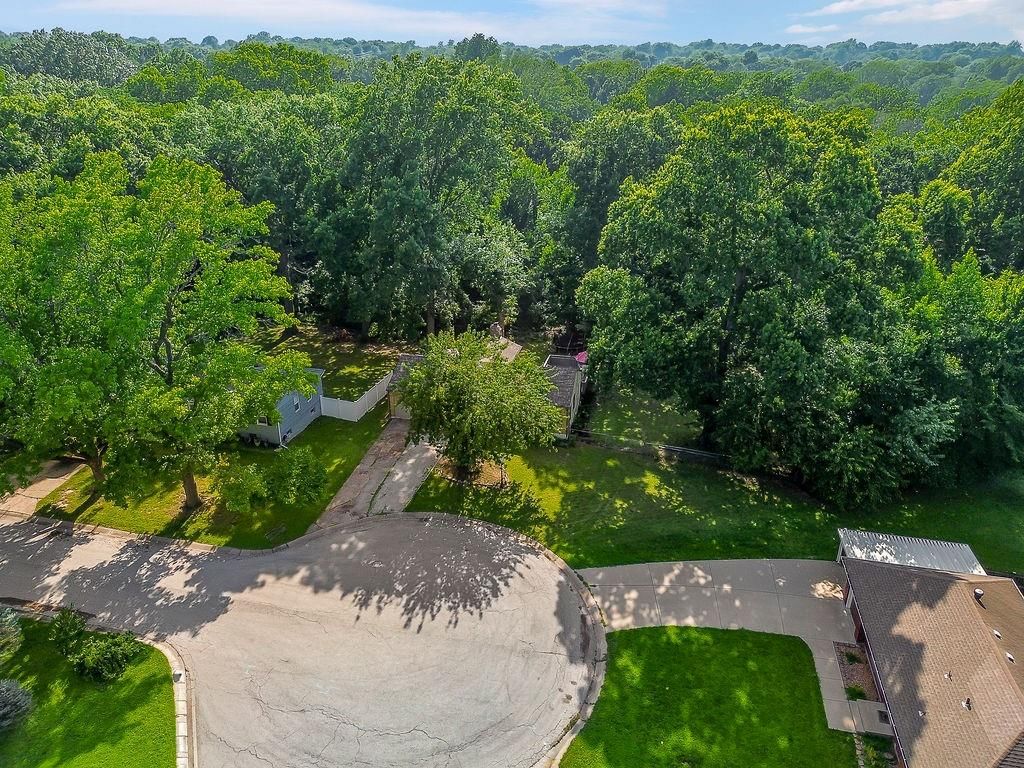
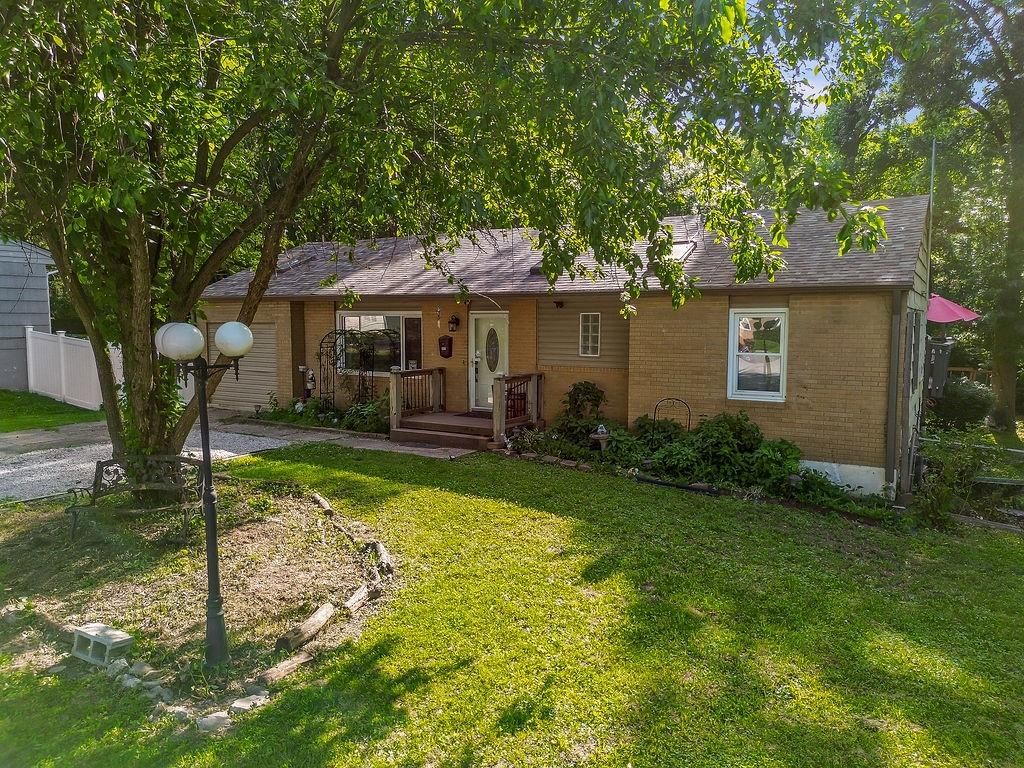
3340 S Crisp Avenue, Independence, MO3340 S Crisp Avenue, Independence, MO: listing photo 23340 S Crisp Avenue, Independence, MO: listing photo 3
36 photos
1+ acre lot
$223,000480d active
3beds|2.5baths|2,384sqft|House for sale
3340 S Crisp Ave, Independence, MO
801 S Butler Lane, Independence, MO801 S Butler Lane, Independence, MO: listing photo 2801 S Butler Lane, Independence, MO: listing photo 3
Price Cut · $233K
$975,000565d active
48.30acres|Land for sale
801 S Butler Ln, Independence, MO
20602 E Truman Road N, Independence, MO20602 E Truman Road N, Independence, MO: listing photo 220602 E Truman Road N, Independence, MO: listing photo 3
5+ acre lot
$800,000565d active
9.65acres|Land for sale
20602 E Truman Rd N, Independence, MO
10305 E Us 40 Highway, Independence, MO10305 E Us 40 Highway, Independence, MO: listing photo 210305 E Us 40 Highway, Independence, MO: listing photo 3
15 photos
Price Cut · $48K
$240,000742d active
33,556sqft lot|Land for sale
10305 E Us 40 Highway, Independence, MO
20300 E US 24 Highway, Independence, MO
5+ acre lot
$290,5501107d active
22.35acres|Land for sale
20300 E US 24 Highway, Independence, MO
10300 E Norledge Avenue, Independence, MO10300 E Norledge Avenue, Independence, MO: listing photo 210300 E Norledge Avenue, Independence, MO: listing photo 3
Price Cut · $40K
$59,9951152d active
Land for sale
10300 E Norledge Ave, Independence, MO
525 N Osage Street, Independence, MO525 N Osage Street, Independence, MO: listing photo 2525 N Osage Street, Independence, MO: listing photo 3
39 photos
Price Cut · $50K
$950,0001173d active
4,080sqft|House for sale
525 N Osage St, Independence, MO
① Independence itself — the place you are on

Homes by price in Independence

Price rangeFor sale
Under $200,000For sale173
Under $300,000For sale303
Under $400,000For sale369
Under $500,000For sale393
How we compute these
For sale.
Homes listed as active right now. A live count, not a monthly average.
② Its neighborhoods — one step out

Nearby neighborhoods to Independence

NeighborhoodMarket (Market type is set by months of supply — how long it would take to sell every home for sale at the current pace. Under ~4 months favors sellers (low inventory, faster sales, homes near or above asking); over ~6 favors buyers (more choice, more negotiating room). 4–6 is balanced.)Months supplyFor saleMedian saleSell-to-listDays to contractComing soonUnder contract
Far View HeightsSeller's ▲2.8 mo14Median$206,000100%16d14
Glendale GardensSeller's2.9 mo8Median$240,000104%24d12
Sycamore HillsStrong Seller's1.6 mo4Median$236,000100%20d05
Kentucky HillsSeller's3.8 mo5Median$189,000101%45d03
FairmountSeller's3.4 mo7Median$128,000102%40d00
How we compute these
Market.
Market type is set by months of supply — how long it would take to sell every home for sale at the current pace. Under ~4 months favors sellers (low inventory, faster sales, homes near or above asking); over ~6 favors buyers (more choice, more negotiating room). 4–6 is balanced.
Months supply.
How many months it would take to sell every home now for sale at the pace of the last 90 days: homes for sale ÷ (closings in the last 90 days ÷ 3).
For sale.
Homes listed as active right now. A live count, not a monthly average.
Days to contract.
The middle number of days between a home being listed and going under contract, over the last 90 days of closings. It is not days-to-close, and it is not how long today's listings have been sitting. Newly built homes are excluded, because a build finishing is not a market moving.
Coming soon.
Homes announced but not yet accepting showings. A live count.
Under contract.
Homes with an accepted contract that have not closed yet. A live count.
③ Nearby cities — two steps out

Search homes nearby Independence

PlaceMarket (Market type is set by months of supply — how long it would take to sell every home for sale at the current pace. Under ~4 months favors sellers (low inventory, faster sales, homes near or above asking); over ~6 favors buyers (more choice, more negotiating room). 4–6 is balanced.)Months supplyMedian listSell-to-listDays to contractFor saleComing soonUnder contract
IndependenceSeller's3.2 moMedian$225,00099%21d42320157
Kansas CitySeller's3.8 moMedian$259,00099%21d2,168103776
Lee's SummitSeller's2.9 moMedian$500,00098%19d43423209
Blue SpringsSeller's2.6 moMedian$389,90099%18d20815116
RaytownSeller's3.3 moMedian$215,00097%23d124539
How we compute these
Market.
Market type is set by months of supply — how long it would take to sell every home for sale at the current pace. Under ~4 months favors sellers (low inventory, faster sales, homes near or above asking); over ~6 favors buyers (more choice, more negotiating room). 4–6 is balanced.
Months supply.
How many months it would take to sell every home now for sale at the pace of the last 90 days: homes for sale ÷ (closings in the last 90 days ÷ 3).
Median list.
The middle asking price among the homes for sale right now. Half are listed above it, half below.
Days to contract.
The middle number of days between a home being listed and going under contract, over the last 90 days of closings. It is not days-to-close, and it is not how long today's listings have been sitting. Newly built homes are excluded, because a build finishing is not a market moving.
For sale.
Homes listed as active right now. A live count, not a monthly average.
Coming soon.
Homes announced but not yet accepting showings. A live count.
Under contract.
Homes with an accepted contract that have not closed yet. A live count.

Real estate FAQs about Independence

How many homes are for sale in Independence?

423 homes are for sale in Independence as of Nov 4, 2026, 20 of them coming soon, plus 157 under contract. The list updates from the Heartland MLS feed through the day.

How much does a home in Independence cost?

The median list price in Independence is $225,000 across the 423 homes for sale, as of Nov 4, 2026.

What is the price per square foot in Independence?

Homes for sale in Independence list at a median of $154 per square foot, as of Nov 4, 2026.

How fast do homes sell in Independence?

Homes in Independence take a median of 21 days to go under contract, as of Nov 4, 2026.

How many homes have sold in Independence in the past year?

1,576 homes have sold in Independence over the last 12 months, as of Nov 4, 2026.

Is Independence a buyer's or seller's market?

Independence has 2.83 months of supply and homes close at 100% of the last list price, as of Nov 4, 2026. Under four months of supply favors sellers.

What does recent activity look like in Independence?

1,576 homes sold in Independence over the last 12 months, and 31 homes were listed in the last 7 days; 112 closed in the last 30 days, as of Nov 4, 2026.

When were the homes in Independence built?

The homes for sale in Independence break down as built 2020 or newer (25), built 2010-2019 (4), built 2000-2009 (21), built 1990-1999 (22), built 1980-1989 (19), built 1970-1979 (42), built 1960-1969 (61), built before 1960 (153).

What are the newest homes for sale in Independence?

25 homes for sale in Independence were built in 2020 or later.

Are there older homes for sale in Independence?

153 of the homes for sale in Independence were built before 1960.

How big are the homes for sale in Independence?

By finished area above grade, they run under 1,500 sq ft (229), 1,500-1,999 sq ft (59), 2,000-2,999 sq ft (39), 3,000-3,999 sq ft (4).

How big are the lots in Independence?

Lot sizes in Independence run under 1/4 acre (242), 1/4 to 1/2 acre (107), 1/2 to 1 acre (27), 1 to 5 acres (22).

How many bedrooms do homes in Independence have?

The homes for sale in Independence are 2 bedrooms (63), 3 bedrooms (172), 4 bedrooms (77), 5+ bedrooms (18).

Do homes in Independence have HOA fees?

350 of the homes for sale in Independence carry no HOA at all, and 50 have a fee under $150 a month.

Are there single-story homes for sale in Independence?

206 single-story homes are for sale in Independence today.

Are there homes with a pool in Independence?

7 of the homes for sale in Independence have a pool.

What kind of garages do homes in Independence have?

34 homes for sale in Independence have a three-car garage or larger, out of 163 with at least two.

What is the most common flooring in Independence homes?

Across the homes for sale in Independence, the flooring listed most often is carpet (143), wood (116), luxury vinyl (61).

Verify school attendance boundaries before relying on them — boundaries can change year-to-year.