
3-Bedroom Homes for Sale in Grandview, MO
30 homes fit this search · Sorted by Newest Listed


6208 E 129th Street, Grandview, MO
New · 21h ago


4411 E 138th Street, Grandview, MO
New · 3d ago


12905 Manchester Avenue, Grandview, MO
New · 7d ago


13420 Belmeade Avenue, Grandview, MO


6116 E 127th Street, Grandview, MO


14508 Bristol Avenue, Grandview, MO


6402 E 149th Terrace, Grandview, MO
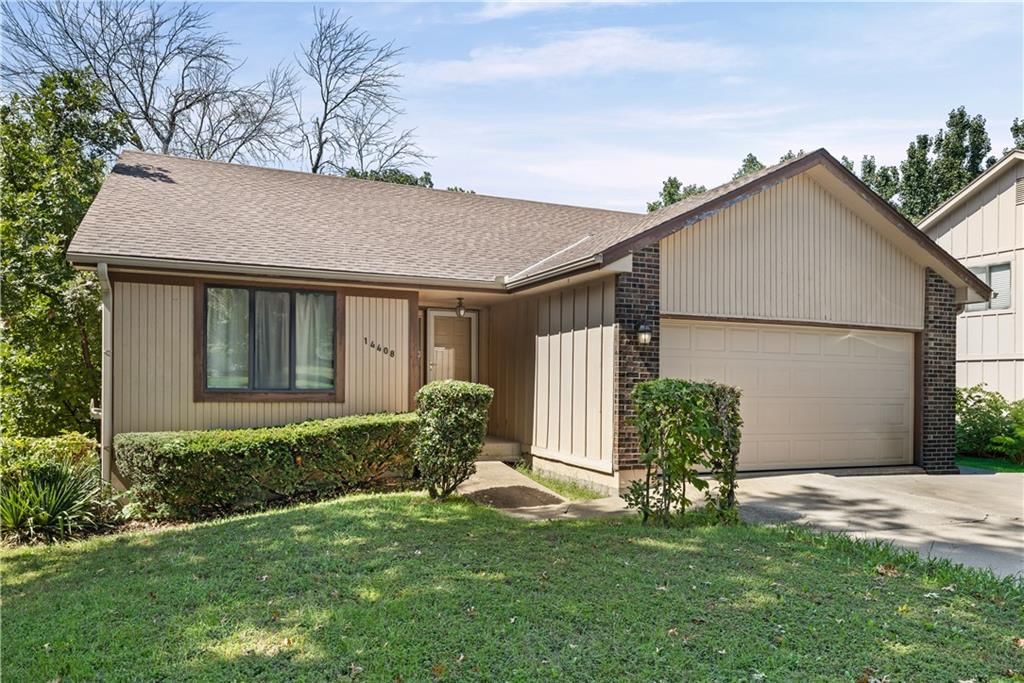
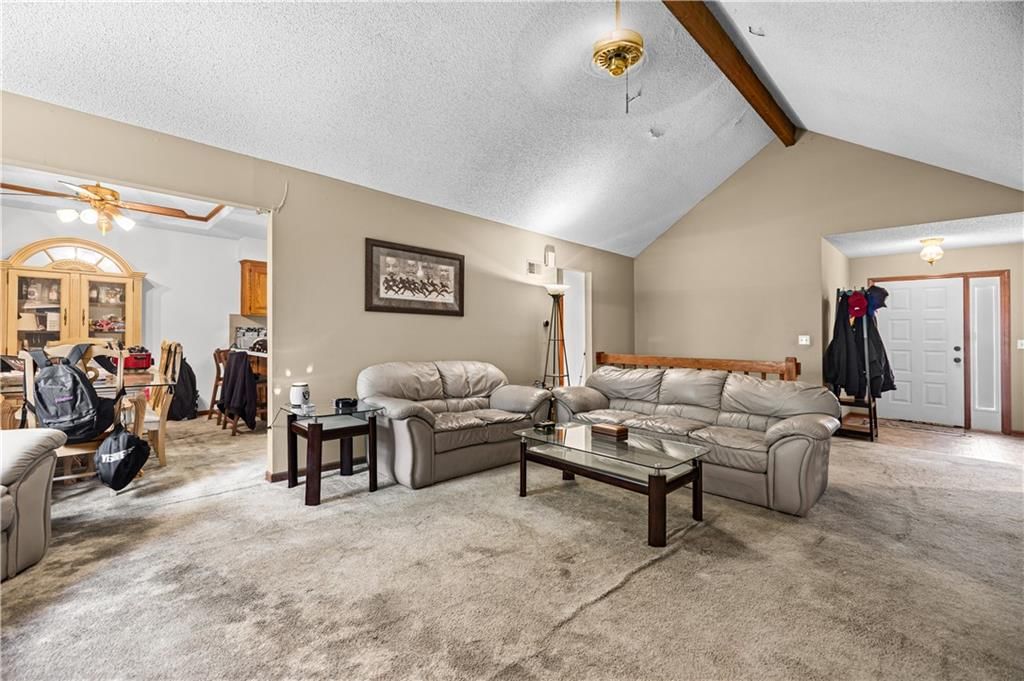
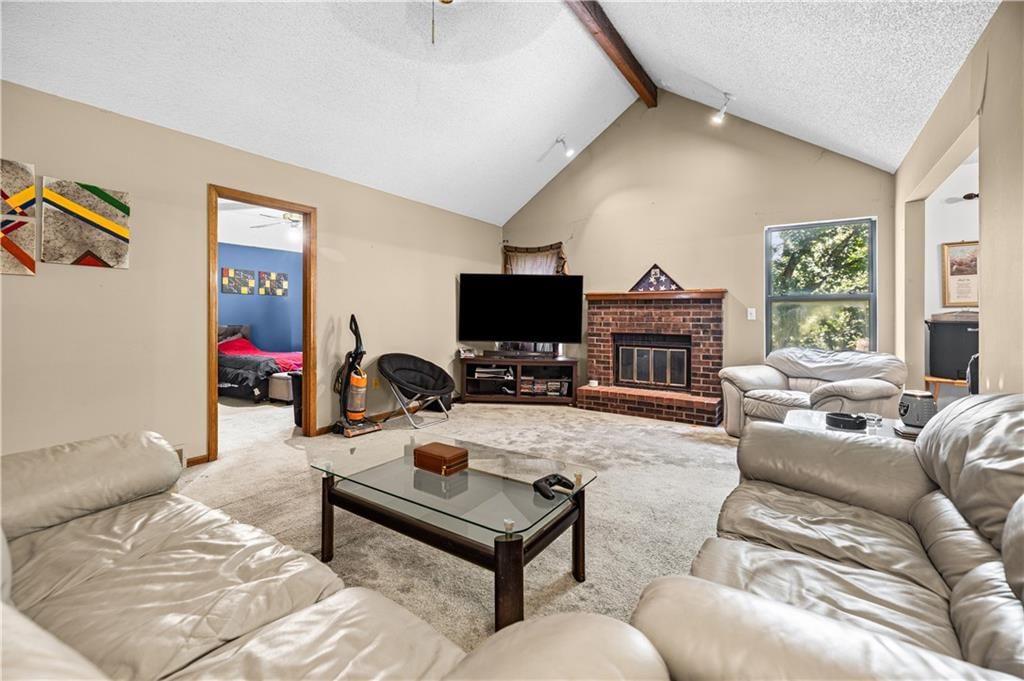
14408 St Andrews Drive, Grandview, MO


6612 E 128th Street, Grandview, MO


6500 E 128th Street, Grandview, MO


13206 Lowell Avenue, Grandview, MO


13201 Craig Avenue, Grandview, MO


1314 Duck Road, Grandview, MO


12516 Craig Avenue, Grandview, MO


7600 E 130th Court, Grandview, MO


11931 Manchester Avenue, Grandview, MO


13211 Winchester Avenue, Grandview, MO


12708 Sycamore Avenue, Grandview, MO


6405 E 140th Terrace, Grandview, MO


6704 E 129th Street, Grandview, MO
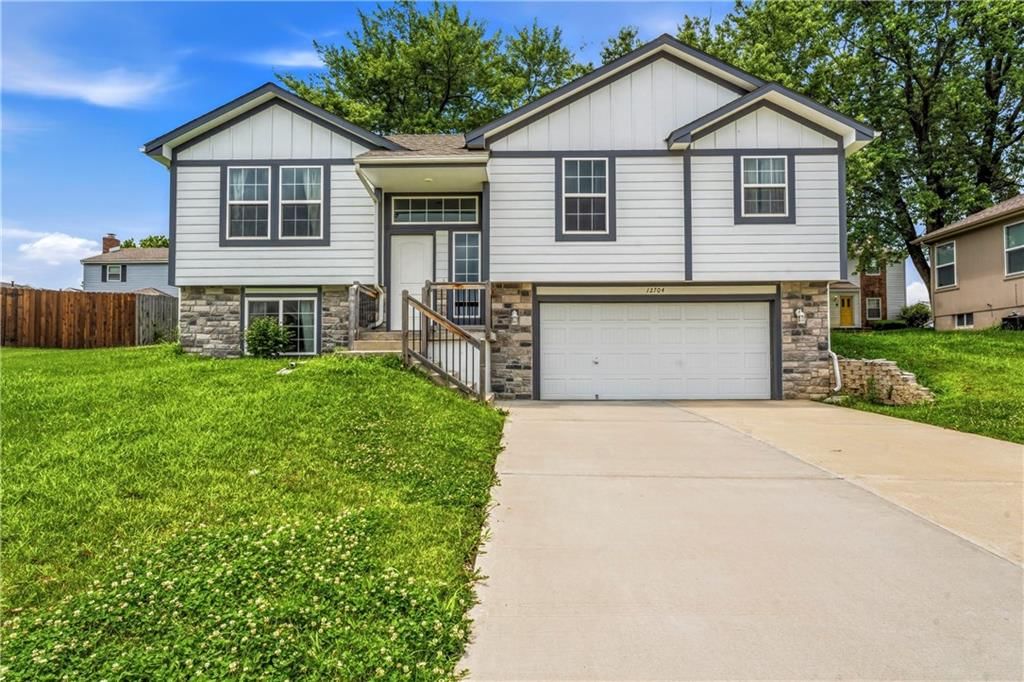


12704 Applewood Drive, Grandview, MO


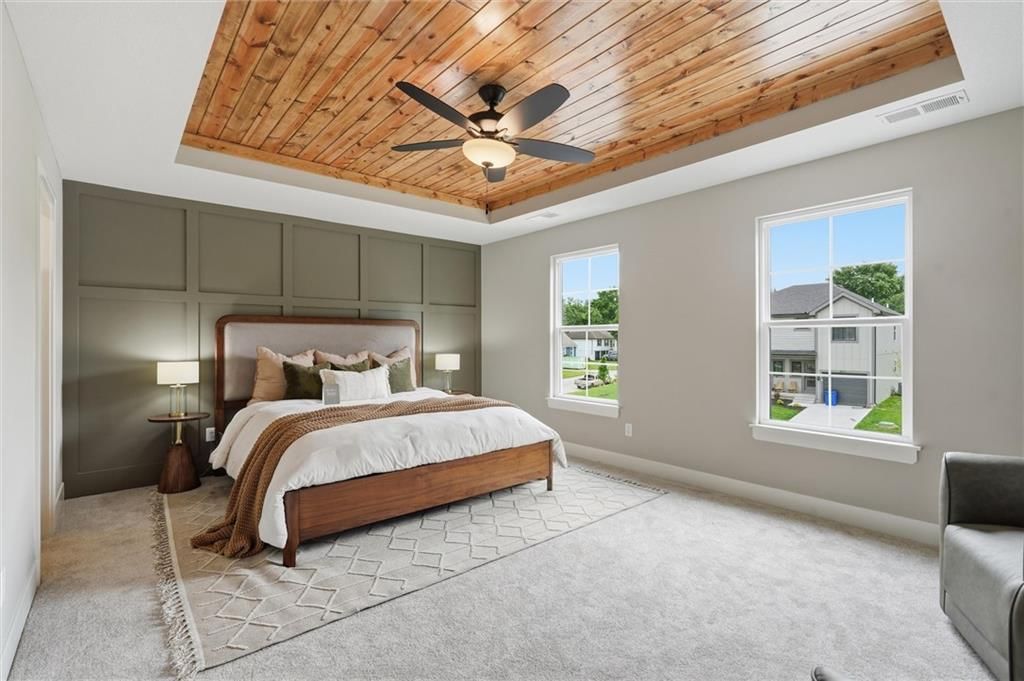
8012 E 130th Street, Grandview, MO


6000 E 152nd Street, Grandview, MO


6508 E 155th Street, Grandview, MO
About 3+ Bedroom Homes in Grandview, MO
Grandview, MO has 30 3+ bedroom homes for sale right now, with a median list price of $260,000 as of Sep 29 These 3+ bedroom homes were built between 1948 and 2026, ranging from 925 to 2,642 square feet.
3+ Bedroom Homes market trends Grandview, MO
Grandview, MO: 55 homes for sale · 3 new in the last 7 days · median asking $259,950 · 31 price reductions · a median of 15 days to contract. 26 homes closed in the last 30 days, at a median of $255,000. At the pace of the last 90 days that is 2.29 months of supply.
| Measure | Aug 2026 |
|---|---|
| Median sale price | $255,000 |
| Median price per sq ft | $149 |
| Median days to contract | 20 |
| Sell-to-list ratio | 100% |
| Homes sold | 19 |
| New listings | 35 |
| Went under contract | 33 |
3+ Bedroom Homes FAQs Grandview, MO
How many 3+ bedroom homes are for sale in Grandview, MO?
What is the median list price of 3+ bedroom homes in Grandview, MO?
Schools serving Grandview
| School | Median list | |
|---|---|---|
| School districts | ||
| Grandview School District | $259,900 | |
| High schools | ||
| Grandview | $237,500 | |
| Middle schools | ||
| Grandview | $260,000 | |
| Grandview East | Median— | |
| Elementary schools | ||
| Meadowmere | Median— | |
| Belvidere | Median— | |
| Butcher-Green | Median— | |
| Conn-West | Median— | |
How we compute these
- Median list.
- The middle asking price among the homes for sale right now. Half are listed above it, half below.
- For sale.
- Homes listed as active right now. A live count, not a monthly average.
Newly listed in Grandview, MO
| Address | Price |
|---|---|
| 4411 E 138th Street | Price$260,000 |
| 6110 E 148TH Terrace | Price$239,000 |
| 1507 High Grove Road | Price$999,999 |
Recently went under contract in Grandview, MO
| Address | List price |
|---|---|
| 14404 Eastern Court | List price$318,000 |
| 13421 Lowell Avenue | List price$260,000 |
| 6104 E 136th Street | List price$169,900 |
| 7106 E 127th Street | List price$309,000 |
| 6303 E 153rd Street | List price$210,000 |
| 1001 Little Avenue | List price$285,000 |
| 14017 Winchester Court | List price$300,000 |
| 4719 E 135th Court | List price$347,500 |
| 13254 Park Hills Drive | List price$219,000 |
| 7209 E 133Rd Circle | List price$309,000 |
| 3200 Robinson Pike Road | List price$560,000 |
| 12811 10th Street | List price$290,000 |
How we compute these
- Under contract.
- Homes with an accepted contract that have not closed yet. A live count.
- Days to contract.
- The middle number of days between a home being listed and going under contract, over the last 90 days of closings. It is not days-to-close, and it is not how long today's listings have been sitting. Newly built homes are excluded, because a build finishing is not a market moving.
Popular home searches in Grandview
| Search | For sale |
|---|---|
| Luxury homes | For sale1 |
| Just listed homes | 4 |
| Price-reduced homes | 31 |
| Coming soon homes | 3 |
| Homes under contract | 29 |
How we compute these
- For sale.
- Homes listed as active right now. A live count, not a monthly average.
Homes by price in Grandview
| Price range | For sale |
|---|---|
| Under $200,000 | 17 |
| Under $300,000 | 39 |
| Under $400,000 | 54 |
| Under $500,000 | 55 |
| Under $600,000 | 55 |
| Under $750,000 | 56 |
| Under $1,000,000 | 57 |
| $300,000 – $400,000 | 15 |
| $400,000 – $500,000 | For sale1 |
| $600,000 – $750,000 | For sale1 |
| $1M and above | For sale1 |
How we compute these
- For sale.
- Homes listed as active right now. A live count, not a monthly average.
Homes by feature in Grandview
How we compute these
- For sale.
- Homes listed as active right now. A live count, not a monthly average.
Search by property type in Grandview
| Property type | Median sale |
|---|---|
| Single Family | $254,000 |
| Townhouse | Median— |
| Duplex | Median— |
| Quadruplex | Median— |
| Lots / Land | Median— |
How we compute these
- Market.
- Market type is set by months of supply — how long it would take to sell every home for sale at the current pace. Under ~4 months favors sellers (low inventory, faster sales, homes near or above asking); over ~6 favors buyers (more choice, more negotiating room). 4–6 is balanced.
- Months supply.
- How many months it would take to sell every home now for sale at the pace of the last 90 days: homes for sale ÷ (closings in the last 90 days ÷ 3).
- For sale.
- Homes listed as active right now. A live count, not a monthly average.
- Days to contract.
- The middle number of days between a home being listed and going under contract, over the last 90 days of closings. It is not days-to-close, and it is not how long today's listings have been sitting. Newly built homes are excluded, because a build finishing is not a market moving.
- Coming soon.
- Homes announced but not yet accepting showings. A live count.
- Under contract.
- Homes with an accepted contract that have not closed yet. A live count.
Nearby neighborhoods to Grandview
| Neighborhood | Median sale |
|---|---|
| River Oaks | $276,000 |
| Hunter Gardens | $290,300 |
| Highgrove Estates | $232,500 |
| Park Hills | $240,000 |
| Belvidere Heights | $231,500 |
| Belvidere Heights Add | $170,000 |
How we compute these
- Market.
- Market type is set by months of supply — how long it would take to sell every home for sale at the current pace. Under ~4 months favors sellers (low inventory, faster sales, homes near or above asking); over ~6 favors buyers (more choice, more negotiating room). 4–6 is balanced.
- Months supply.
- How many months it would take to sell every home now for sale at the pace of the last 90 days: homes for sale ÷ (closings in the last 90 days ÷ 3).
- For sale.
- Homes listed as active right now. A live count, not a monthly average.
- Days to contract.
- The middle number of days between a home being listed and going under contract, over the last 90 days of closings. It is not days-to-close, and it is not how long today's listings have been sitting. Newly built homes are excluded, because a build finishing is not a market moving.
- Coming soon.
- Homes announced but not yet accepting showings. A live count.
- Under contract.
- Homes with an accepted contract that have not closed yet. A live count.
Search homes nearby Grandview
| Place | Median list |
|---|---|
| Grandview | $260,000 |
| Kansas City | $260,000 |
| Independence | $226,950 |
| Lee's Summit | $530,000 |
| Blue Springs | $399,900 |
| Raytown | $236,000 |
How we compute these
- Market.
- Market type is set by months of supply — how long it would take to sell every home for sale at the current pace. Under ~4 months favors sellers (low inventory, faster sales, homes near or above asking); over ~6 favors buyers (more choice, more negotiating room). 4–6 is balanced.
- Months supply.
- How many months it would take to sell every home now for sale at the pace of the last 90 days: homes for sale ÷ (closings in the last 90 days ÷ 3).
- Median list.
- The middle asking price among the homes for sale right now. Half are listed above it, half below.
- Days to contract.
- The middle number of days between a home being listed and going under contract, over the last 90 days of closings. It is not days-to-close, and it is not how long today's listings have been sitting. Newly built homes are excluded, because a build finishing is not a market moving.
- For sale.
- Homes listed as active right now. A live count, not a monthly average.
- Coming soon.
- Homes announced but not yet accepting showings. A live count.
- Under contract.
- Homes with an accepted contract that have not closed yet. A live count.
Nearby ZIP codes
| Place | Median list |
|---|---|
| 64030 | $259,950 |
How we compute these
- Market.
- Market type is set by months of supply — how long it would take to sell every home for sale at the current pace. Under ~4 months favors sellers (low inventory, faster sales, homes near or above asking); over ~6 favors buyers (more choice, more negotiating room). 4–6 is balanced.
- Months supply.
- How many months it would take to sell every home now for sale at the pace of the last 90 days: homes for sale ÷ (closings in the last 90 days ÷ 3).
- Median list.
- The middle asking price among the homes for sale right now. Half are listed above it, half below.
- Days to contract.
- The middle number of days between a home being listed and going under contract, over the last 90 days of closings. It is not days-to-close, and it is not how long today's listings have been sitting. Newly built homes are excluded, because a build finishing is not a market moving.
- For sale.
- Homes listed as active right now. A live count, not a monthly average.
- Coming soon.
- Homes announced but not yet accepting showings. A live count.
- Under contract.
- Homes with an accepted contract that have not closed yet. A live count.
Search homes for sale in every city we cover
How we compute these
- Market.
- Market type is set by months of supply — how long it would take to sell every home for sale at the current pace. Under ~4 months favors sellers (low inventory, faster sales, homes near or above asking); over ~6 favors buyers (more choice, more negotiating room). 4–6 is balanced.
- Months supply.
- How many months it would take to sell every home now for sale at the pace of the last 90 days: homes for sale ÷ (closings in the last 90 days ÷ 3).
- Median list.
- The middle asking price among the homes for sale right now. Half are listed above it, half below.
- Days to contract.
- The middle number of days between a home being listed and going under contract, over the last 90 days of closings. It is not days-to-close, and it is not how long today's listings have been sitting. Newly built homes are excluded, because a build finishing is not a market moving.
- For sale.
- Homes listed as active right now. A live count, not a monthly average.
- Coming soon.
- Homes announced but not yet accepting showings. A live count.
- Under contract.
- Homes with an accepted contract that have not closed yet. A live count.
Search for homes in popular markets
| Market | For sale |
|---|---|
| Heritage Ranch | 29 |
| Canyon Lakes | 27 |
| Seven Bridges | 26 |
| Garrett Ranch | 24 |
| Tomahawk Valley | 22 |
| Woodlawn Estates | 21 |
How we compute these
- Market.
- Market type is set by months of supply — how long it would take to sell every home for sale at the current pace. Under ~4 months favors sellers (low inventory, faster sales, homes near or above asking); over ~6 favors buyers (more choice, more negotiating room). 4–6 is balanced.
- For sale.
- Homes listed as active right now. A live count, not a monthly average.
Or go wider still county, metro and state
How we compute these
- Market.
- Market type is set by months of supply — how long it would take to sell every home for sale at the current pace. Under ~4 months favors sellers (low inventory, faster sales, homes near or above asking); over ~6 favors buyers (more choice, more negotiating room). 4–6 is balanced.
- Months supply.
- How many months it would take to sell every home now for sale at the pace of the last 90 days: homes for sale ÷ (closings in the last 90 days ÷ 3).
- Median list.
- The middle asking price among the homes for sale right now. Half are listed above it, half below.
- Days to contract.
- The middle number of days between a home being listed and going under contract, over the last 90 days of closings. It is not days-to-close, and it is not how long today's listings have been sitting. Newly built homes are excluded, because a build finishing is not a market moving.
- For sale.
- Homes listed as active right now. A live count, not a monthly average.
- Coming soon.
- Homes announced but not yet accepting showings. A live count.
- Under contract.
- Homes with an accepted contract that have not closed yet. A live count.