
Alexander Doniphan Elementary School in Clay County, MO
20 homes for sale in the Alexander Doniphan Elementary School area · Sorted by Newest Listed


1533 Canterbury Lane, Liberty, MO
New · 1d ago


101 Avondale Street, Liberty, MO
New · 4d ago


912 Canterbury Lane, Liberty, MO


1629 Dunwich Drive, Liberty, MO


2144 Black Walnut Drive, Liberty, MO


1788 Homestead Drive, Liberty, MO


413 Pershing Street, Liberty, MO


423 Monterey Avenue, Liberty, MO


528 Skyview Lane, Liberty, MO


520 Skyview Lane, Liberty, MO


512 Skyview Lane, Liberty, MO
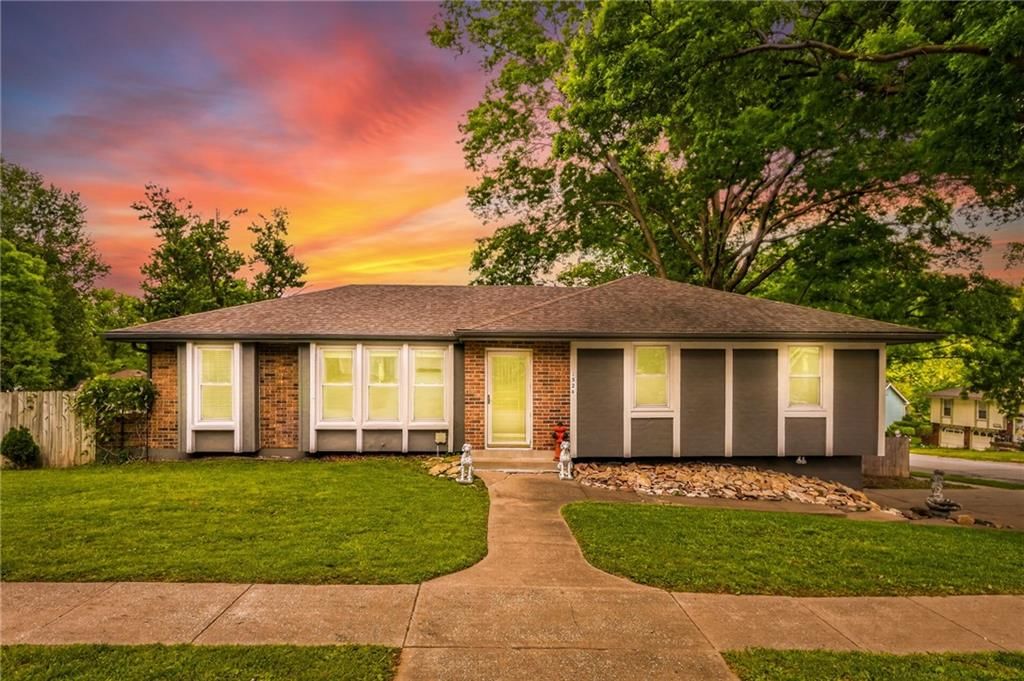
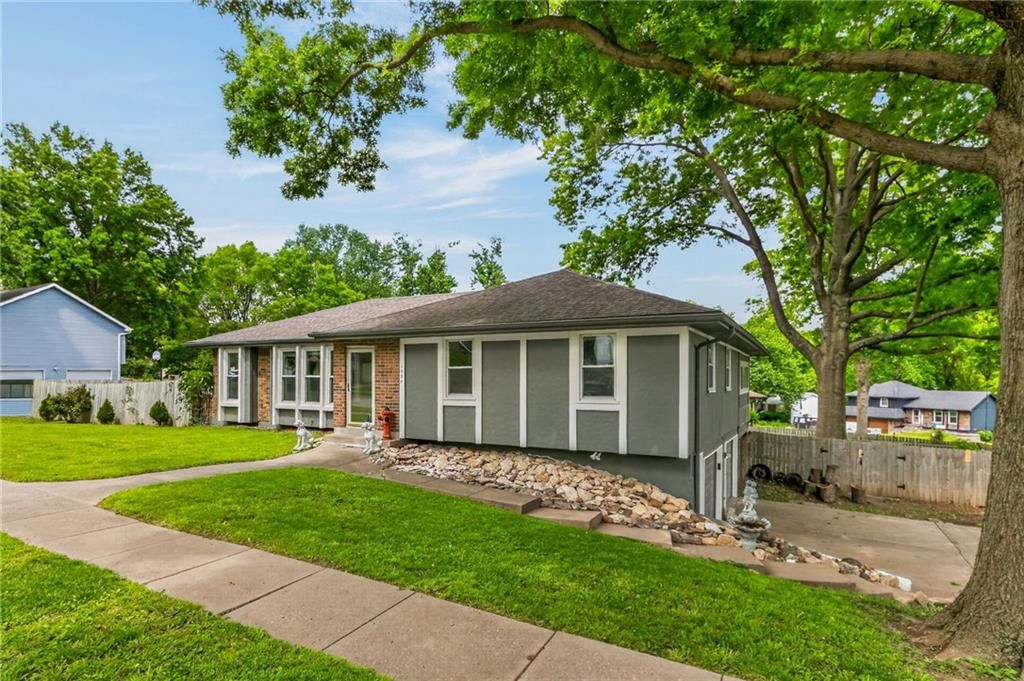

1524 Oxford Court, Liberty, MO
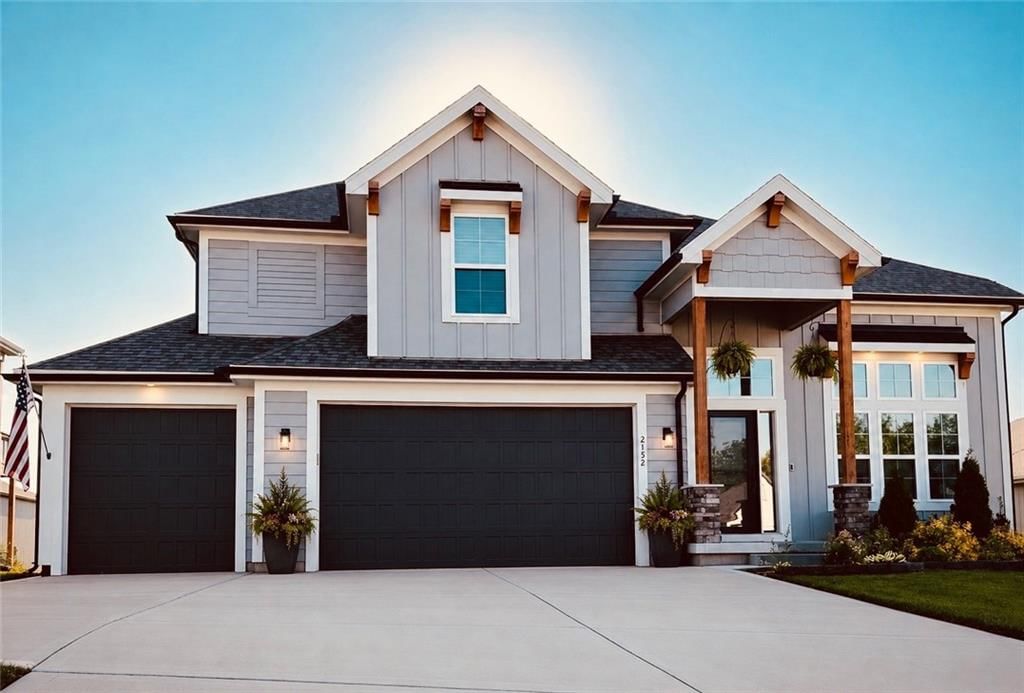


2152 Hay Market Court, Liberty, MO


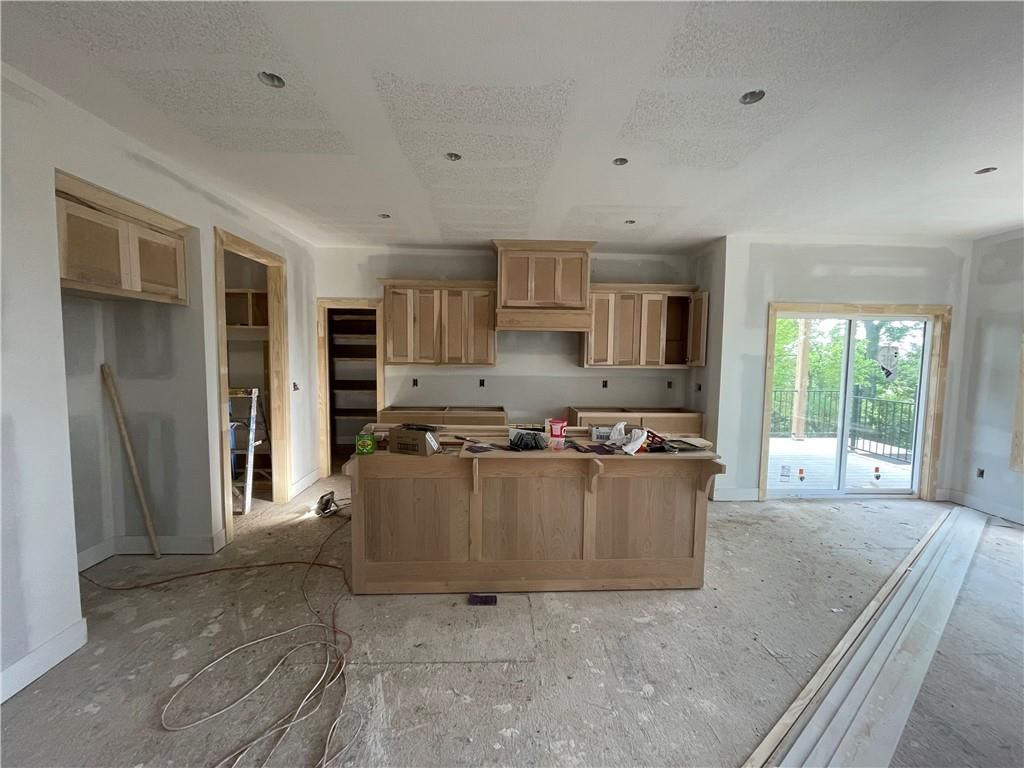
1957 Longview Drive, Liberty, MO

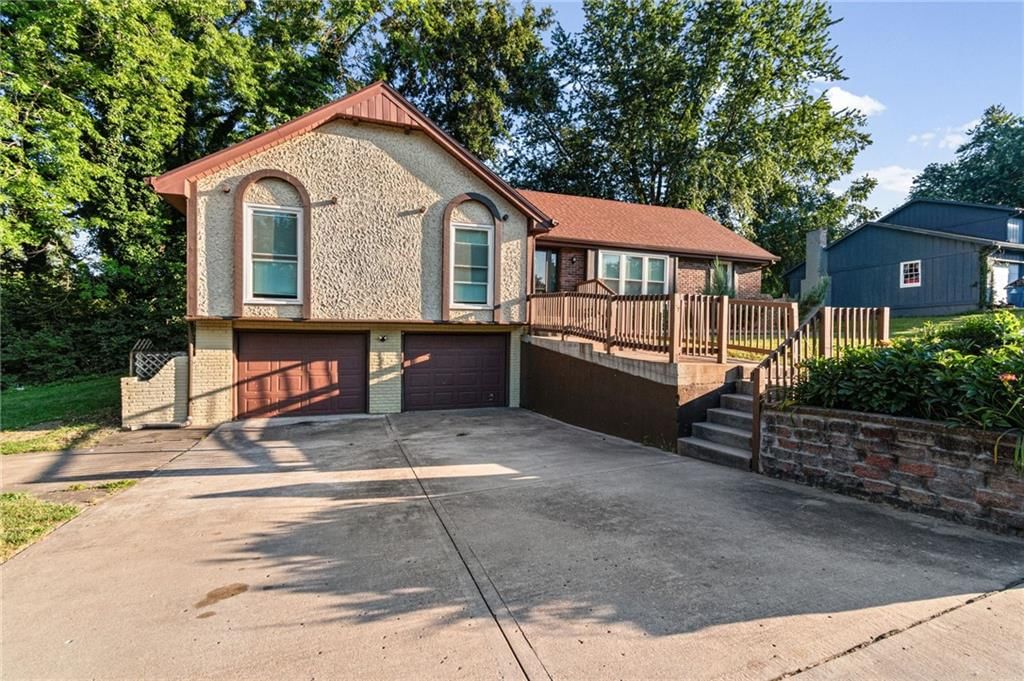
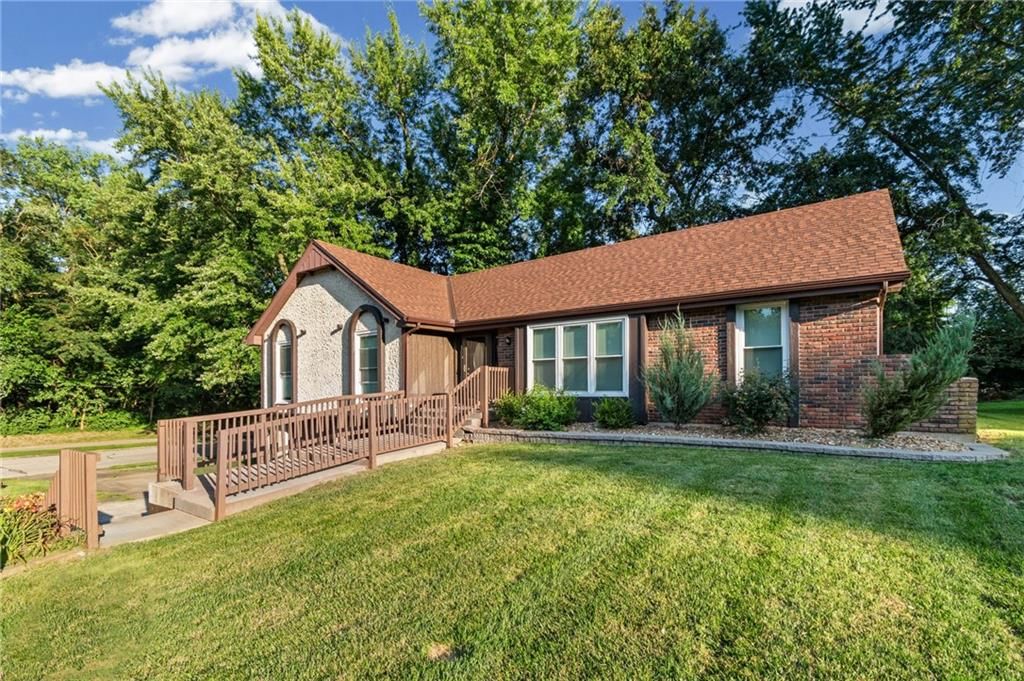
403 Kingsley Avenue, Liberty, MO

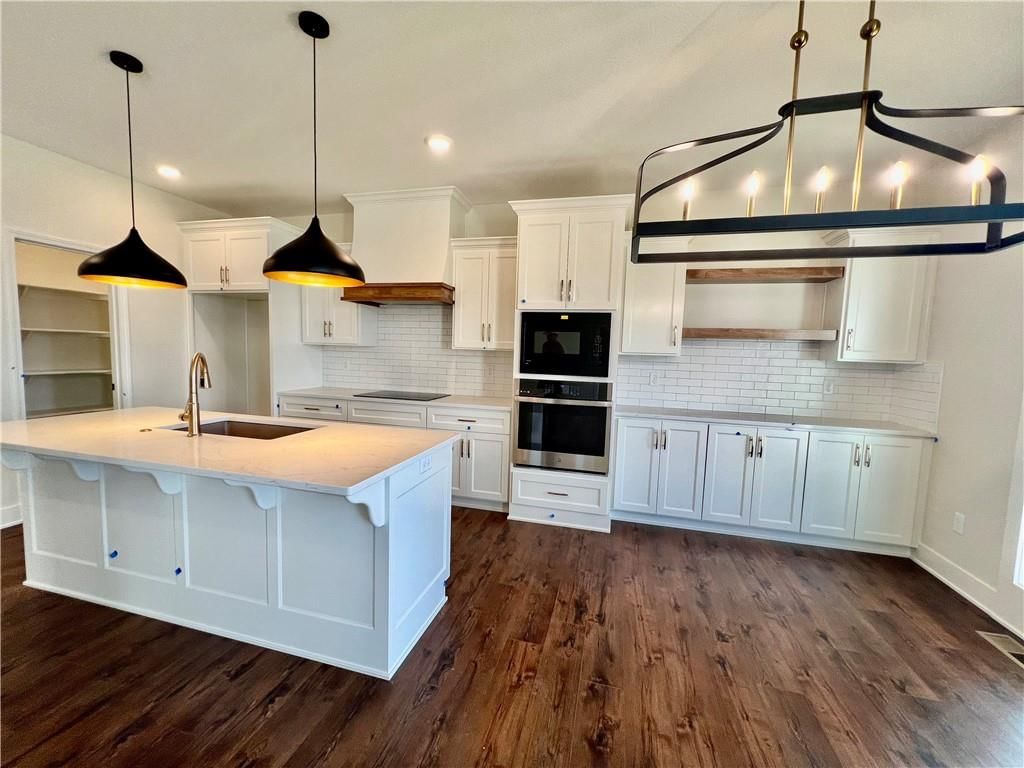
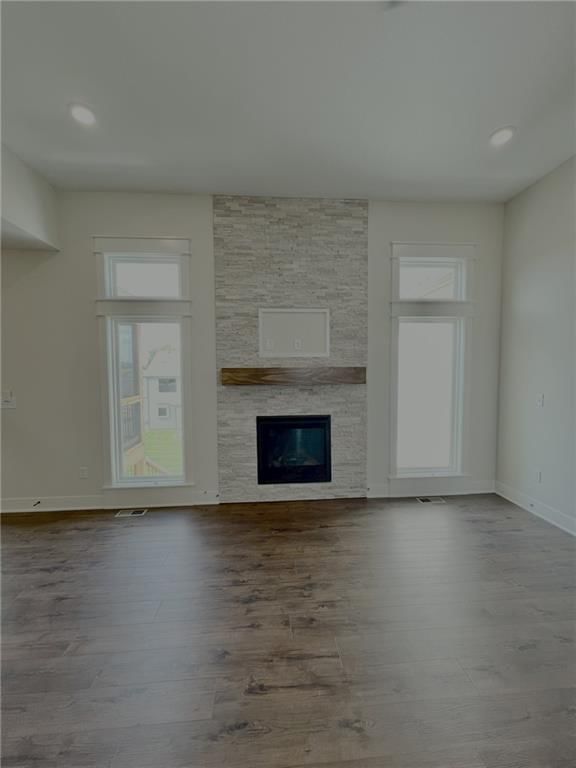
2144 Deerfield Terrace, Liberty, MO


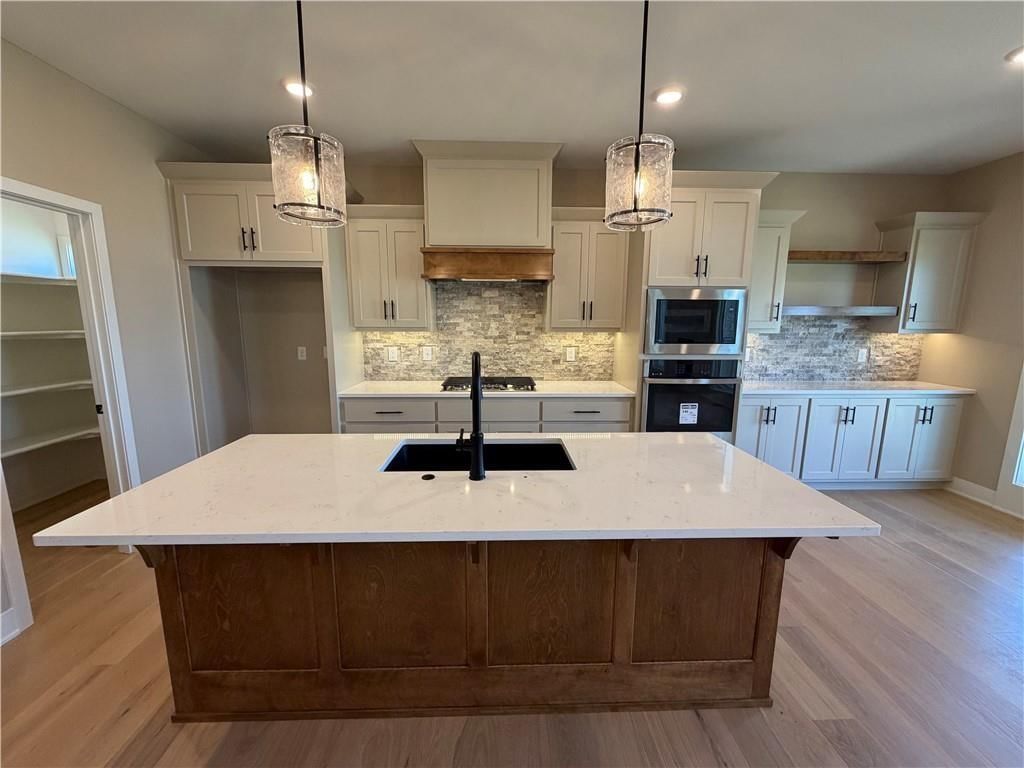
524 Skyview Lane, Liberty, MO


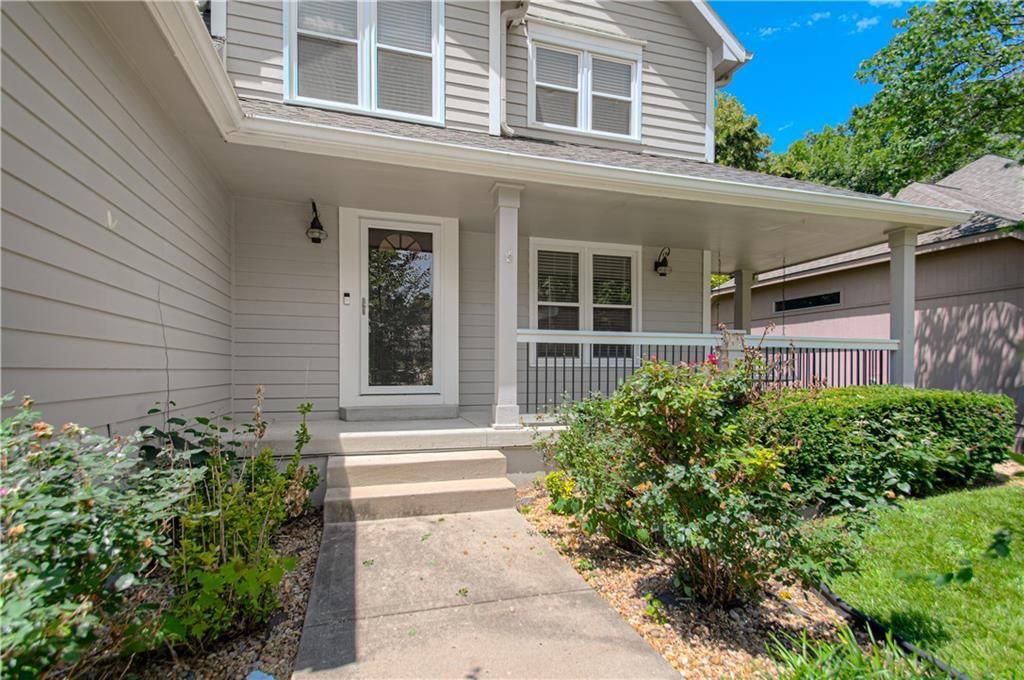
1500 Amesbury Avenue, Liberty, MO
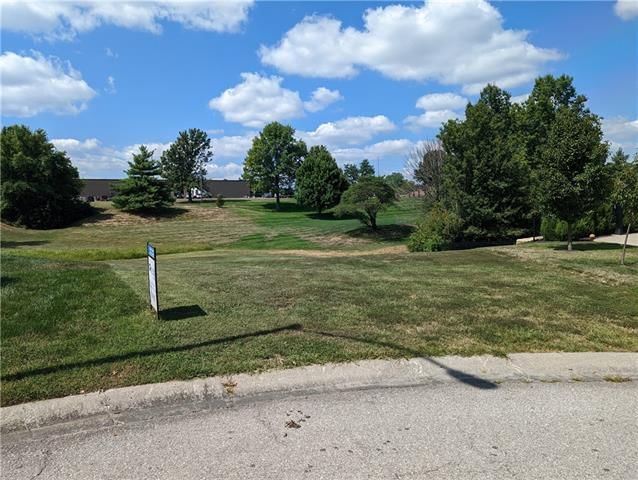


Lot 2A Oak Crest Drive, Liberty, MO


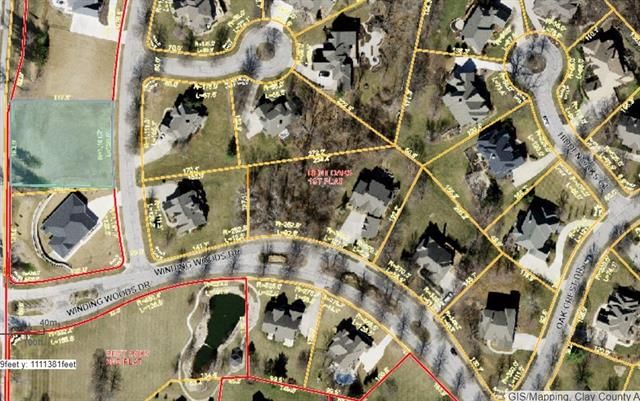
Lot 2 Bent Oaks Drive, Liberty, MO
Start with the numbers that matter to you
Clay County offers Kansas City's best mix of suburban polish and small-town charm, with 872 homes listed around $399K and a buyer-friendly 83-day average market time.
Real estate in Clay County, Missouri
Clay County, MO has about 101,008 households and a median household income of $86,150. Roughly 69% of homes are owner-occupied, the median owner's home value is $256,400, 36% of adults hold a bachelor's degree or higher. The average commute runs 23.2 minutes. The Census counts 255,566 residents. New construction is still adding supply: 23 building permits were issued in 2026-07.
The real question for anyone eyeing Clay County right now is whether to move quickly or wait — and the honest answer depends on which side of the transaction you're on. With 872 active listings and homes averaging 83 days on market, buyers have genuine breathing room. This is not a market where you make an offer sight unseen on your lunch break. Sellers, meanwhile, need to price with precision: the median list price of $379,900 as of Sep 20 and an average of $2,363 per square foot set a clear benchmark, and overpriced homes are sitting while well-positioned ones are still moving through 4,068 closings over the past twelve months.
Liberty is the gravitational center of Clay County's family market and earns that reputation honestly. Liberty Public Schools consistently rank among Missouri's best, the historic square gives the city an actual downtown rather than a strip-mall corridor, and the drive to downtown Kansas City runs about 20 minutes on a normal day. Inventory here tends to go faster than the county average, and buyers competing for the right street in Liberty should be pre-approved and decisive. Kearney and Smithville sit farther north and reward buyers who want more land, newer construction, and a slower pace without giving up the highway connection to the metro.
Gladstone and North Kansas City serve a completely different buyer profile. These are closer-in suburbs with shorter commutes, smaller lots, and price points that can undercut the county median meaningfully — making them realistic entry points for first-time buyers who've been squeezed out of Johnson County, Kansas or the urban core. The housing stock skews older here, which means more character but also more due diligence on inspections. Pleasant Valley is small and often overlooked, but its position along the Missouri River bluffs gives it views and quiet that are genuinely hard to find this close to the city.
Excelsior Springs is the county's most underrated market for buyers willing to stretch the commute slightly. The city has real bones — a historic downtown, mineral springs heritage, and a golf culture anchored by The Elms Hotel — and its prices still run below the county median for comparable square footage. Holt and Lawson, at the county's northern edge, are rural in character and draw buyers specifically looking for acreage, hobby farms, or new builds on larger lots. The year-built range running all the way to 2026 is a reminder that active new construction is still happening across Clay County, giving buyers the option to buy new without driving to Platte or Cass County.
For sellers, the 83-day average is the number that deserves the most attention. That figure reflects the full county, which includes rural and semi-rural properties that naturally take longer to find their buyer. A well-maintained home in Liberty or Gladstone priced at or slightly below the per-square-foot average will behave very differently from a five-acre parcel in Holt. Sellers who treat those 83 days as an excuse to overprice will simply donate that time to their competition. Buyers who treat it as a sign of weakness in the market will find the best listings don't wait for them. Clay County rewards both sides when they show up prepared.
Sources — demographics: U.S. Census Bureau, American Community Survey 5-year estimates (2023) · listings, prices and days on market: Heartland MLS as distributed by MLS GRID, as of September 20, 2026 · analysis and home values: HouseLoop calculations
Housing market trends in Clay County, Missouri
Clay County, MO: 817 homes for sale · 58 new in the last 7 days · median asking $382,000 · 307 price reductions · a median of 15 days to contract. 314 homes closed in the last 30 days, at a median of $345,000. At the pace of the last 90 days that is 2.45 months of supply.
| Measure | Aug 2026 |
|---|---|
| Median sale price | $350,000 |
| Median price per sq ft | $181 |
| Median days to contract | 16 |
| Sell-to-list ratio | 100% |
| Homes sold | 357 |
| New listings | 443 |
| Went under contract | 363 |
Real estate FAQs about Clay County
How many homes are for sale in Clay County?
How much does a home in Clay County cost?
What is the price per square foot in Clay County?
How fast do homes sell in Clay County?
How many homes have sold in Clay County in the past year?
When were the homes in Clay County built?
What are the newest homes for sale in Clay County?
Are there older homes for sale in Clay County?
How big are the homes for sale in Clay County?
How big are the lots in Clay County?
How many bedrooms do homes in Clay County have?
Do homes in Clay County have HOA fees?
Are there single-story homes for sale in Clay County?
Are there homes with a pool in Clay County?
What kind of garages do homes in Clay County have?
What schools serve Clay County?
Schools serving Clay County
| School | Median list | |
|---|---|---|
| School districts | ||
| North Kansas City School District | $329,000 | |
| Liberty School District | $475,000 | |
| Kearney School District | $492,000 | |
| Smithville School District | $329,950 | |
| Excelsior Springs School District | $349,900 | |
| Lawson School District | Median— | |
| Platte County R-III School District | Median— | |
| High schools | ||
| Staley | $469,900 | |
| Liberty | $499,900 | |
| Liberty North | $467,000 | |
| Kearney | $454,500 | |
| Oak Park | $287,500 | |
How we compute these
- Median list.
- The middle asking price among the homes for sale right now. Half are listed above it, half below.
- For sale.
- Homes listed as active right now. A live count, not a monthly average.
Newly listed in Clay County, MO
| Address | Price |
|---|---|
| 9101 NE 109th Terrace | Price$400,000 |
| 8123 NE 74 Terrace | Price$399,900 |
| 1108 NE 52nd Terrace | Price$263,000 |
| 504 NW 47th Street | Price$695,000 |
| 3013 NE 49th Terrace | Price$285,000 |
| 7820 NE San Rafael Drive | Price$269,900 |
| 7905 NW 122nd Court | Price$199,900 |
| 11010 N Booth Avenue | Price$320,000 |
| 1533 Canterbury Lane | Price$395,000 |
| 207 E 10th Street | Price$225,000 |
| 7205 NE 84th Court | Price$525,000 |
| 9908 N Lewis Avenue | Price$450,000 |
Recently went under contract in Clay County, MO
| Address | List price |
|---|---|
| 8510 NORTH McKINLEY Avenue | List price$1,300,000 |
| 608 NE 82nd Street | List price$275,000 |
| 1900 Karlton Way | List price$270,000 |
| 11730 N Laurel Avenue | List price$549,900 |
| 6821 T Gabbert Drive | List price$325,000 |
| 2208 NE 60th Terrace | List price$269,900 |
| 2301 NE 60th Terrace | List price$215,000 |
| 9810 NE 98th Terrace | List price$289,900 |
| 3607 NE 62nd Terrace | List price$329,000 |
| 200 Rock Creek Terrace | List price$490,000 |
| 610 E 11th Street | List price$440,000 |
| 15615 NE 116th Street | List price$3,999,999 |
How we compute these
- Under contract.
- Homes with an accepted contract that have not closed yet. A live count.
- Days to contract.
- The middle number of days between a home being listed and going under contract, over the last 90 days of closings. It is not days-to-close, and it is not how long today's listings have been sitting. Newly built homes are excluded, because a build finishing is not a market moving.
Popular home searches in Clay County
| Search | For sale |
|---|---|
| Open houses | 13 |
| Luxury homes | 40 |
| Just listed homes | 78 |
| Price-reduced homes | 308 |
| Coming soon homes | 58 |
| Homes under contract | 461 |
How we compute these
- For sale.
- Homes listed as active right now. A live count, not a monthly average.
Homes by price in Clay County
How we compute these
- For sale.
- Homes listed as active right now. A live count, not a monthly average.
Homes by feature in Clay County
How we compute these
- For sale.
- Homes listed as active right now. A live count, not a monthly average.
Search by property type in Clay County
| Property type | Median sale |
|---|---|
| Single Family | $345,000 |
| Townhouse | $240,000 |
| Villa | Median— |
| Condo / Loft | Median— |
| Half Duplex | Median— |
| Duplex | Median— |
| Triplex | Median— |
| Lots / Land | $216,915 |
How we compute these
- Market.
- Market type is set by months of supply — how long it would take to sell every home for sale at the current pace. Under ~4 months favors sellers (low inventory, faster sales, homes near or above asking); over ~6 favors buyers (more choice, more negotiating room). 4–6 is balanced.
- Months supply.
- How many months it would take to sell every home now for sale at the pace of the last 90 days: homes for sale ÷ (closings in the last 90 days ÷ 3).
- For sale.
- Homes listed as active right now. A live count, not a monthly average.
- Days to contract.
- The middle number of days between a home being listed and going under contract, over the last 90 days of closings. It is not days-to-close, and it is not how long today's listings have been sitting. Newly built homes are excluded, because a build finishing is not a market moving.
- Coming soon.
- Homes announced but not yet accepting showings. A live count.
- Under contract.
- Homes with an accepted contract that have not closed yet. A live count.
Search homes in Clay County
| City | Median list |
|---|---|
| Kansas City | $267,000 |
| Liberty | $397,000 |
| Gladstone | $217,900 |
| Kearney | $479,450 |
| Smithville | $329,950 |
| Excelsior Springs | $322,000 |
How we compute these
- Market.
- Market type is set by months of supply — how long it would take to sell every home for sale at the current pace. Under ~4 months favors sellers (low inventory, faster sales, homes near or above asking); over ~6 favors buyers (more choice, more negotiating room). 4–6 is balanced.
- Months supply.
- How many months it would take to sell every home now for sale at the pace of the last 90 days: homes for sale ÷ (closings in the last 90 days ÷ 3).
- Median list.
- The middle asking price among the homes for sale right now. Half are listed above it, half below.
- Days to contract.
- The middle number of days between a home being listed and going under contract, over the last 90 days of closings. It is not days-to-close, and it is not how long today's listings have been sitting. Newly built homes are excluded, because a build finishing is not a market moving.
- For sale.
- Homes listed as active right now. A live count, not a monthly average.
- Coming soon.
- Homes announced but not yet accepting showings. A live count.
- Under contract.
- Homes with an accepted contract that have not closed yet. A live count.
ZIP codes in Clay County
How we compute these
- Market.
- Market type is set by months of supply — how long it would take to sell every home for sale at the current pace. Under ~4 months favors sellers (low inventory, faster sales, homes near or above asking); over ~6 favors buyers (more choice, more negotiating room). 4–6 is balanced.
- Months supply.
- How many months it would take to sell every home now for sale at the pace of the last 90 days: homes for sale ÷ (closings in the last 90 days ÷ 3).
- Median list.
- The middle asking price among the homes for sale right now. Half are listed above it, half below.
- Days to contract.
- The middle number of days between a home being listed and going under contract, over the last 90 days of closings. It is not days-to-close, and it is not how long today's listings have been sitting. Newly built homes are excluded, because a build finishing is not a market moving.
- For sale.
- Homes listed as active right now. A live count, not a monthly average.
- Coming soon.
- Homes announced but not yet accepting showings. A live count.
- Under contract.
- Homes with an accepted contract that have not closed yet. A live count.
Search homes for sale in every city we cover
How we compute these
- Market.
- Market type is set by months of supply — how long it would take to sell every home for sale at the current pace. Under ~4 months favors sellers (low inventory, faster sales, homes near or above asking); over ~6 favors buyers (more choice, more negotiating room). 4–6 is balanced.
- Months supply.
- How many months it would take to sell every home now for sale at the pace of the last 90 days: homes for sale ÷ (closings in the last 90 days ÷ 3).
- Median list.
- The middle asking price among the homes for sale right now. Half are listed above it, half below.
- Days to contract.
- The middle number of days between a home being listed and going under contract, over the last 90 days of closings. It is not days-to-close, and it is not how long today's listings have been sitting. Newly built homes are excluded, because a build finishing is not a market moving.
- For sale.
- Homes listed as active right now. A live count, not a monthly average.
- Coming soon.
- Homes announced but not yet accepting showings. A live count.
- Under contract.
- Homes with an accepted contract that have not closed yet. A live count.
Search for homes in popular markets
| Market | For sale |
|---|---|
| Heritage Ranch | 29 |
| Ruskin Heights | 25 |
| Canyon Lakes | 25 |
| Garrett Ranch | 24 |
| Tomahawk Valley | 23 |
| Seven Bridges | 23 |
How we compute these
- Market.
- Market type is set by months of supply — how long it would take to sell every home for sale at the current pace. Under ~4 months favors sellers (low inventory, faster sales, homes near or above asking); over ~6 favors buyers (more choice, more negotiating room). 4–6 is balanced.
- For sale.
- Homes listed as active right now. A live count, not a monthly average.
Or go wider still county, metro and state
How we compute these
- Market.
- Market type is set by months of supply — how long it would take to sell every home for sale at the current pace. Under ~4 months favors sellers (low inventory, faster sales, homes near or above asking); over ~6 favors buyers (more choice, more negotiating room). 4–6 is balanced.
- Months supply.
- How many months it would take to sell every home now for sale at the pace of the last 90 days: homes for sale ÷ (closings in the last 90 days ÷ 3).
- Median list.
- The middle asking price among the homes for sale right now. Half are listed above it, half below.
- Days to contract.
- The middle number of days between a home being listed and going under contract, over the last 90 days of closings. It is not days-to-close, and it is not how long today's listings have been sitting. Newly built homes are excluded, because a build finishing is not a market moving.
- For sale.
- Homes listed as active right now. A live count, not a monthly average.
- Coming soon.
- Homes announced but not yet accepting showings. A live count.
- Under contract.
- Homes with an accepted contract that have not closed yet. A live count.