
Lee's Summit, MO Real Estate & Homes For Sale
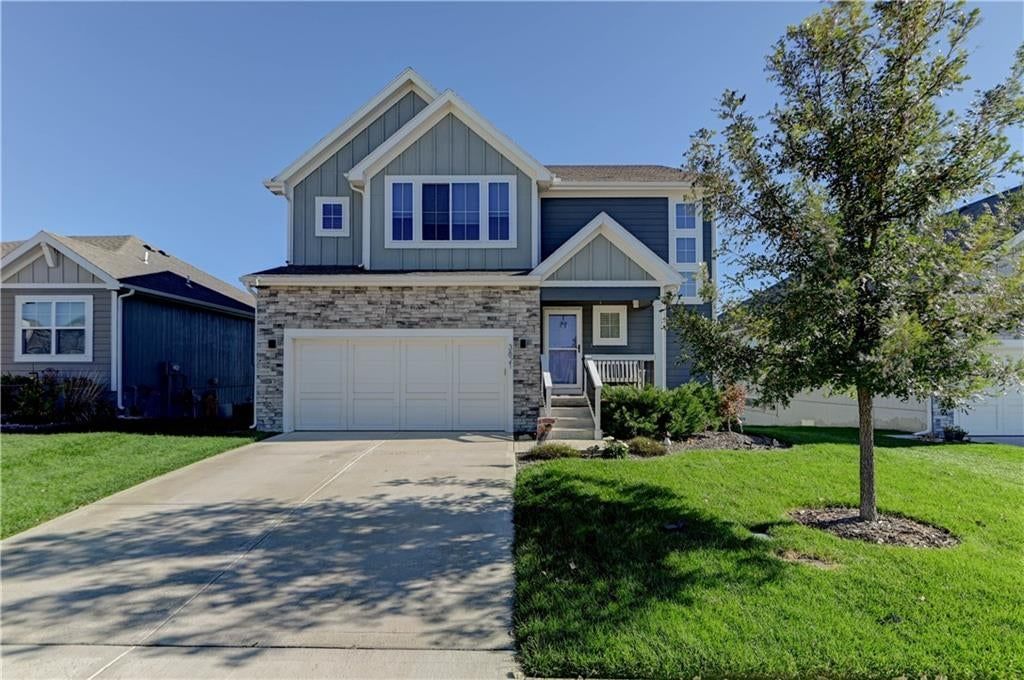
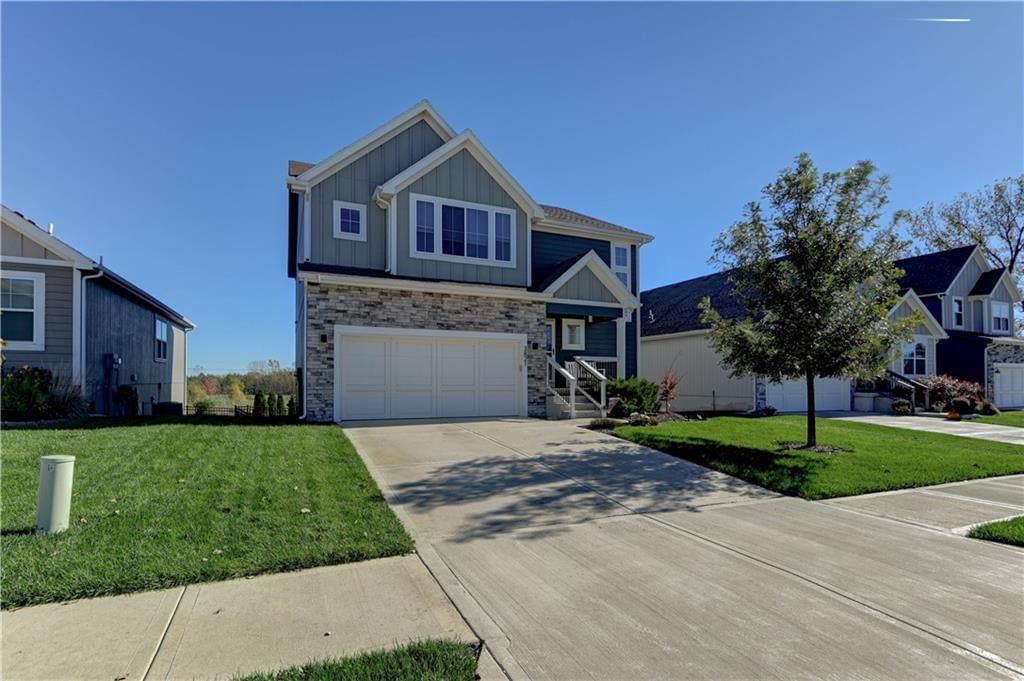
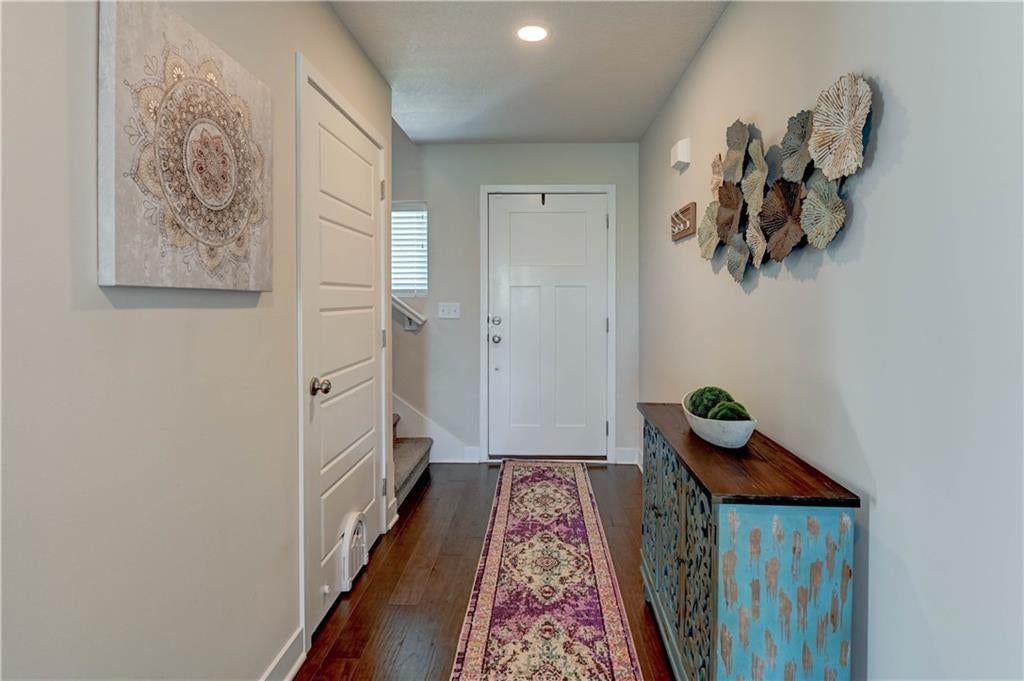
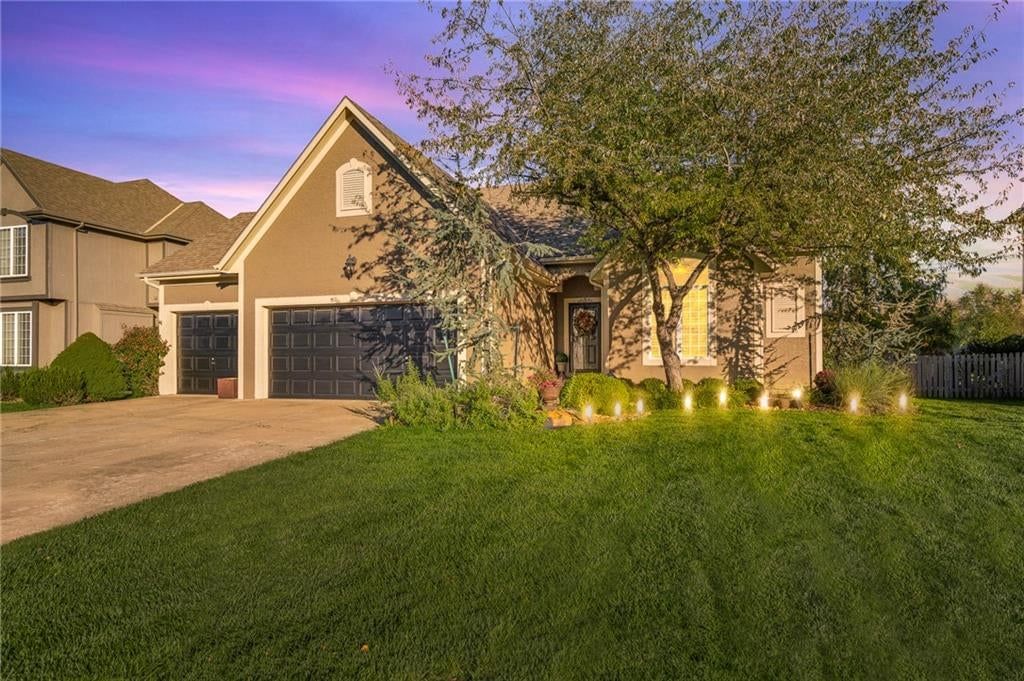
· 412 homes for sale in Lee's Summit412 homes for sale in Lee's Summit · Sorted by Newest Listed
Real estate in Lee's Summit, Missouri
Lee's Summit, MO has about 40,526 households and a median household income of $102,531. Roughly 73% of homes are owner-occupied, the median owner's home value is $340,900, 49% of adults hold a bachelor's degree or higher. The average commute runs 25.2 minutes. About 103,656 people live in Lee's Summit, MO, per the U.S. Census Bureau's American Community Survey 5-year estimate (2020–2024). New construction is still adding supply: 373 building permits were issued in September 2026.
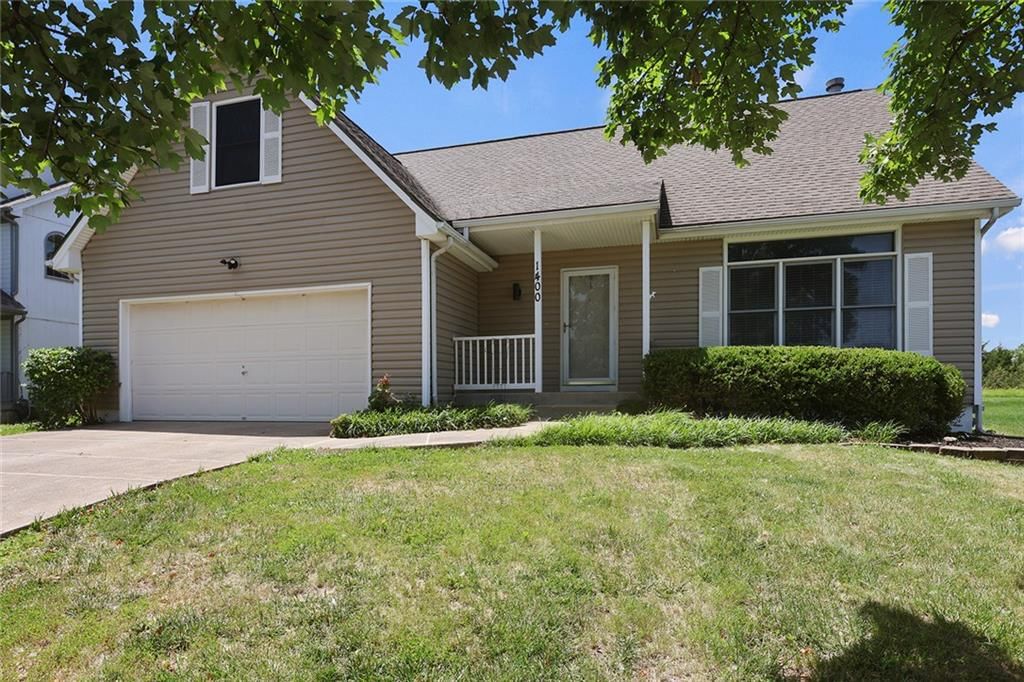
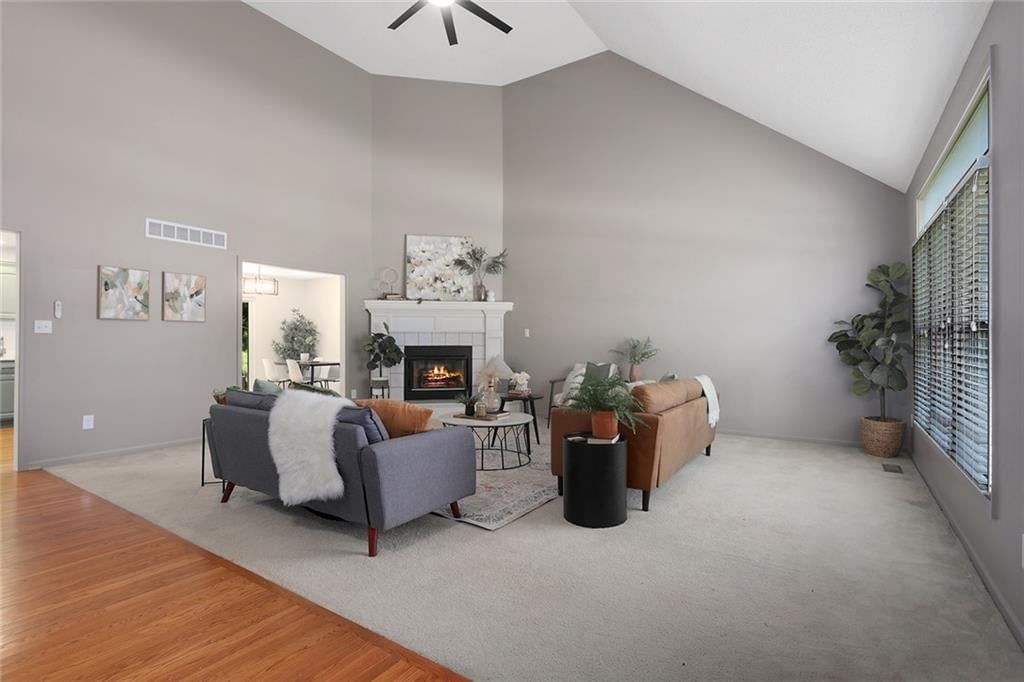
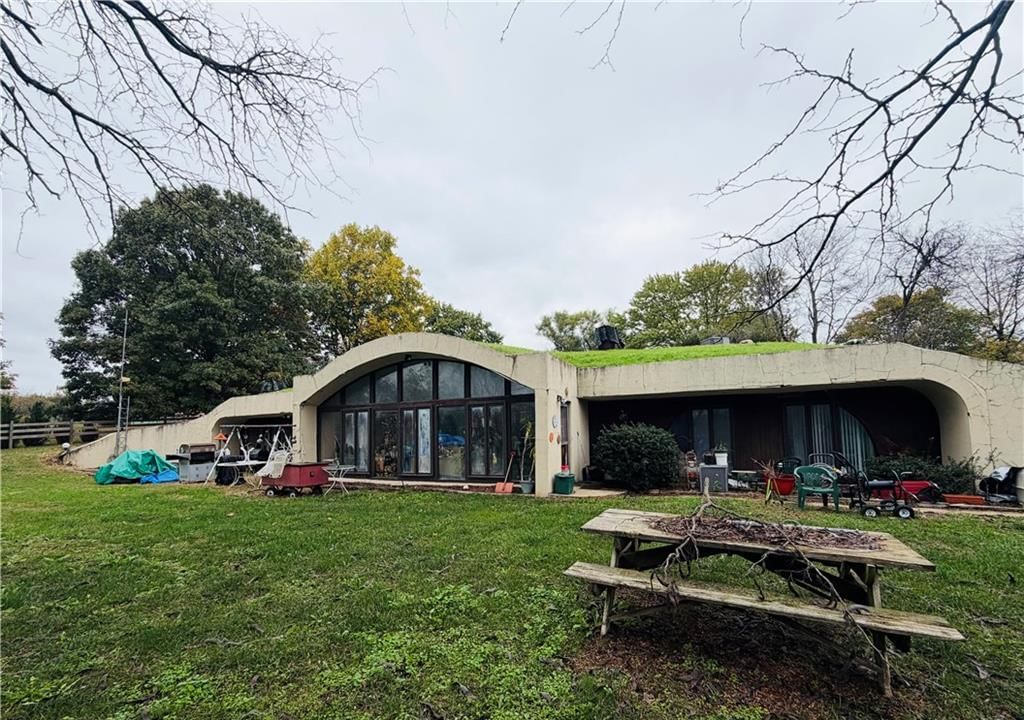
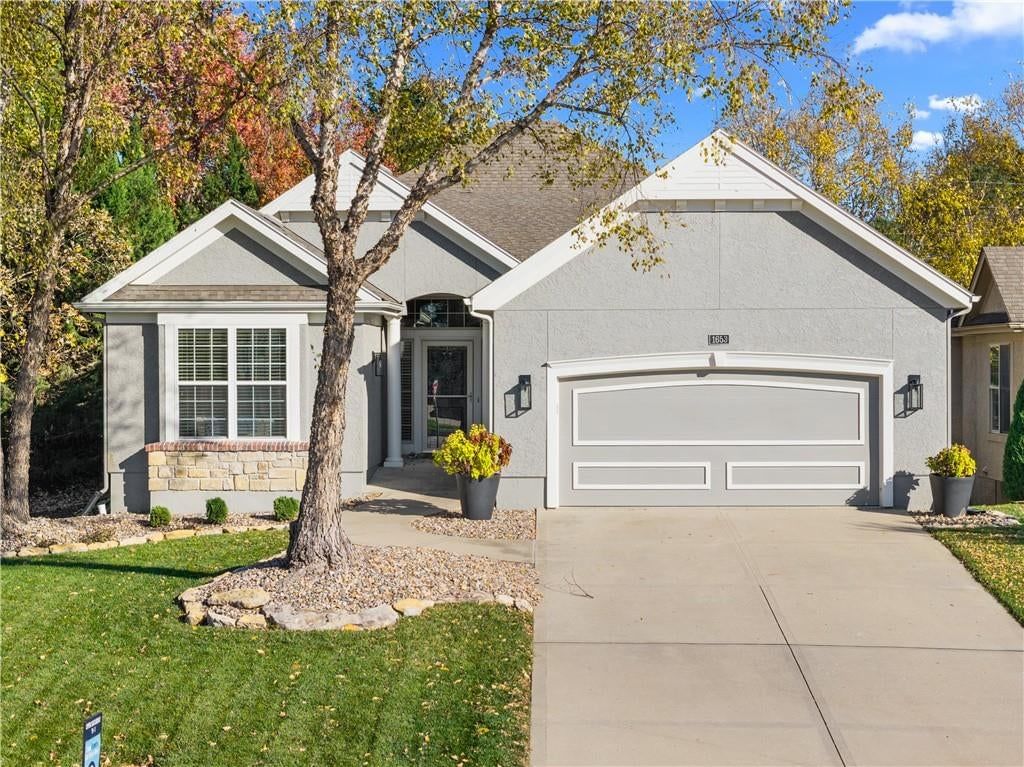
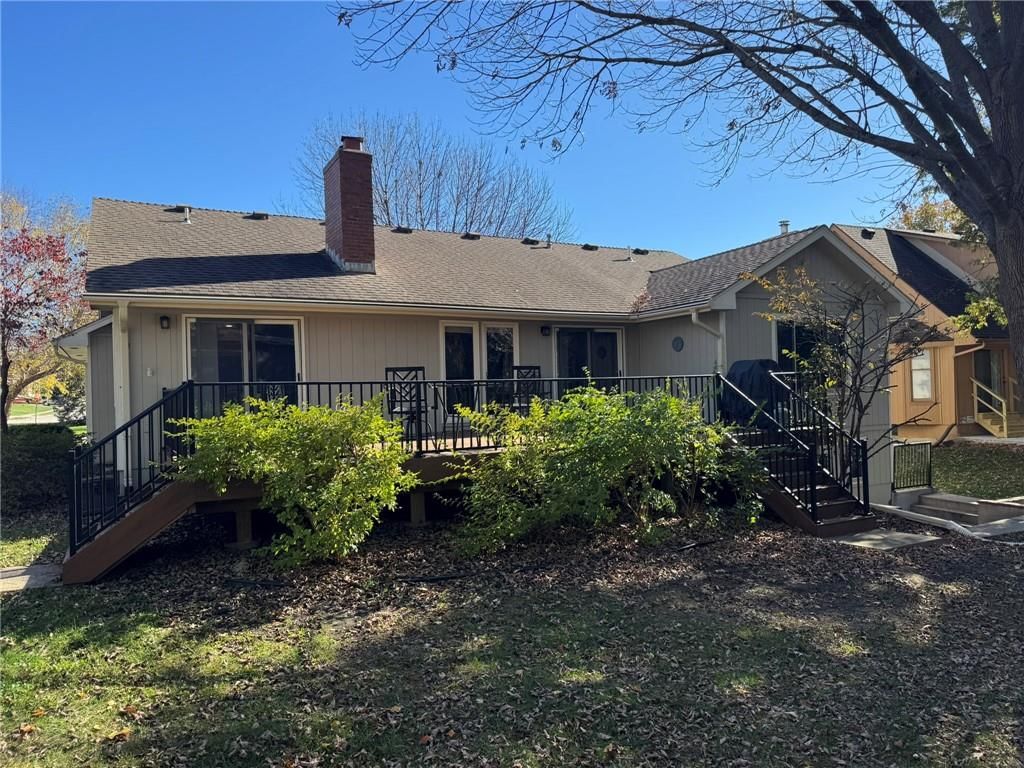
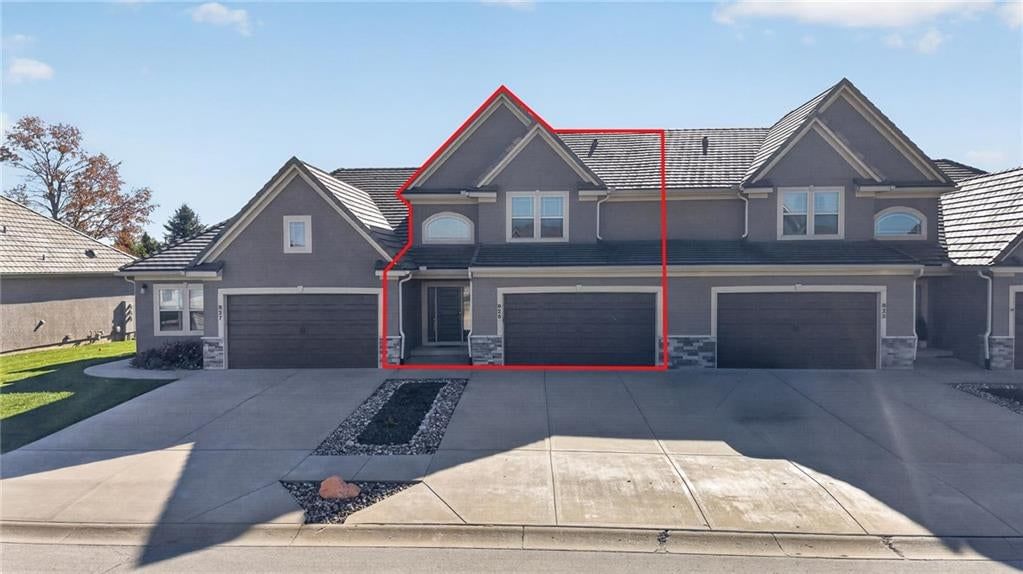
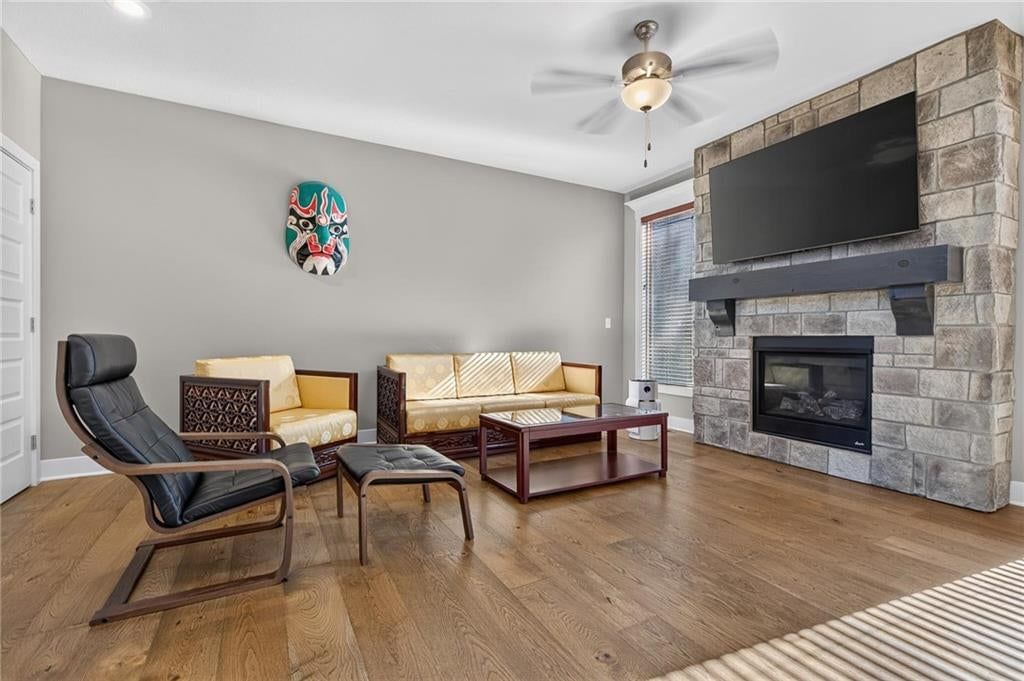
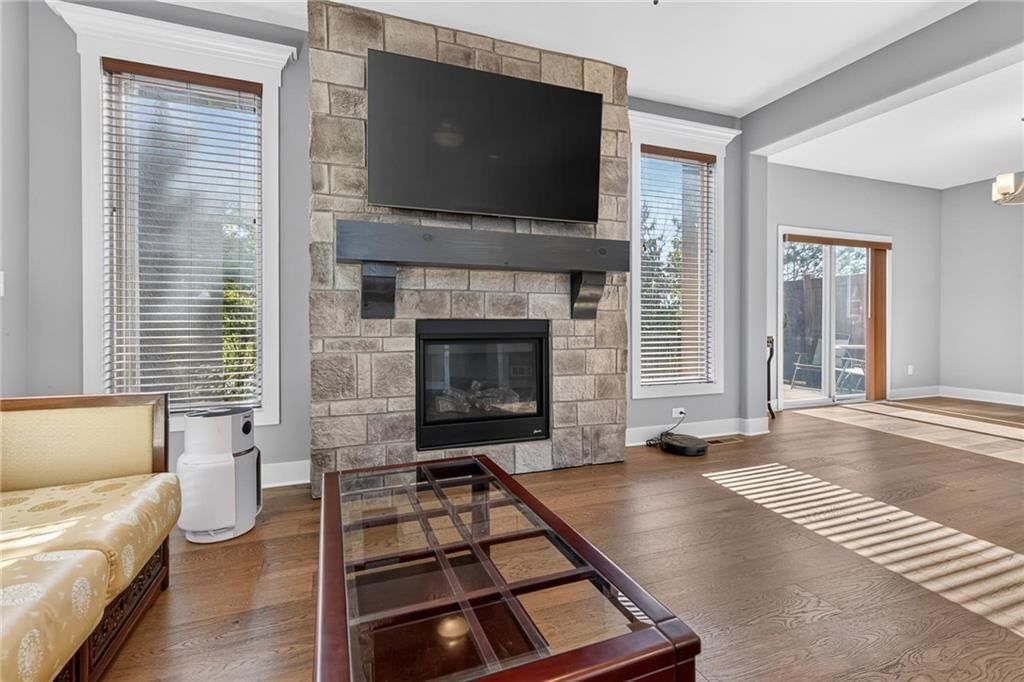
Lee's Summit, MO has 412 homes for sale right now, 17 of them coming soon, with a median list price of $497,000. These homes were built between 1890 and 2026. They range from 962 to 59,677 square feet.
Housing market trends in Lee's Summit, Missouri
| Measure | Oct 2026 | Sep 2026 | Oct 2025 |
|---|---|---|---|
| Median sale price | $428,450 | $440,000 | $425,000 |
| Median price per sq ft | $187 | $188 | $171 |
| Median days to contract | 17 | 16 | 22 |
| Sell-to-list ratio | 100% | 100% | 100% |
| Homes sold | 136 | 170 | 131 |
| New listings | 187 | 193 | 137 |
| Went under contract | 129 | 131 | 131 |
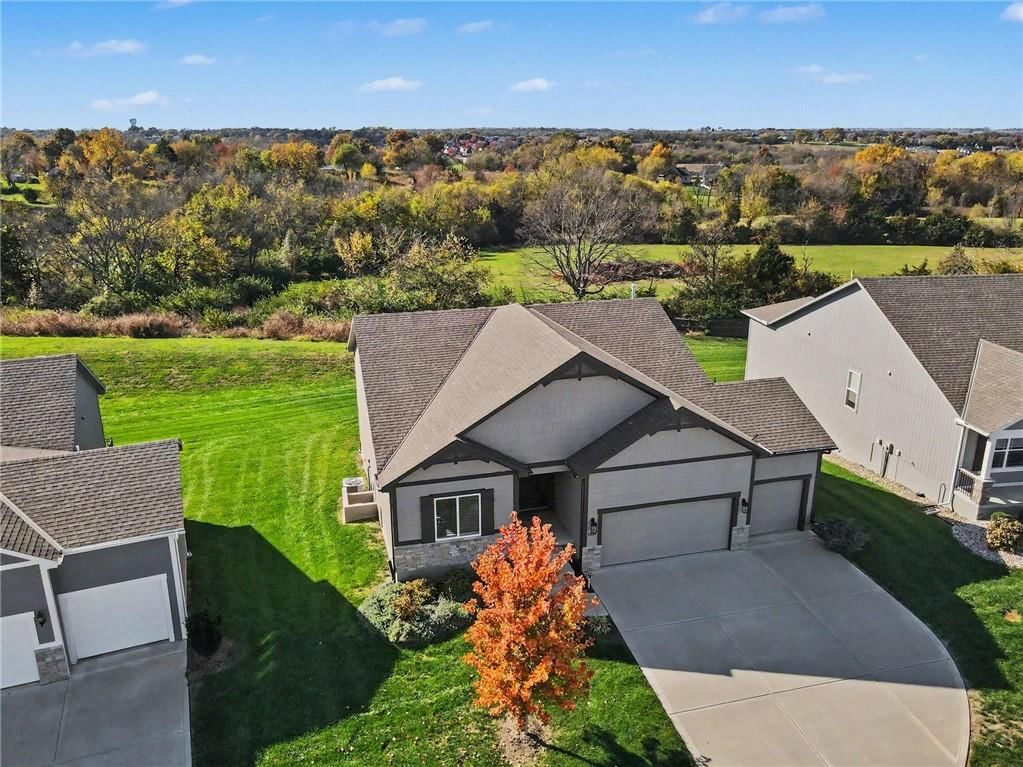
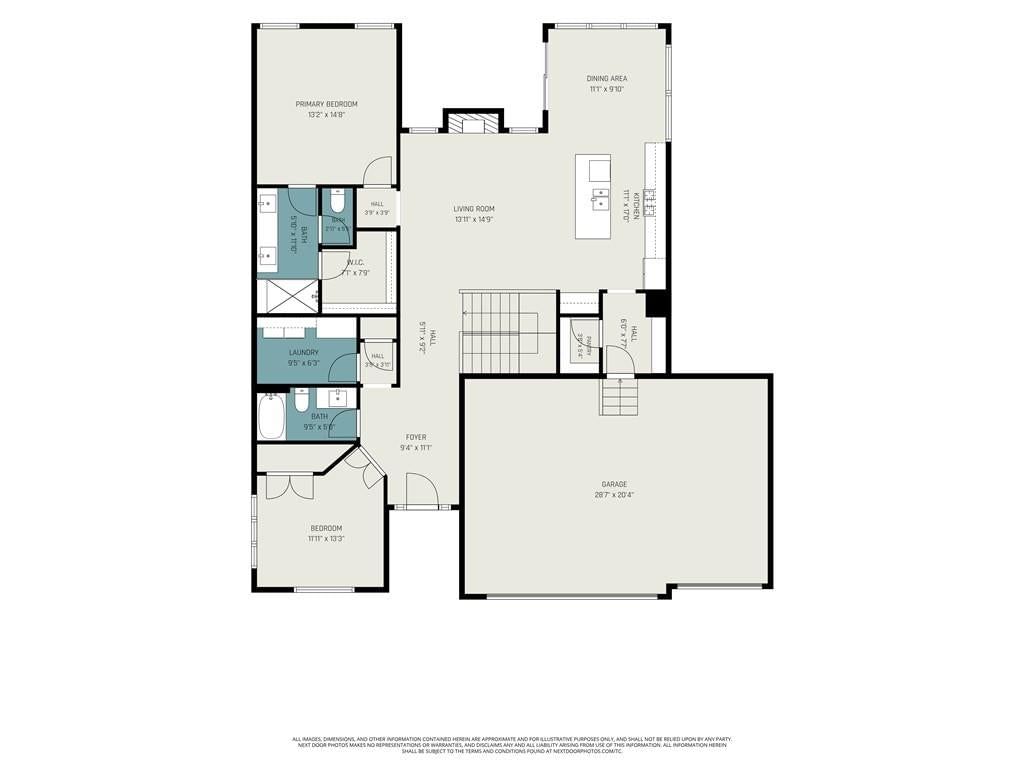
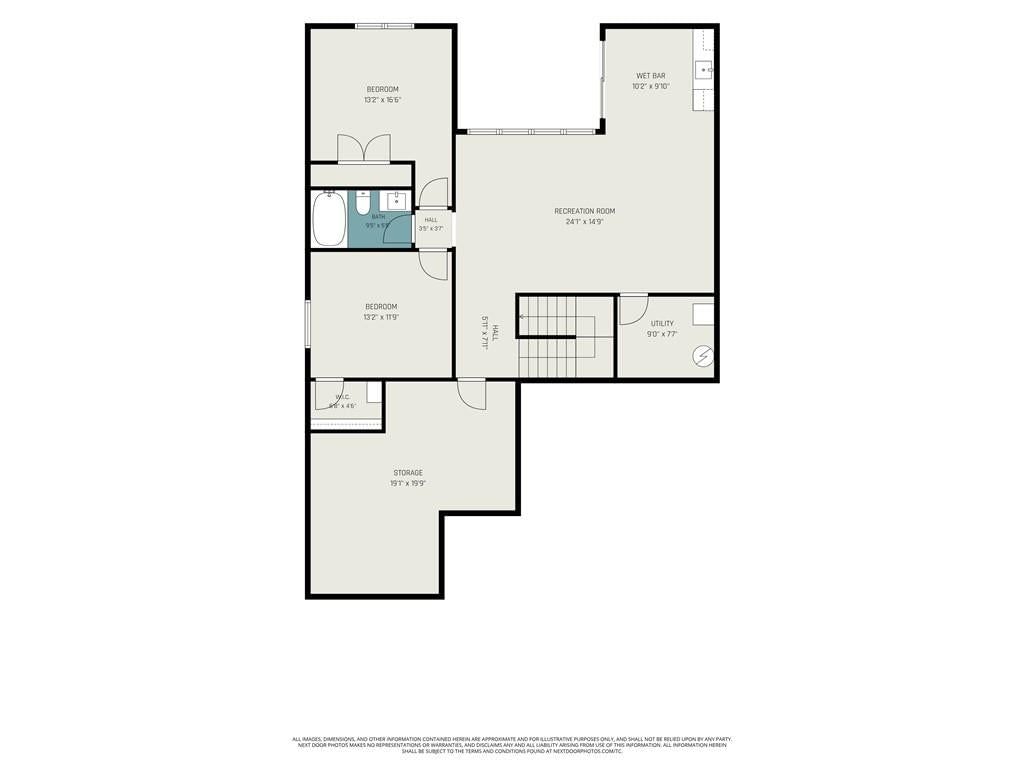
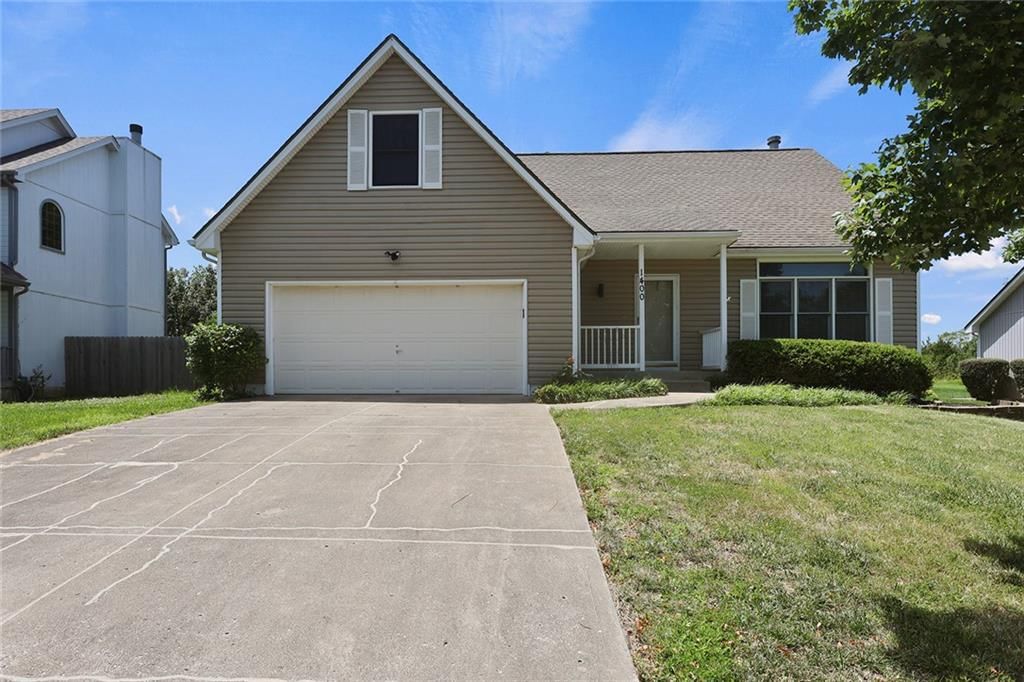
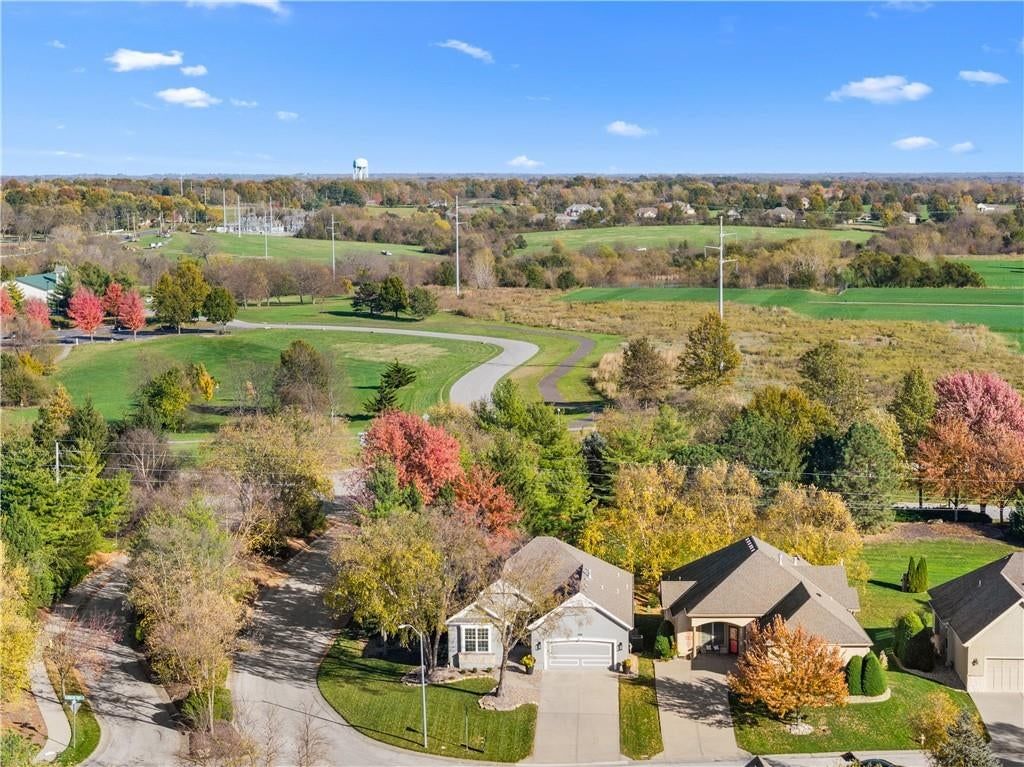
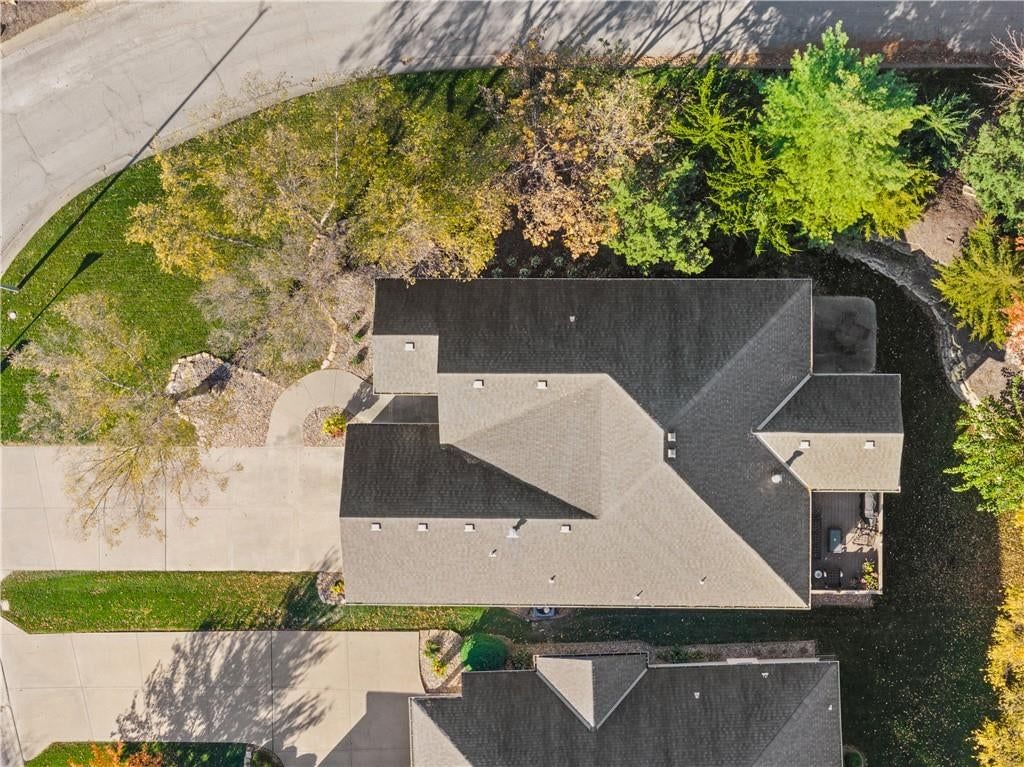
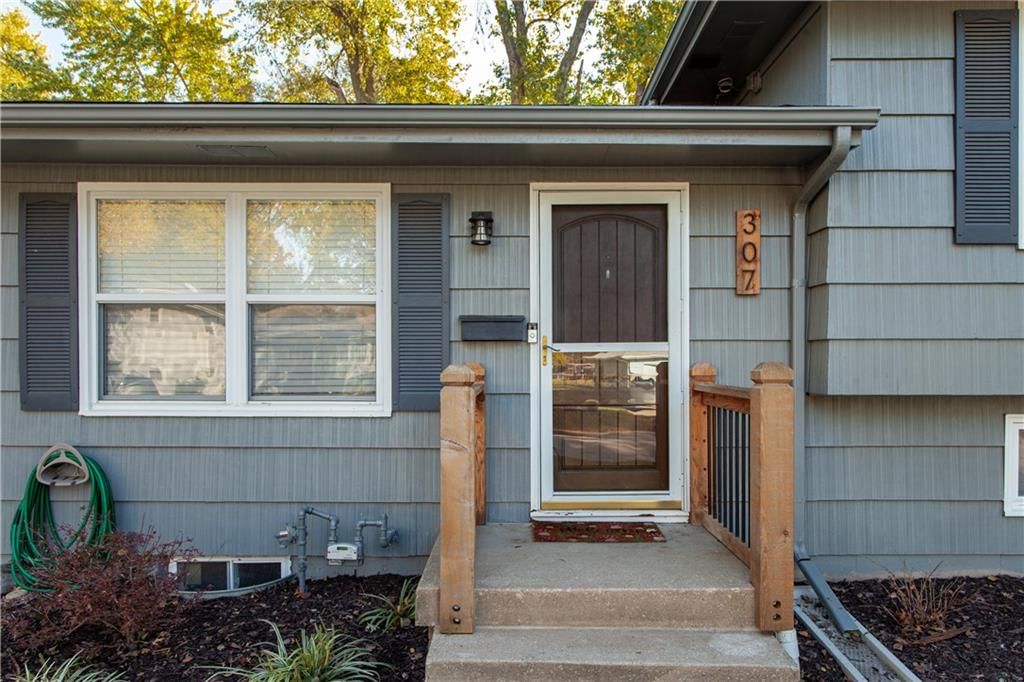
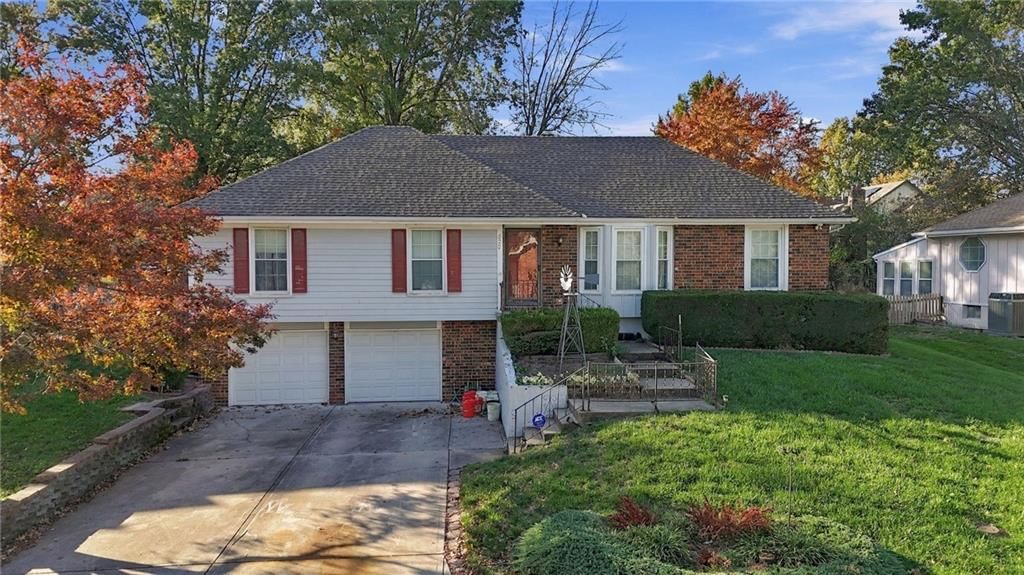
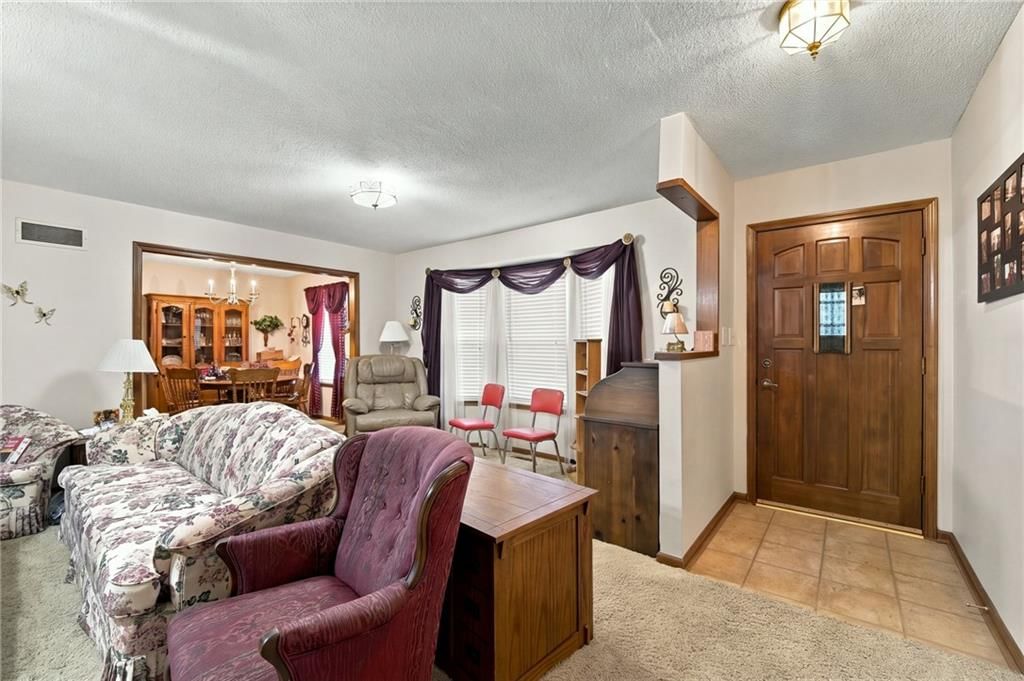
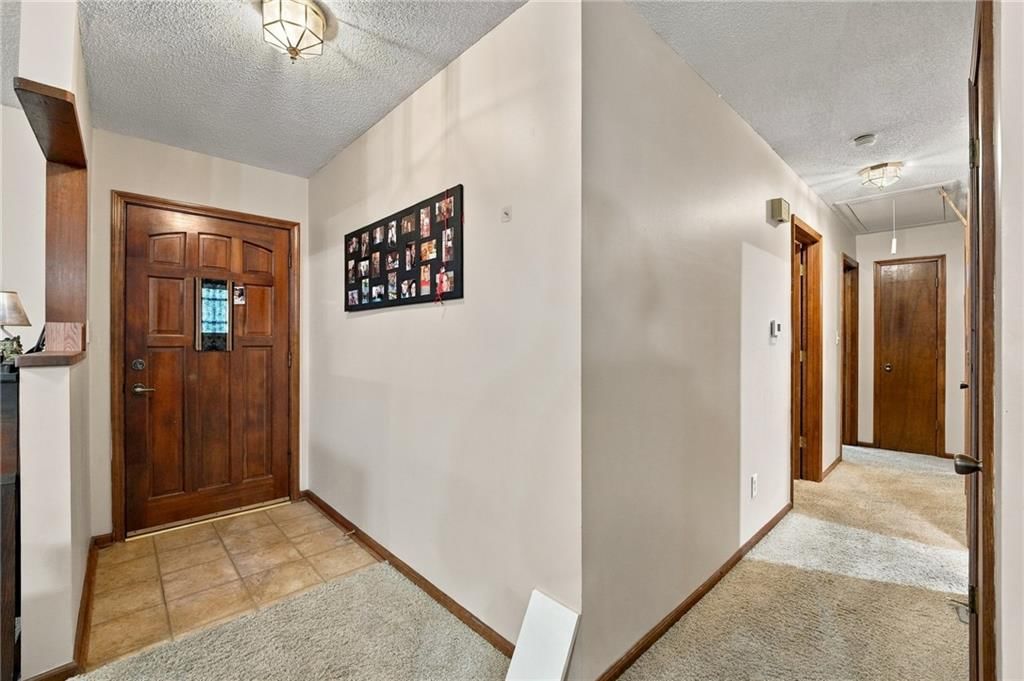
New · 1d ago
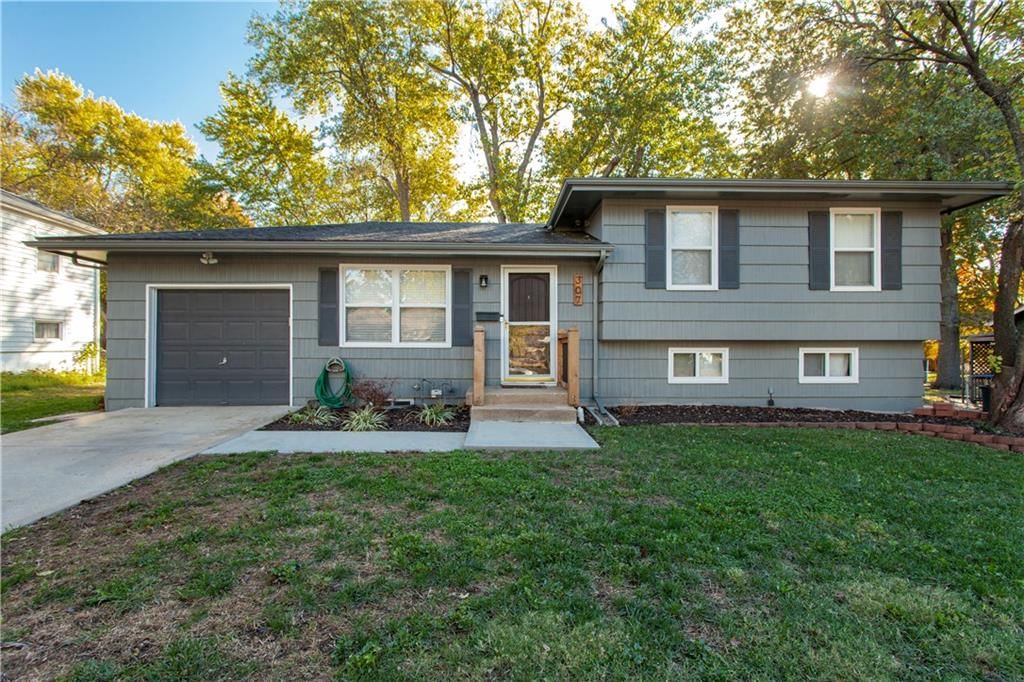
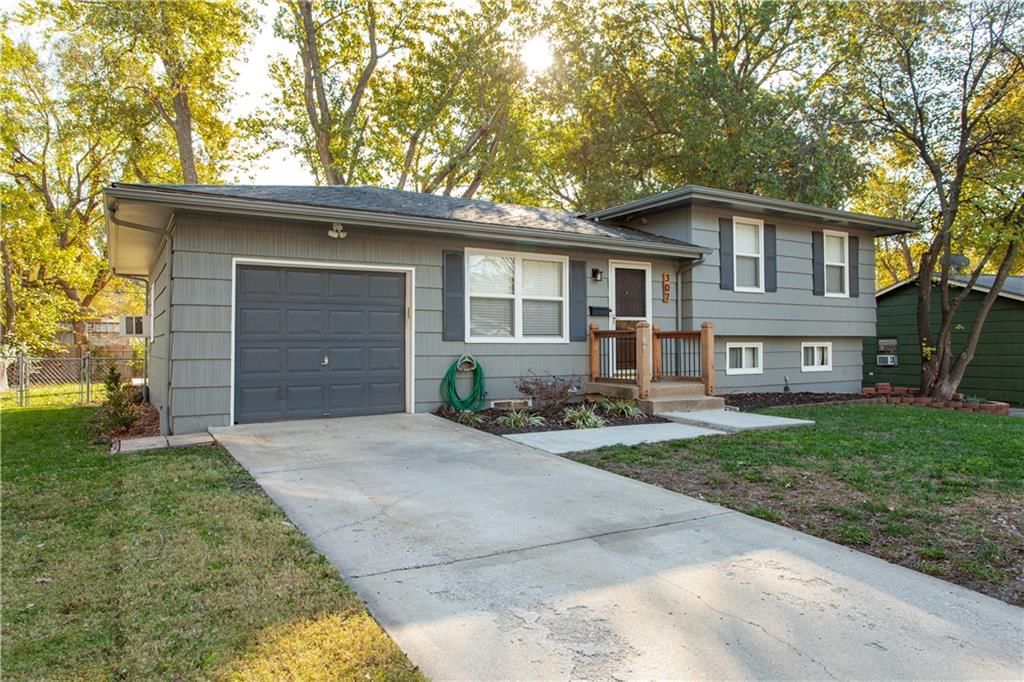
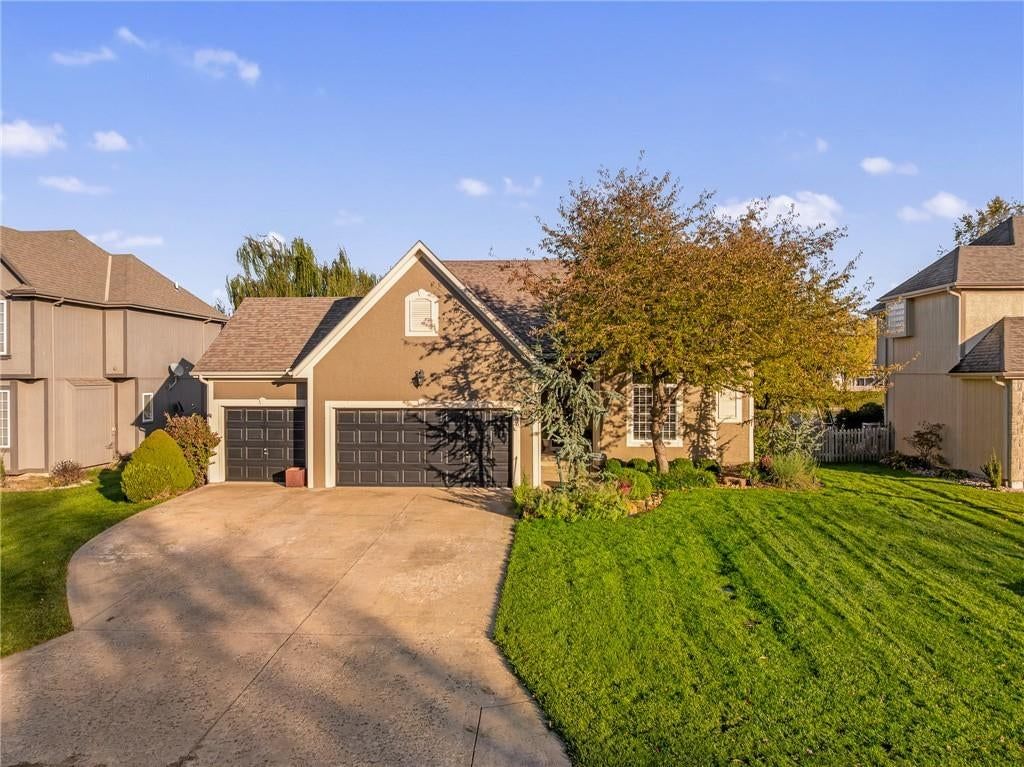
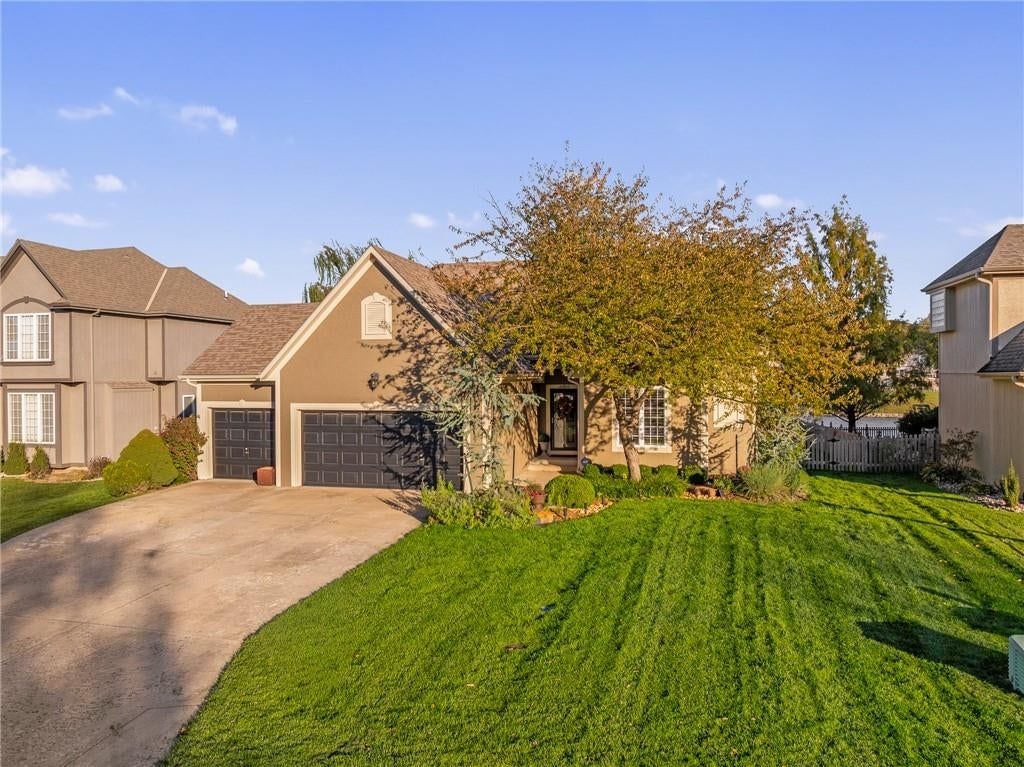
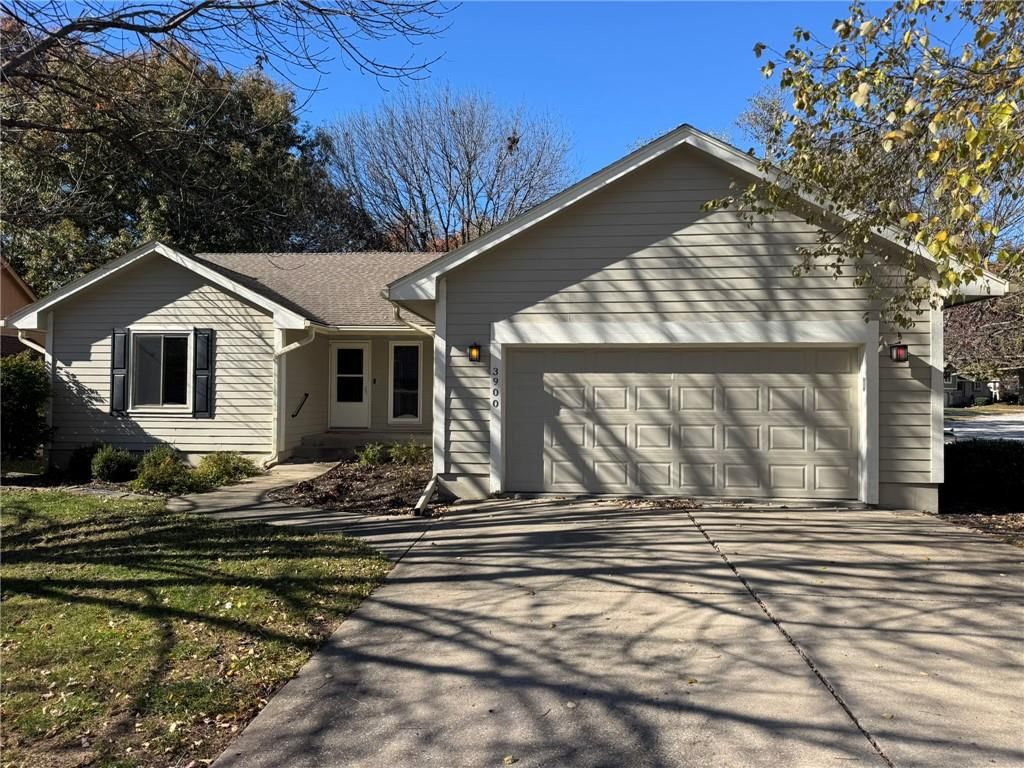
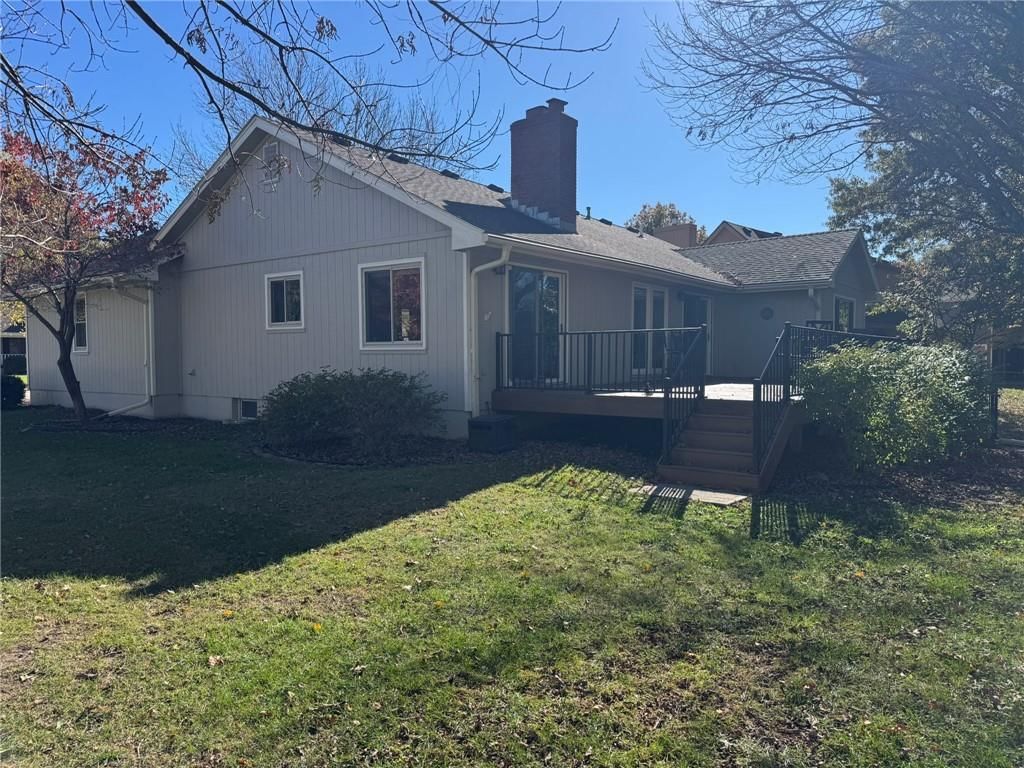
Schools serving Lee's Summit
| School | Median list | For sale |
|---|---|---|
| School districts | ||
| Lee's Summit School District | Median$477,500 | 326 |
| Blue Springs School District | Median$500,000 | 76 |
| Raymore-Peculiar School District | Median— | — |
| High schools | ||
| Lee's Summit West | Median$574,900 | 91 |
| Lee's Summit | Median$385,000 | 88 |
| Lee's Summit North | Median$419,500 | 67 |
| Blue Springs South | Median$500,000 | 50 |
| Blue Springs | Median— | — |
| Raymore-Peculiar | Median— | — |
| Middle schools | ||
| Summit Lakes | Median$559,950 | 79 |
| Bernard Campbell | Median$419,500 | 67 |
| Pleasant Lea | Median$373,750 | 54 |
How we compute these
- Median list.
- The middle asking price among the homes for sale right now. Half are listed above it, half below.
- For sale.
- Homes listed as active right now. A live count, not a monthly average.
Popular home searches in Lee's Summit
| Search | For sale |
|---|---|
| Open houses | For sale28 |
| Luxury homes | For sale21 |
| Just listed homes | For sale33 |
| Price-reduced homes | For sale182 |
| Coming soon homes | For sale17 |
| Homes under contract | For sale221 |
How we compute these
- For sale.
- Homes listed as active right now. A live count, not a monthly average.
Homes by price in Lee's Summit
| Price range | For sale |
|---|---|
| Under $200,000 | For sale5 |
| Under $300,000 | For sale51 |
| Under $400,000 | For sale155 |
| Under $500,000 | For sale215 |
How we compute these
- For sale.
- Homes listed as active right now. A live count, not a monthly average.
Homes by feature in Lee's Summit
| Feature | For sale |
|---|---|
| Homes with 2+ full bathrooms | For sale362 |
| 2-car garage homes | For sale348 |
| Homes with an attached garage | For sale331 |
| Homes with a fireplace | For sale297 |
How we compute these
- For sale.
- Homes listed as active right now. A live count, not a monthly average.
Search by property type in Lee's Summit
| Property type | Market (Market type is set by months of supply — how long it would take to sell every home for sale at the current pace. Under ~4 months favors sellers (low inventory, faster sales, homes near or above asking); over ~6 favors buyers (more choice, more negotiating room). 4–6 is balanced.) | Months supply | For sale | Median sale | Sell-to-list | Days to contract | Coming soon | Under contract |
|---|---|---|---|---|---|---|---|---|
| Single Family | Seller's | 2.7 mo | 313 | Median$435,000 | 99% | 17d | 16 | 185 |
| Townhouse | Seller's | 2.5 mo | 23 | Median$277,210 | 101% | 24d | 0 | 7 |
| Villa | — | — | — | Median— | — | — | — | — |
| Condo / Loft | — | — | — | Median— | — | — | — | — |
| Half Duplex | — | — | — | Median— | — | — | — | — |
| Duplex | — | — | — | Median— | — | — | — | — |
| Quadruplex | — | — | — | Median— | — | — | — | — |
| Lots / Land | Strong Buyer's | 18 mo | 27 | Median$195,650 | 99% | 67d | 0 | 7 |
How we compute these
- Market.
- Market type is set by months of supply — how long it would take to sell every home for sale at the current pace. Under ~4 months favors sellers (low inventory, faster sales, homes near or above asking); over ~6 favors buyers (more choice, more negotiating room). 4–6 is balanced.
- Months supply.
- How many months it would take to sell every home now for sale at the pace of the last 90 days: homes for sale ÷ (closings in the last 90 days ÷ 3).
- For sale.
- Homes listed as active right now. A live count, not a monthly average.
- Days to contract.
- The middle number of days between a home being listed and going under contract, over the last 90 days of closings. It is not days-to-close, and it is not how long today's listings have been sitting. Newly built homes are excluded, because a build finishing is not a market moving.
- Coming soon.
- Homes announced but not yet accepting showings. A live count.
- Under contract.
- Homes with an accepted contract that have not closed yet. A live count.
Nearby neighborhoods to Lee's Summit
| Neighborhood | Market (Market type is set by months of supply — how long it would take to sell every home for sale at the current pace. Under ~4 months favors sellers (low inventory, faster sales, homes near or above asking); over ~6 favors buyers (more choice, more negotiating room). 4–6 is balanced.) | Months supply | For sale | Median sale | Sell-to-list | Days to contract | Coming soon | Under contract |
|---|---|---|---|---|---|---|---|---|
| Lakewood | Seller's | 2.3 mo | 11 | Median$508,750 | 99% | 22d | 1 | 9 |
| Eagle Creek | Strong Seller's | 1.6 mo | 4 | Median$473,500 | 100% | 17d | 0 | 2 |
| Woodlawn Estates | Strong Seller's | 2 mo | 11 | Median$325,000 | 102% | 29d | 0 | 9 |
| Condos of Oaks Ridge Meadows | Seller's | 2.1 mo | 5 | Median$215,000 | 100% | 14d | 0 | 3 |
| Highland Meadows | Strong Seller's | 0.8 mo | 1 | Median$565,000 | 98% | 47d | 0 | 0 |
How we compute these
- Market.
- Market type is set by months of supply — how long it would take to sell every home for sale at the current pace. Under ~4 months favors sellers (low inventory, faster sales, homes near or above asking); over ~6 favors buyers (more choice, more negotiating room). 4–6 is balanced.
- Months supply.
- How many months it would take to sell every home now for sale at the pace of the last 90 days: homes for sale ÷ (closings in the last 90 days ÷ 3).
- For sale.
- Homes listed as active right now. A live count, not a monthly average.
- Days to contract.
- The middle number of days between a home being listed and going under contract, over the last 90 days of closings. It is not days-to-close, and it is not how long today's listings have been sitting. Newly built homes are excluded, because a build finishing is not a market moving.
- Coming soon.
- Homes announced but not yet accepting showings. A live count.
- Under contract.
- Homes with an accepted contract that have not closed yet. A live count.
Search homes nearby Lee's Summit
| Place | Market (Market type is set by months of supply — how long it would take to sell every home for sale at the current pace. Under ~4 months favors sellers (low inventory, faster sales, homes near or above asking); over ~6 favors buyers (more choice, more negotiating room). 4–6 is balanced.) | Months supply | Median list | Sell-to-list | Days to contract | For sale | Coming soon | Under contract |
|---|---|---|---|---|---|---|---|---|
| Lee's Summit | Seller's | 3 mo | Median$497,000 | 98% | 17d | 412 | 17 | 221 |
| Kansas City | Seller's | 3.9 mo | Median$257,900 | 98% | 21d | 2,177 | 82 | 763 |
| Independence | Seller's | 3.3 mo | Median$219,950 | 99% | 20d | 444 | 12 | 157 |
| Blue Springs | Seller's | 2.7 mo | Median$385,000 | 99% | 18d | 213 | 9 | 110 |
| Raytown | Seller's | 3.6 mo | Median$214,900 | 97% | 23d | 137 | 9 | 33 |
How we compute these
- Market.
- Market type is set by months of supply — how long it would take to sell every home for sale at the current pace. Under ~4 months favors sellers (low inventory, faster sales, homes near or above asking); over ~6 favors buyers (more choice, more negotiating room). 4–6 is balanced.
- Months supply.
- How many months it would take to sell every home now for sale at the pace of the last 90 days: homes for sale ÷ (closings in the last 90 days ÷ 3).
- Median list.
- The middle asking price among the homes for sale right now. Half are listed above it, half below.
- Days to contract.
- The middle number of days between a home being listed and going under contract, over the last 90 days of closings. It is not days-to-close, and it is not how long today's listings have been sitting. Newly built homes are excluded, because a build finishing is not a market moving.
- For sale.
- Homes listed as active right now. A live count, not a monthly average.
- Coming soon.
- Homes announced but not yet accepting showings. A live count.
- Under contract.
- Homes with an accepted contract that have not closed yet. A live count.
Nearby ZIP codes
| Place | Market (Market type is set by months of supply — how long it would take to sell every home for sale at the current pace. Under ~4 months favors sellers (low inventory, faster sales, homes near or above asking); over ~6 favors buyers (more choice, more negotiating room). 4–6 is balanced.) | Months supply | Median list | Sell-to-list | Days to contract | For sale | Coming soon | Under contract |
|---|---|---|---|---|---|---|---|---|
| 64083 | Balanced | 4.5 mo | Median$378,495 | 97% | 27d | 201 | 9 | 105 |
| 64086 | Balanced | 4.3 mo | Median$381,304 | 100% | 21d | 166 | 7 | 48 |
| 64064 | Seller's | 3.9 mo | Median$479,900 | 98% | 20d | 124 | 3 | 61 |
| 64081 | Seller's | 2.5 mo | Median$509,000 | 99% | 17d | 80 | 3 | 74 |
How we compute these
- Market.
- Market type is set by months of supply — how long it would take to sell every home for sale at the current pace. Under ~4 months favors sellers (low inventory, faster sales, homes near or above asking); over ~6 favors buyers (more choice, more negotiating room). 4–6 is balanced.
- Months supply.
- How many months it would take to sell every home now for sale at the pace of the last 90 days: homes for sale ÷ (closings in the last 90 days ÷ 3).
- Median list.
- The middle asking price among the homes for sale right now. Half are listed above it, half below.
- Days to contract.
- The middle number of days between a home being listed and going under contract, over the last 90 days of closings. It is not days-to-close, and it is not how long today's listings have been sitting. Newly built homes are excluded, because a build finishing is not a market moving.
- For sale.
- Homes listed as active right now. A live count, not a monthly average.
- Coming soon.
- Homes announced but not yet accepting showings. A live count.
- Under contract.
- Homes with an accepted contract that have not closed yet. A live count.