
Homes Under Contract in Lee's Summit, MO
250 homes under contract in Lee's Summit · Sorted by Newest Listed
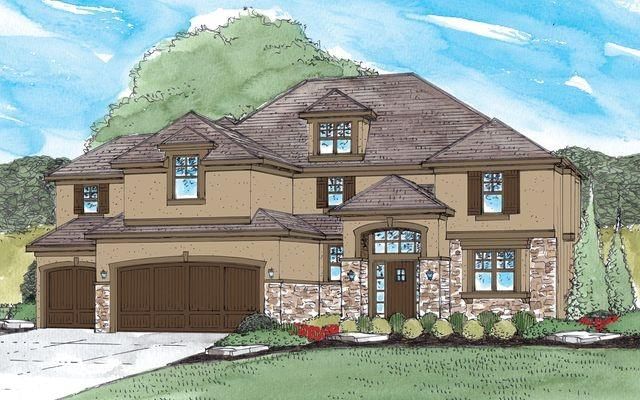
2623 SW Barley Field Drive, Lee's Summit, MO


419 NW TIMBERBROOKE Drive, Lee's Summit, MO
New · 4d ago


1517 NE Deer Court, Lee's Summit, MO
New · 5d ago
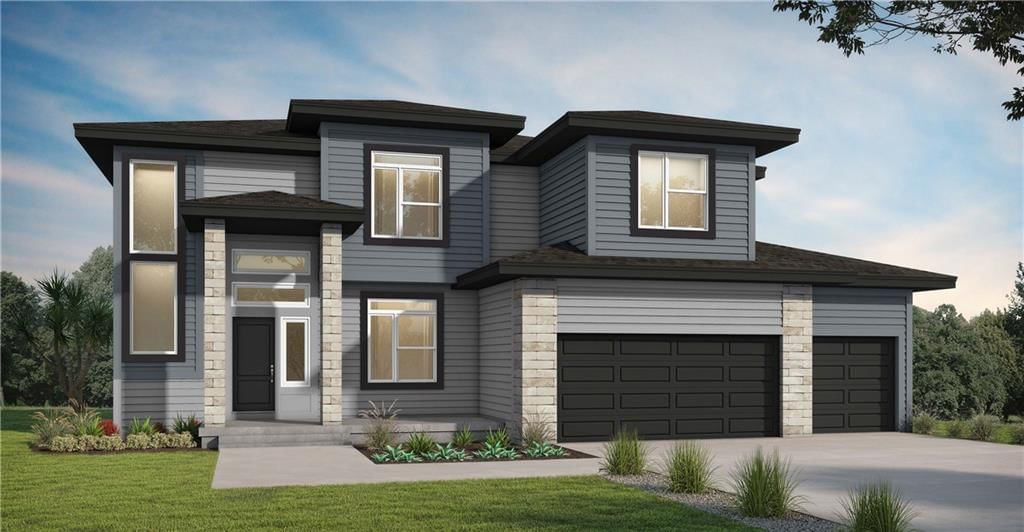

1513 SE Rising Sun Drive, Lee's Summit, MO

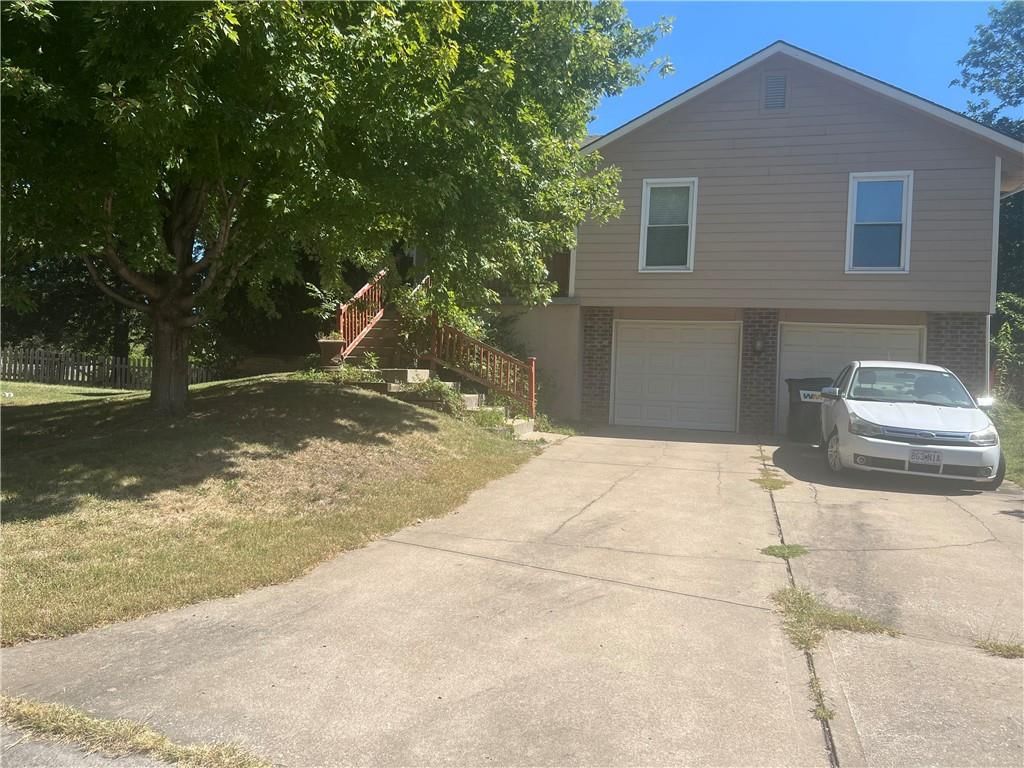

1211 Banner Court, Lee's Summit, MO
New · 6d ago


1100 NE Goshen Court, Lee's Summit, MO


1515 SW Arbor Falls Drive, Lee's Summit, MO

27007 E Olive Drive, Lee's Summit, MO


3357 SW JESSIE Lane, Lee's Summit, MO


1013 SE Greenridge Drive, Lee's Summit, MO


1600 Hedgewood Lane, Lee's Summit, MO


1809 NE Gatewood Drive, Lee's Summit, MO


2558 NE Dale Hunter Lane, Lee's Summit, MO


1209 SW 40TH Street, Lee's Summit, MO


803 NE Balboa Street, Lee's Summit, MO


413 SE Annette Street, Lee's Summit, MO


1725 NE NINE OAKS Drive, Lee's Summit, MO


820 SE 11th Terrace, Lee's Summit, MO

1207 SE Windbreak Drive, Lee's Summit, MO

1413 SE Vantage Drive, Lee's Summit, MO


12905 Quail Ridge, Lee's Summit, MO


210 SW 5th Street, Lee's Summit, MO


5913 NE Coral Circle, Lee's Summit, MO


1604 SW 27th Street, Lee's Summit, MO
About Homes Under Contract inLee's Summit, MO
Lee's Summit, MO has 250 homes under contract right now, with a median list price of $530,000 as of Sep 16 These homes under contract were built between 1905 and 2027, ranging from 1,072 to 6,398 square feet.
Homes Under Contract market trendsLee's Summit, MO
Lee's Summit, MO: 372 homes for sale · 48 new in the last 7 days · median asking $530,000 · 150 price reductions · a median of 16 days to contract. 149 homes closed in the last 30 days, at a median of $420,000. At the pace of the last 90 days that is 2.33 months of supply.
| Measure | Aug 2026 |
|---|---|
| Median sale price | $422,500 |
| Median price per sq ft | $183 |
| Median days to contract | 17 |
| Sell-to-list ratio | 100% |
| Homes sold | 148 |
| New listings | 185 |
| Went under contract | 170 |
Homes Under Contract FAQsLee's Summit, MO
How many homes under contract are there in Lee's Summit, MO?
What is the median list price of homes under contract in Lee's Summit, MO?
Schoolsserving Lee's Summit
| School | Median list | |
|---|---|---|
| School districts | ||
| Lee's Summit School District | $480,388 | |
| Blue Springs School District | $575,000 | |
| Raymore-Peculiar School District | Median— | |
| High schools | ||
| Lee's Summit | $382,218 | |
| Lee's Summit West | $569,000 | |
| Lee's Summit North | $399,950 | |
| Blue Springs South | $607,500 | |
| Blue Springs | Median— | |
| Raymore-Peculiar | Median— | |
| Middle schools | ||
| Summit Lakes | $565,000 | |
| Pleasant Lea | $462,500 | |
| Bernard Campbell | $417,500 | |
How we compute these
- Median list.
- The middle asking price among the homes for sale right now. Half are listed above it, half below.
- For sale.
- Homes listed as active right now. A live count, not a monthly average.
Newly listedin Lee's Summit, MO
| Address | Price |
|---|---|
| 4813 NE Freehold Court | Price$659,000 |
| 406 Forest Avenue | Price$215,000 |
| 4808 NE PEBBLE BEACH Street | Price$440,000 |
| 2606 SW Barley Field Drive | Price$659,997 |
| 6125 NE Moonstone Court | Price$225,000 |
| 3813 SW Maryville Place | Price$415,000 |
| 317 SE Grand Avenue | Price$495,000 |
| 1129 SE 11th Street | Price$398,000 |
| 12608 S Parkwood Lane | Price$412,611 |
| 12606 S Parkwood Lane | Price$459,753 |
| 503 SE 3rd Street | Price$349,000 |
| 4413 SW Hillside Drive | Price$369,900 |
Recently went under contractin Lee's Summit, MO
| Address | List price |
|---|---|
| 1100 NE Goshen Court | List price$689,900 |
| 820 SE 11th Terrace | List price$419,500 |
| 2818 NE WOOD CREEK Lane | List price$685,000 |
| 418 SW Sunset Drive | List price$210,000 |
| 1517 NE Deer Court | List price$365,000 |
| 1600 Hedgewood Lane | List price$735,000 |
| 512 Canterbury Lane | List price$484,900 |
| 812 SW Nautica Court | List price$459,900 |
| 4614 NE Park Springs Court | List price$1,050,000 |
| 3812 SW Lido Drive | List price$409,500 |
| 1515 SW Arbor Falls Drive | List price$500,000 |
| 1013 SE Greenridge Drive | List price$435,000 |
How we compute these
- Under contract.
- Homes with an accepted contract that have not closed yet. A live count.
- Days to contract.
- The middle number of days between a home being listed and going under contract, over the last 90 days of closings. It is not days-to-close, and it is not how long today's listings have been sitting. Newly built homes are excluded, because a build finishing is not a market moving.
Popular home searchesin Lee's Summit
| Search | For sale |
|---|---|
| Open houses | 43 |
| Luxury homes | 16 |
| Just listed homes | 46 |
| Price-reduced homes | 146 |
| Coming soon homes | 33 |
| Homes under contract | 250 |
How we compute these
- For sale.
- Homes listed as active right now. A live count, not a monthly average.
Homes by pricein Lee's Summit
How we compute these
- For sale.
- Homes listed as active right now. A live count, not a monthly average.
Homes by featurein Lee's Summit
How we compute these
- For sale.
- Homes listed as active right now. A live count, not a monthly average.
Search by property typein Lee's Summit
| Property type | Median sale |
|---|---|
| Single Family | $431,500 |
| Townhouse | $274,327 |
| Villa | Median— |
| Condo / Loft | Median— |
| Duplex | Median— |
| Quadruplex | Median— |
| Lots / Land | $198,250 |
How we compute these
- Market.
- Market type is set by months of supply — how long it would take to sell every home for sale at the current pace. Under ~4 months favors sellers (low inventory, faster sales, homes near or above asking); over ~6 favors buyers (more choice, more negotiating room). 4–6 is balanced.
- Months supply.
- How many months it would take to sell every home now for sale at the pace of the last 90 days: homes for sale ÷ (closings in the last 90 days ÷ 3).
- For sale.
- Homes listed as active right now. A live count, not a monthly average.
- Days to contract.
- The middle number of days between a home being listed and going under contract, over the last 90 days of closings. It is not days-to-close, and it is not how long today's listings have been sitting. Newly built homes are excluded, because a build finishing is not a market moving.
- Coming soon.
- Homes announced but not yet accepting showings. A live count.
- Under contract.
- Homes with an accepted contract that have not closed yet. A live count.
Nearby neighborhoodsto Lee's Summit
| Neighborhood | Median sale |
|---|---|
| Lakewood | $500,000 |
| Eagle Creek | $461,000 |
| Woodlawn Estates | $332,964 |
| Condos of Oaks Ridge Meadows | $210,000 |
| Highland Meadows | $544,107 |
| Raintree Lake | $433,000 |
How we compute these
- Market.
- Market type is set by months of supply — how long it would take to sell every home for sale at the current pace. Under ~4 months favors sellers (low inventory, faster sales, homes near or above asking); over ~6 favors buyers (more choice, more negotiating room). 4–6 is balanced.
- Months supply.
- How many months it would take to sell every home now for sale at the pace of the last 90 days: homes for sale ÷ (closings in the last 90 days ÷ 3).
- For sale.
- Homes listed as active right now. A live count, not a monthly average.
- Days to contract.
- The middle number of days between a home being listed and going under contract, over the last 90 days of closings. It is not days-to-close, and it is not how long today's listings have been sitting. Newly built homes are excluded, because a build finishing is not a market moving.
- Coming soon.
- Homes announced but not yet accepting showings. A live count.
- Under contract.
- Homes with an accepted contract that have not closed yet. A live count.
Search homesnearby Lee's Summit
| Place | Median list |
|---|---|
| Lee's Summit | $530,000 |
| Kansas City | $259,974 |
| Independence | $224,900 |
| Blue Springs | $399,900 |
| Raytown | $237,000 |
| Grandview | $276,500 |
How we compute these
- Market.
- Market type is set by months of supply — how long it would take to sell every home for sale at the current pace. Under ~4 months favors sellers (low inventory, faster sales, homes near or above asking); over ~6 favors buyers (more choice, more negotiating room). 4–6 is balanced.
- Months supply.
- How many months it would take to sell every home now for sale at the pace of the last 90 days: homes for sale ÷ (closings in the last 90 days ÷ 3).
- Median list.
- The middle asking price among the homes for sale right now. Half are listed above it, half below.
- Days to contract.
- The middle number of days between a home being listed and going under contract, over the last 90 days of closings. It is not days-to-close, and it is not how long today's listings have been sitting. Newly built homes are excluded, because a build finishing is not a market moving.
- For sale.
- Homes listed as active right now. A live count, not a monthly average.
- Coming soon.
- Homes announced but not yet accepting showings. A live count.
- Under contract.
- Homes with an accepted contract that have not closed yet. A live count.
NearbyZIP codes
| Place | Median list |
|---|---|
| 64083 | $394,605 |
| 64086 | $400,000 |
| 64064 | $547,500 |
| 64081 | $495,000 |
| 64063 | $365,000 |
| 64082 | $597,000 |
| 64062 | $200,000 |
How we compute these
- Market.
- Market type is set by months of supply — how long it would take to sell every home for sale at the current pace. Under ~4 months favors sellers (low inventory, faster sales, homes near or above asking); over ~6 favors buyers (more choice, more negotiating room). 4–6 is balanced.
- Months supply.
- How many months it would take to sell every home now for sale at the pace of the last 90 days: homes for sale ÷ (closings in the last 90 days ÷ 3).
- Median list.
- The middle asking price among the homes for sale right now. Half are listed above it, half below.
- Days to contract.
- The middle number of days between a home being listed and going under contract, over the last 90 days of closings. It is not days-to-close, and it is not how long today's listings have been sitting. Newly built homes are excluded, because a build finishing is not a market moving.
- For sale.
- Homes listed as active right now. A live count, not a monthly average.
- Coming soon.
- Homes announced but not yet accepting showings. A live count.
- Under contract.
- Homes with an accepted contract that have not closed yet. A live count.
Search homes for salein every city we cover
How we compute these
- Market.
- Market type is set by months of supply — how long it would take to sell every home for sale at the current pace. Under ~4 months favors sellers (low inventory, faster sales, homes near or above asking); over ~6 favors buyers (more choice, more negotiating room). 4–6 is balanced.
- Months supply.
- How many months it would take to sell every home now for sale at the pace of the last 90 days: homes for sale ÷ (closings in the last 90 days ÷ 3).
- Median list.
- The middle asking price among the homes for sale right now. Half are listed above it, half below.
- Days to contract.
- The middle number of days between a home being listed and going under contract, over the last 90 days of closings. It is not days-to-close, and it is not how long today's listings have been sitting. Newly built homes are excluded, because a build finishing is not a market moving.
- For sale.
- Homes listed as active right now. A live count, not a monthly average.
- Coming soon.
- Homes announced but not yet accepting showings. A live count.
- Under contract.
- Homes with an accepted contract that have not closed yet. A live count.
Search for homesin popular markets
| Market | For sale |
|---|---|
| Heritage Ranch | 28 |
| Ruskin Heights | 25 |
| Canyon Lakes | 25 |
| Garrett Ranch | 24 |
| Tomahawk Valley | 23 |
| Seven Bridges | 23 |
How we compute these
- Market.
- Market type is set by months of supply — how long it would take to sell every home for sale at the current pace. Under ~4 months favors sellers (low inventory, faster sales, homes near or above asking); over ~6 favors buyers (more choice, more negotiating room). 4–6 is balanced.
- For sale.
- Homes listed as active right now. A live count, not a monthly average.
Or go wider stillcounty, metro and state
How we compute these
- Market.
- Market type is set by months of supply — how long it would take to sell every home for sale at the current pace. Under ~4 months favors sellers (low inventory, faster sales, homes near or above asking); over ~6 favors buyers (more choice, more negotiating room). 4–6 is balanced.
- Months supply.
- How many months it would take to sell every home now for sale at the pace of the last 90 days: homes for sale ÷ (closings in the last 90 days ÷ 3).
- Median list.
- The middle asking price among the homes for sale right now. Half are listed above it, half below.
- Days to contract.
- The middle number of days between a home being listed and going under contract, over the last 90 days of closings. It is not days-to-close, and it is not how long today's listings have been sitting. Newly built homes are excluded, because a build finishing is not a market moving.
- For sale.
- Homes listed as active right now. A live count, not a monthly average.
- Coming soon.
- Homes announced but not yet accepting showings. A live count.
- Under contract.
- Homes with an accepted contract that have not closed yet. A live count.