
Overland Park, KS Real Estate & Homes For Sale
467 homes for sale in Overland Park · Sorted by Newest Listed


7426 Beverly Street, Overland Park, KS
New · 1d ago

9800 Walmer Street, Overland Park, KS
New · 1d ago


13701 Gillette Street, Overland Park, KS
New · 2d ago
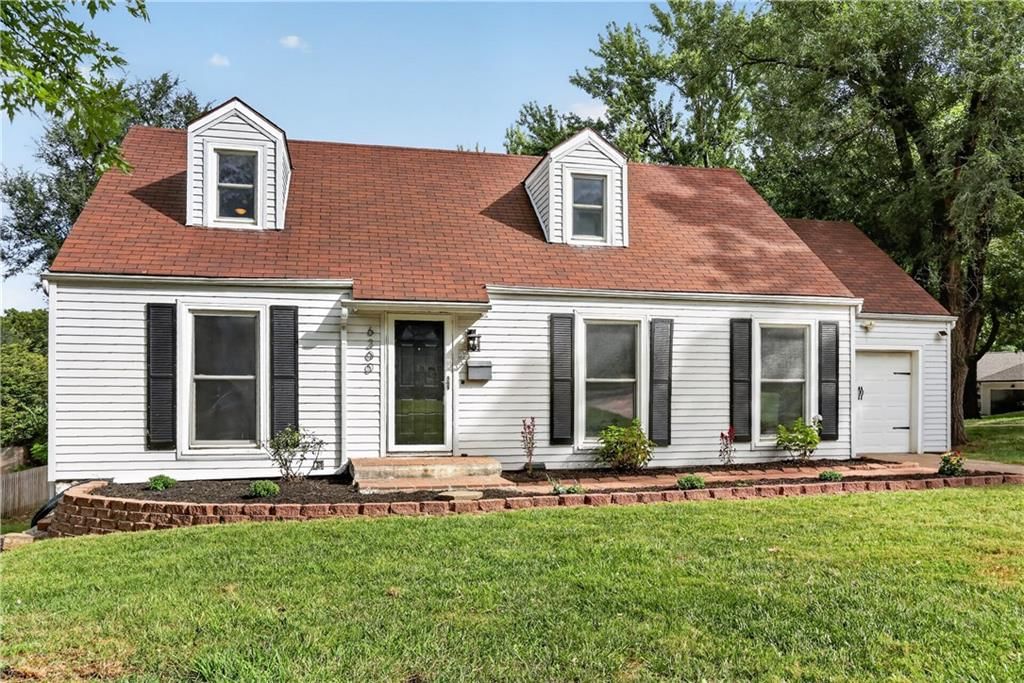
6300 W 80th Terrace, Overland Park, KS
New · 2d ago


8007 W 148th Terrace, Overland Park, KS
New · 2d ago


17805 Bond Avenue, Overland Park, KS
New · 2d ago


6937 Walmer Street, Overland Park, KS
New · 3d ago

5320 W 160 Street, Overland Park, KS
New · 3d ago


10401 Long Street, Overland Park, KS
New · 4d ago

7101 Marty Street, Overland Park, KS
New · 4d ago


6801 W 101st Terrace, Overland Park, KS
New · 4d ago

13309 W 116th Street, Overland Park, KS
New · 4d ago

10004 W 123rd Street, Overland Park, KS
New · 4d ago

13115 W 178th Terrace, Overland Park, KS
New · 4d ago

13107 W 178th Terrace, Overland Park, KS
New · 4d ago

13111 W 178th Terrace, Overland Park, KS
New · 4d ago


10780 Oakmont Street, Overland Park, KS
New · 5d ago


4922 W 155 Terrace, Overland Park, KS
New · 5d ago


8727 W 104th Street, Overland Park, KS
New · 5d ago


12836 110 Terrace, Overland Park, KS
New · 5d ago


18609 Mohawk Lane, Overland Park, KS
New · 5d ago


18600 Mohawk Lane, Overland Park, KS
New · 5d ago


7001 W 68th Street, Overland Park, KS
New · 5d ago


8921 CONSER Drive, Overland Park, KS
New · 5d ago
Start withthe numbers that matter to you
Overland Park offers 467 homes for sale with a median list price near $757K as of Sep 16, a patient 63-day market, and some of Johnson County's best schools — serious value for a top-tier suburb.
Real estate inOverland Park, Kansas
Overland Park, KS has about 82,965 households and a median household income of $103,838. Roughly 62% of homes are owner-occupied, the median owner's home value is $384,400, 63% of adults hold a bachelor's degree or higher. The average commute runs 19.9 minutes. The Census counts 197,199 residents. New construction is still adding supply: 17 building permits were issued in 2026-07.
The honest answer for anyone sizing up Overland Park right now: this is not a panic-buy or panic-sell market. With 467 active listings and homes averaging 63 days before going under contract, buyers have real room to look around, ask questions, and negotiate — something that felt impossible a few years ago. Sellers who price correctly still move product, but the days of throwing any number on a sign and getting five offers by Sunday are largely over. That reset is actually healthy, and for a city this desirable, it means the fundamentals — schools, location, amenities — are doing the heavy lifting again.
At a median list price of $756,900 as of Sep 16 and an average of $248 per square foot, Overland Park sits in premium territory for the Kansas City metro. That number reflects real square footage and real finishes, not Manhattan math. A buyer getting a home at or below $248 per square foot in a move-in-ready subdivision is doing fine. A seller pricing above that without a genuinely upgraded kitchen, a larger lot, or a coveted school boundary is going to feel those 63 days stretch longer. The price-per-foot benchmark is one of the most useful gut checks in this market.
The subdivisions worth knowing each have a personality. Wild Horse and Riverstone Valley attract buyers who want newer construction with open floor plans and HOA amenities that actually get used. Chapel Hill and Mission Ranch tend to draw families planting long-term roots — good lot sizes, established trees, and strong resale history. Sundance Ridge and Archers Landing offer that slightly elevated, executive-home feel without crossing into Leawood price territory. Century Farms and Terrybrook Farms are among the newer master-planned communities where buyers are getting fresh builds, though some of those lots are tighter than the price tag might suggest. Southern Meadows rounds out the mix for buyers who want value without sacrificing the Overland Park zip code.
Overland Park runs on Blue Valley and Blue Valley Northwest schools, and that is not an accident — it is the single biggest reason families choose this city over comparable suburbs. The Blue Valley district consistently ranks among the best in Kansas, and buyers paying a premium near the 135th Street corridor or further south toward 167th are often paying specifically for that boundary. Commute-wise, the 69 Highway and I-435 corridors connect residents to downtown Kansas City in 25 to 40 minutes depending on where they land, and the city's internal infrastructure — Town Center, the Promenade, Scheels, a legitimate restaurant scene — means many residents rarely feel the need to leave. It is a suburb that earns its reputation.
For buyers: more inventory and longer days on market mean leverage exists, especially on homes that have had a price reduction or sat past 45 days. Do not ignore those — the stigma is often undeserved. For sellers: correct pricing from day one is everything right now. Overpricing by even 5 percent in this environment leads to the kind of extended market time that makes subsequent buyers wonder what is wrong with the house. Price it sharp, present it well, and the demand for a well-located Overland Park home is absolutely still there.
Sources — demographics: U.S. Census Bureau, American Community Survey 5-year estimates (2023) · listings, prices and days on market: Heartland MLS as distributed by MLS GRID, as of September 17, 2026 · analysis and home values: HouseLoop calculations
Housing market trendsin Overland Park, Kansas
Overland Park, KS: 391 homes for sale · 66 new in the last 7 days · median asking $769,950 · 115 price reductions · a median of 14 days to contract. 212 homes closed in the last 30 days, at a median of $530,000. At the pace of the last 90 days that is 1.52 months of supply.
| Measure | Aug 2026 |
|---|---|
| Median sale price | $499,950 |
| Median price per sq ft | $203 |
| Median days to contract | 17 |
| Sell-to-list ratio | 100% |
| Homes sold | 256 |
| New listings | 247 |
| Went under contract | 230 |
Real estateFAQs about Overland Park
How many homes are for sale in Overland Park?
How much does a home in Overland Park cost?
What is the price per square foot in Overland Park?
How fast do homes sell in Overland Park?
How many homes have sold in Overland Park in the past year?
When were the homes in Overland Park built?
What are the newest homes for sale in Overland Park?
Are there older homes for sale in Overland Park?
How big are the homes for sale in Overland Park?
How big are the lots in Overland Park?
How many bedrooms do homes in Overland Park have?
Do homes in Overland Park have HOA fees?
Are there single-story homes for sale in Overland Park?
Are there homes with a pool in Overland Park?
What kind of garages do homes in Overland Park have?
What schools serve Overland Park?
Schoolsserving Overland Park
How we compute these
- Median list.
- The middle asking price among the homes for sale right now. Half are listed above it, half below.
- For sale.
- Homes listed as active right now. A live count, not a monthly average.
Newly listedin Overland Park, KS
| Address | Price |
|---|---|
| 12514 W 184th Terrace | Price$995,500 |
| 18613 Mohawk Lane | Price$876,270 |
| 6133 Floyd Street | Price$309,900 |
| 8227 Santa Fe Drive | Price$139,000 |
| 10106 W 96th-#C Terrace | Price$155,000 |
| 7426 Beverly Street | Price$290,000 |
| 6937 Walmer Street | Price$309,900 |
| 6801 W 101st Terrace | Price$250,000 |
| 13115 W 178th Terrace | Price$543,649 |
| 13107 W 178th Terrace | Price$525,707 |
| 13111 W 178th Terrace | Price$552,254 |
| 8727 W 104th Street | Price$374,900 |
Recently went under contractin Overland Park, KS
| Address | List price |
|---|---|
| 12008 W 174 Street | List price$1,161,477 |
| 13300 W 174th Place | List price$585,000 |
| 10215 Conser Street | List price$210,000 |
| 15924 Buena Vista Street | List price$487,000 |
| 9534 Connell Drive | List price$390,000 |
| 8929 W 106 Terrace | List price$180,000 |
| 9102 W 81st Terrace | List price$350,000 |
| 11740 Oakmont Street | List price$310,000 |
| 8018 W 122nd Terrace | List price$545,000 |
| 14724 Wedd Street | List price$780,000 |
| 9912 Oakridge Drive | List price$350,000 |
| 11827 Slater Street | List price$399,000 |
How we compute these
- Under contract.
- Homes with an accepted contract that have not closed yet. A live count.
- Days to contract.
- The middle number of days between a home being listed and going under contract, over the last 90 days of closings. It is not days-to-close, and it is not how long today's listings have been sitting. Newly built homes are excluded, because a build finishing is not a market moving.
Popular home searchesin Overland Park
| Search | For sale |
|---|---|
| Open houses | 66 |
| Luxury homes | 103 |
| Just listed homes | 60 |
| Price-reduced homes | 115 |
| Coming soon homes | 81 |
| Homes under contract | 308 |
How we compute these
- For sale.
- Homes listed as active right now. A live count, not a monthly average.
Homes by pricein Overland Park
How we compute these
- For sale.
- Homes listed as active right now. A live count, not a monthly average.
Homes by featurein Overland Park
How we compute these
- For sale.
- Homes listed as active right now. A live count, not a monthly average.
Search by property typein Overland Park
| Property type | Median sale |
|---|---|
| Single Family | $545,000 |
| Townhouse | $325,000 |
| Villa | Median— |
| Condo / Loft | $186,500 |
| Half Duplex | Median— |
| Lots / Land | $475,000 |
How we compute these
- Market.
- Market type is set by months of supply — how long it would take to sell every home for sale at the current pace. Under ~4 months favors sellers (low inventory, faster sales, homes near or above asking); over ~6 favors buyers (more choice, more negotiating room). 4–6 is balanced.
- Months supply.
- How many months it would take to sell every home now for sale at the pace of the last 90 days: homes for sale ÷ (closings in the last 90 days ÷ 3).
- For sale.
- Homes listed as active right now. A live count, not a monthly average.
- Days to contract.
- The middle number of days between a home being listed and going under contract, over the last 90 days of closings. It is not days-to-close, and it is not how long today's listings have been sitting. Newly built homes are excluded, because a build finishing is not a market moving.
- Coming soon.
- Homes announced but not yet accepting showings. A live count.
- Under contract.
- Homes with an accepted contract that have not closed yet. A live count.
Nearby neighborhoodsto Overland Park
| Neighborhood | Median sale |
|---|---|
| Nall Hills | $425,000 |
| Cherokee Hills | $365,000 |
| Chapel Hill | $748,180 |
| Quivira Falls | $251,675 |
| Oak Park | $413,000 |
| Terrybrook Farms | $1,149,500 |
How we compute these
- Market.
- Market type is set by months of supply — how long it would take to sell every home for sale at the current pace. Under ~4 months favors sellers (low inventory, faster sales, homes near or above asking); over ~6 favors buyers (more choice, more negotiating room). 4–6 is balanced.
- Months supply.
- How many months it would take to sell every home now for sale at the pace of the last 90 days: homes for sale ÷ (closings in the last 90 days ÷ 3).
- For sale.
- Homes listed as active right now. A live count, not a monthly average.
- Days to contract.
- The middle number of days between a home being listed and going under contract, over the last 90 days of closings. It is not days-to-close, and it is not how long today's listings have been sitting. Newly built homes are excluded, because a build finishing is not a market moving.
- Coming soon.
- Homes announced but not yet accepting showings. A live count.
- Under contract.
- Homes with an accepted contract that have not closed yet. A live count.
Search homesnearby Overland Park
| Place | Median list |
|---|---|
| Overland Park | $756,900 |
| Olathe | $635,300 |
| Shawnee | $572,000 |
| Lenexa | $651,475 |
| Leawood | $979,950 |
| Prairie Village | $1,195,000 |
How we compute these
- Market.
- Market type is set by months of supply — how long it would take to sell every home for sale at the current pace. Under ~4 months favors sellers (low inventory, faster sales, homes near or above asking); over ~6 favors buyers (more choice, more negotiating room). 4–6 is balanced.
- Months supply.
- How many months it would take to sell every home now for sale at the pace of the last 90 days: homes for sale ÷ (closings in the last 90 days ÷ 3).
- Median list.
- The middle asking price among the homes for sale right now. Half are listed above it, half below.
- Days to contract.
- The middle number of days between a home being listed and going under contract, over the last 90 days of closings. It is not days-to-close, and it is not how long today's listings have been sitting. Newly built homes are excluded, because a build finishing is not a market moving.
- For sale.
- Homes listed as active right now. A live count, not a monthly average.
- Coming soon.
- Homes announced but not yet accepting showings. A live count.
- Under contract.
- Homes with an accepted contract that have not closed yet. A live count.
NearbyZIP codes
| Place | Median list |
|---|---|
| 66212 | $362,500 |
| 66221 | $956,889 |
| 66213 | $550,000 |
| 66223 | $812,000 |
| 66204 | $315,000 |
| 66210 | $265,000 |
| 66207 | $500,000 |
| 66085 | $750,000 |
| 66214 | $357,500 |
| 66013 | $850,000 |
How we compute these
- Market.
- Market type is set by months of supply — how long it would take to sell every home for sale at the current pace. Under ~4 months favors sellers (low inventory, faster sales, homes near or above asking); over ~6 favors buyers (more choice, more negotiating room). 4–6 is balanced.
- Months supply.
- How many months it would take to sell every home now for sale at the pace of the last 90 days: homes for sale ÷ (closings in the last 90 days ÷ 3).
- Median list.
- The middle asking price among the homes for sale right now. Half are listed above it, half below.
- Days to contract.
- The middle number of days between a home being listed and going under contract, over the last 90 days of closings. It is not days-to-close, and it is not how long today's listings have been sitting. Newly built homes are excluded, because a build finishing is not a market moving.
- For sale.
- Homes listed as active right now. A live count, not a monthly average.
- Coming soon.
- Homes announced but not yet accepting showings. A live count.
- Under contract.
- Homes with an accepted contract that have not closed yet. A live count.
Search homes for salein every city we cover
How we compute these
- Market.
- Market type is set by months of supply — how long it would take to sell every home for sale at the current pace. Under ~4 months favors sellers (low inventory, faster sales, homes near or above asking); over ~6 favors buyers (more choice, more negotiating room). 4–6 is balanced.
- Months supply.
- How many months it would take to sell every home now for sale at the pace of the last 90 days: homes for sale ÷ (closings in the last 90 days ÷ 3).
- Median list.
- The middle asking price among the homes for sale right now. Half are listed above it, half below.
- Days to contract.
- The middle number of days between a home being listed and going under contract, over the last 90 days of closings. It is not days-to-close, and it is not how long today's listings have been sitting. Newly built homes are excluded, because a build finishing is not a market moving.
- For sale.
- Homes listed as active right now. A live count, not a monthly average.
- Coming soon.
- Homes announced but not yet accepting showings. A live count.
- Under contract.
- Homes with an accepted contract that have not closed yet. A live count.
Search for homesin popular markets
| Market | For sale |
|---|---|
| Heritage Ranch | 28 |
| Ruskin Heights | 25 |
| Canyon Lakes | 25 |
| Garrett Ranch | 24 |
| Tomahawk Valley | 23 |
| Seven Bridges | 23 |
How we compute these
- Market.
- Market type is set by months of supply — how long it would take to sell every home for sale at the current pace. Under ~4 months favors sellers (low inventory, faster sales, homes near or above asking); over ~6 favors buyers (more choice, more negotiating room). 4–6 is balanced.
- For sale.
- Homes listed as active right now. A live count, not a monthly average.
Or go wider stillcounty, metro and state
How we compute these
- Market.
- Market type is set by months of supply — how long it would take to sell every home for sale at the current pace. Under ~4 months favors sellers (low inventory, faster sales, homes near or above asking); over ~6 favors buyers (more choice, more negotiating room). 4–6 is balanced.
- Months supply.
- How many months it would take to sell every home now for sale at the pace of the last 90 days: homes for sale ÷ (closings in the last 90 days ÷ 3).
- Median list.
- The middle asking price among the homes for sale right now. Half are listed above it, half below.
- Days to contract.
- The middle number of days between a home being listed and going under contract, over the last 90 days of closings. It is not days-to-close, and it is not how long today's listings have been sitting. Newly built homes are excluded, because a build finishing is not a market moving.
- For sale.
- Homes listed as active right now. A live count, not a monthly average.
- Coming soon.
- Homes announced but not yet accepting showings. A live count.
- Under contract.
- Homes with an accepted contract that have not closed yet. A live count.