
Wilderness- Parkview at the, Overland Park KS Real Estate & Homes For Sale
3 homes in Wilderness- Parkview at the · Sorted by Newest Listed
No homes for sale in Wilderness- Parkview at the right now — showing recently sold & under contract.
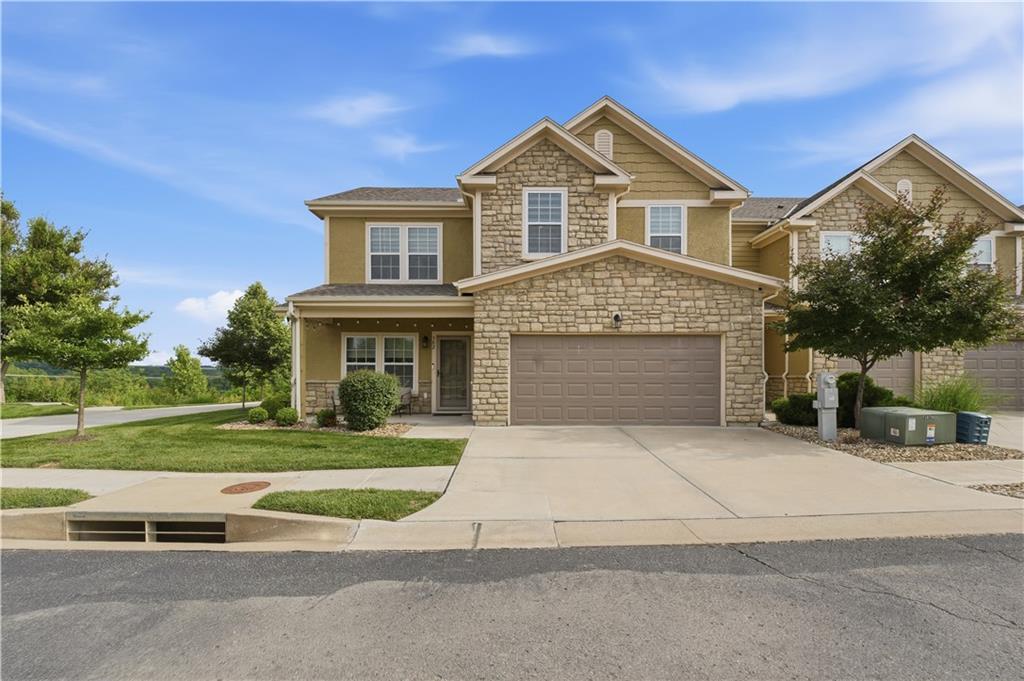
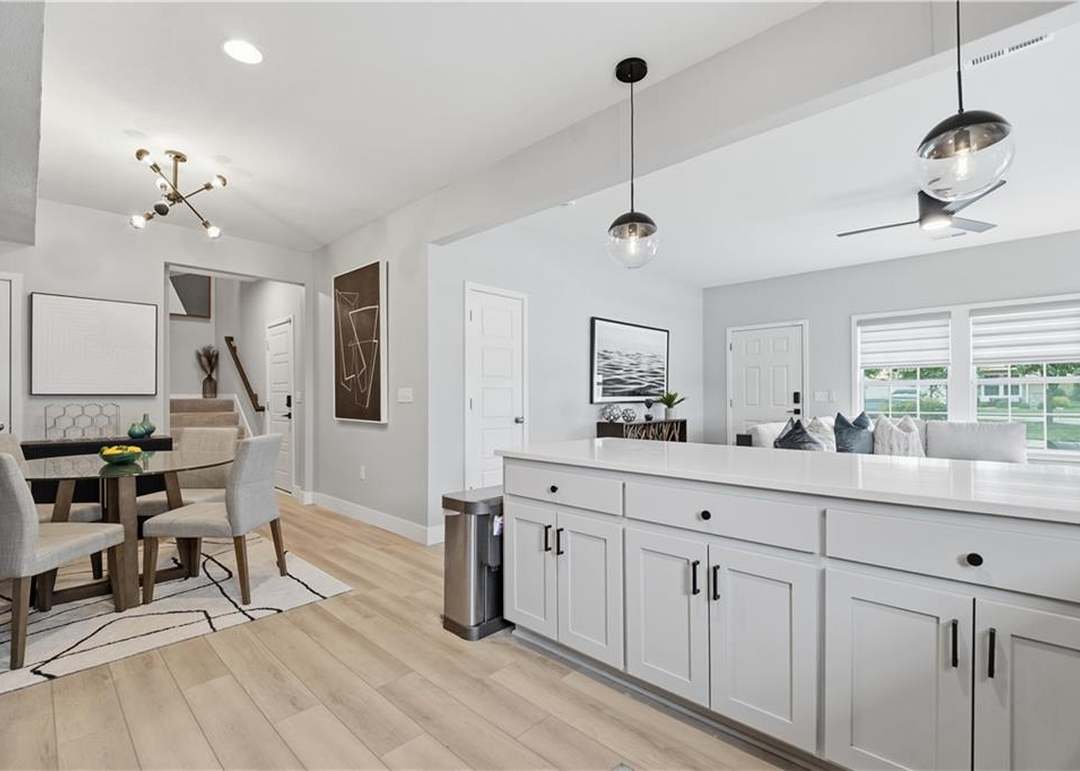
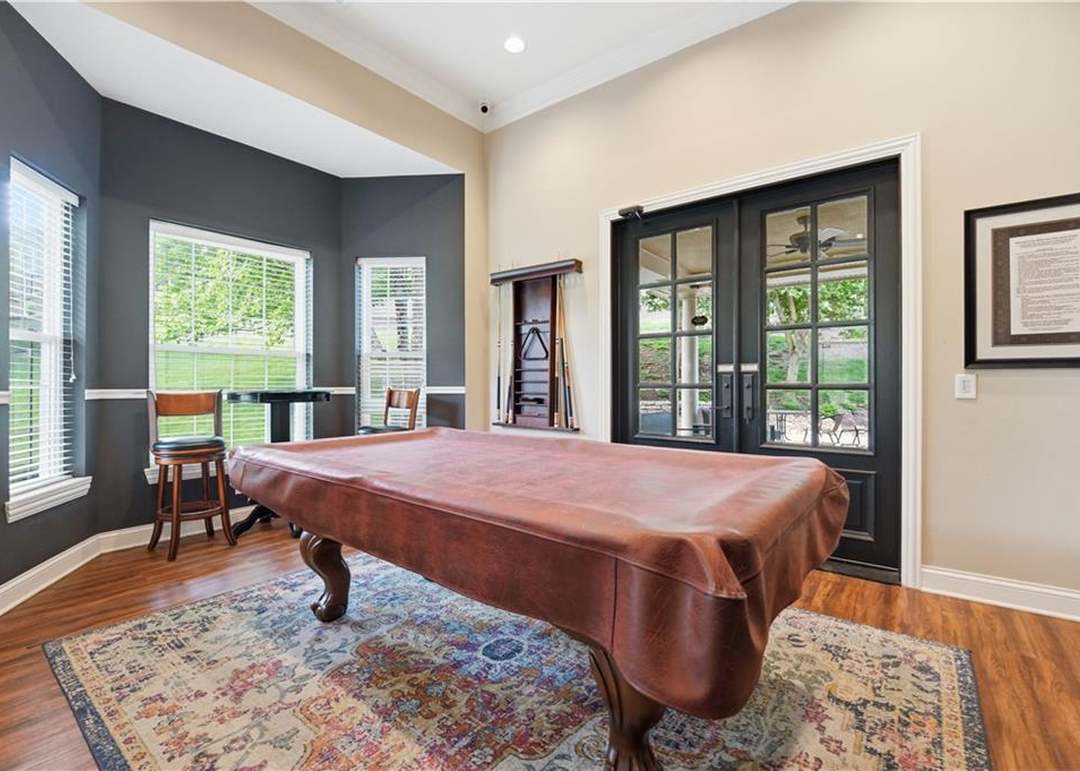
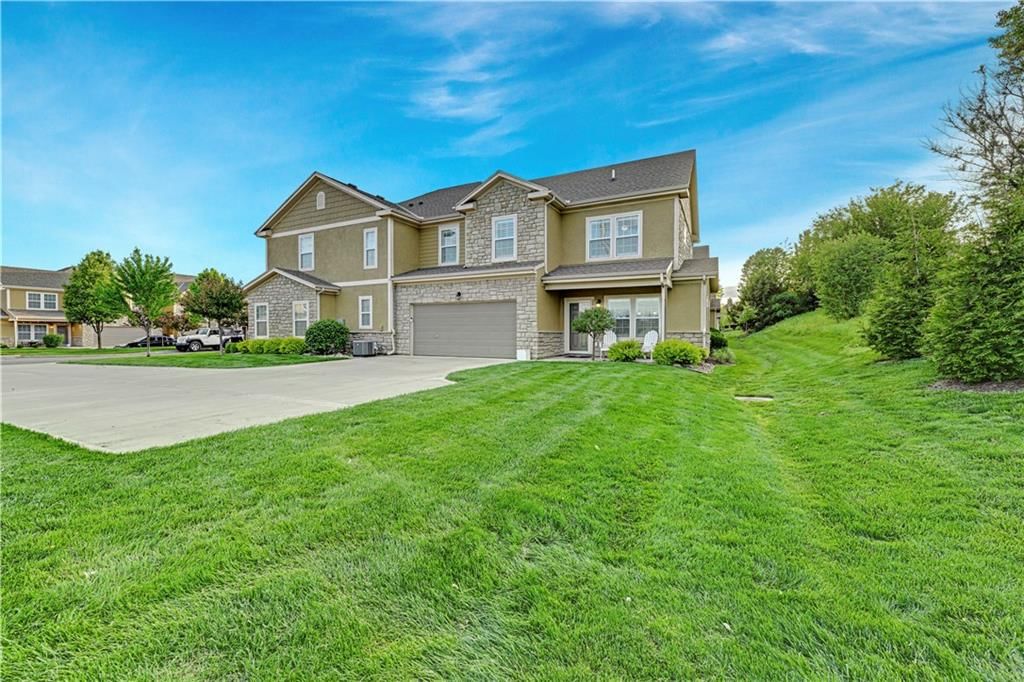
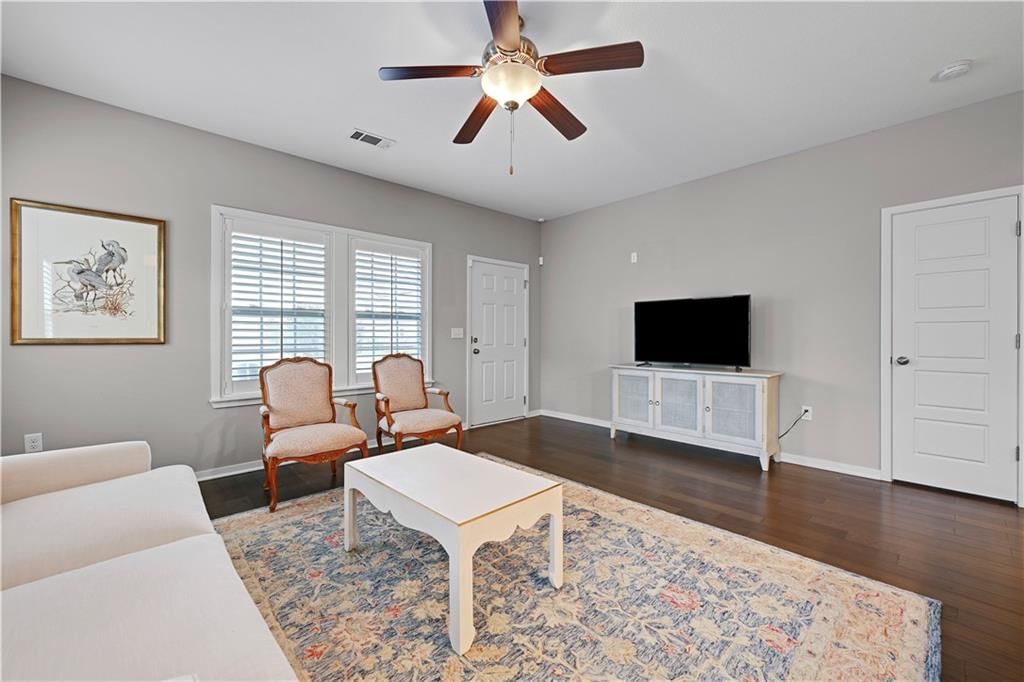
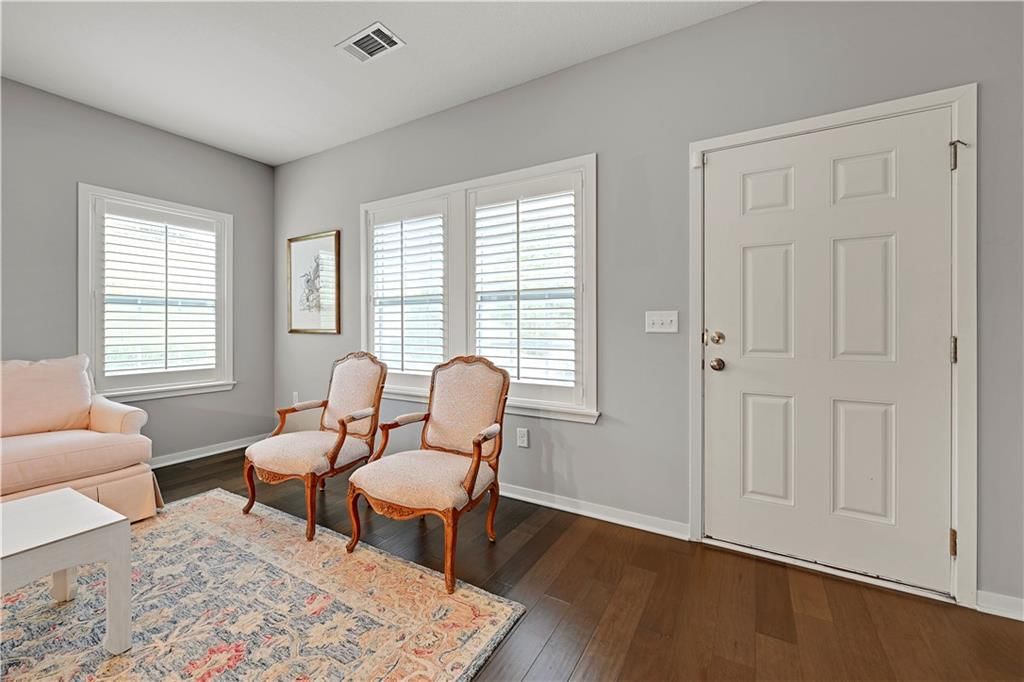
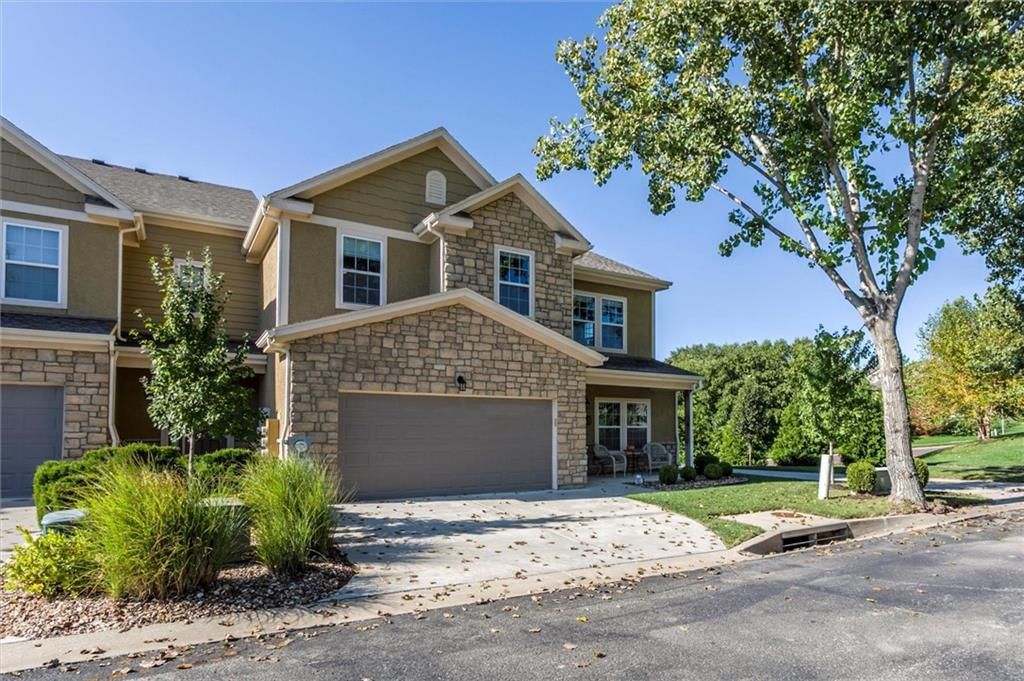
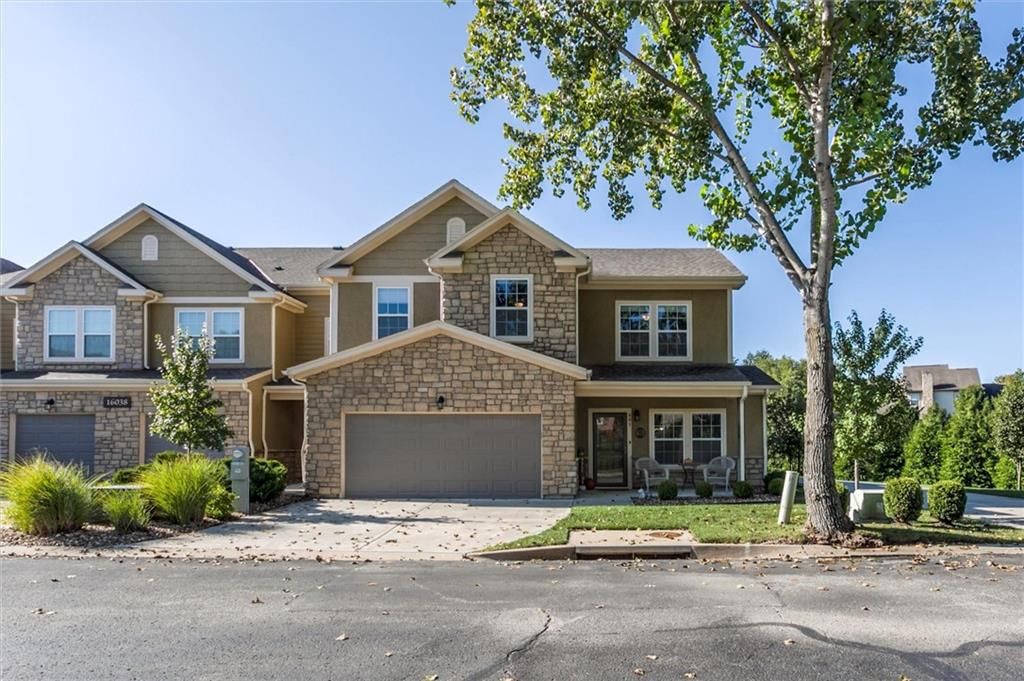
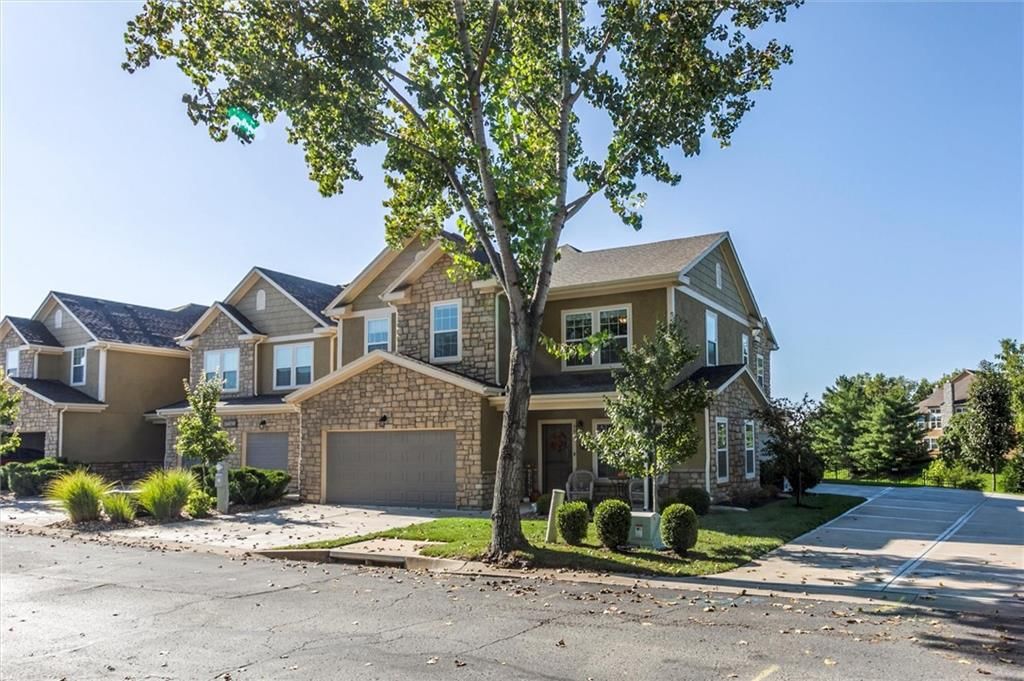
Start with the numbers that matter to you
Real estate in Wilderness- Parkview at the, Overland Park, Kansas
Wilderness- Parkview at the, Overland Park has 0 homes for sale right now.
Sources — listings, prices and days on market: Heartland MLS as distributed by MLS GRID, as of October 5, 2026 · analysis and home values: HouseLoop calculations
Housing market trends in Wilderness- Parkview at the, Overland Park, Kansas
As of Oct 5, 2026, Wilderness- Parkview at the, Overland Park: 0 homes for sale.
| Measure | Oct 2025 | Sep 2025 | Oct 2024 | Change |
|---|---|---|---|---|
| Homes sold | 3 | 3 | 2 | +50% |
| New listings | 3 | 4 | 2 | +50% |
| Went under contract | 2 | 3 | 2 | 0% |
Real estate FAQs about Wilderness- Parkview at the
How many homes are for sale in Wilderness- Parkview at the, Overland Park?
How many homes have sold in Wilderness- Parkview at the, Overland Park in the past year?
② Its neighborhoods — one step out
Nearby neighborhoods to Wilderness- Parkview at the
| Neighborhood | Market (Market type is set by months of supply — how long it would take to sell every home for sale at the current pace. Under ~4 months favors sellers (low inventory, faster sales, homes near or above asking); over ~6 favors buyers (more choice, more negotiating room). 4–6 is balanced.) | Months supply | For sale | Median sale | Sell-to-list | Days to contract | Coming soon | Under contract |
|---|---|---|---|---|---|---|---|---|
| Nall Hills | Strong Seller's ▲ | 1 mo | 4 | $425,000 | 100% | 14d | 2 | 3 |
| Cherokee Hills | Strong Seller's | 0.3 mo | 1 | $365,000 | 101% | 14d | 0 | 2 |
| Chapel Hill | Balanced | 4.6 mo | 16 | $750,000 | 100% | 32d | 1 | 5 |
| Quivira Falls | Seller's ▲ | 2.4 mo | 7 | $253,000 | 101% | 13d | 3 | 2 |
| Oak Park | Strong Seller's | 1.7 mo | 4 | $415,000 | 104% | 17d | 2 | 2 |
| Terrybrook Farms | Strong Buyer's | 9.2 mo | 13 | $1,127,500 | 95% | 52d | 0 | 3 |
How we compute these
- Market.
- Market type is set by months of supply — how long it would take to sell every home for sale at the current pace. Under ~4 months favors sellers (low inventory, faster sales, homes near or above asking); over ~6 favors buyers (more choice, more negotiating room). 4–6 is balanced.
- Months supply.
- How many months it would take to sell every home now for sale at the pace of the last 90 days: homes for sale ÷ (closings in the last 90 days ÷ 3).
- For sale.
- Homes listed as active right now. A live count, not a monthly average.
- Days to contract.
- The middle number of days between a home being listed and going under contract, over the last 90 days of closings. It is not days-to-close, and it is not how long today's listings have been sitting. Newly built homes are excluded, because a build finishing is not a market moving.
- Coming soon.
- Homes announced but not yet accepting showings. A live count.
- Under contract.
- Homes with an accepted contract that have not closed yet. A live count.
Show all 252 neighborhoods
- Nall Hills
- Cherokee Hills
- Chapel Hill
- Quivira Falls
- Oak Park
- Terrybrook Farms
- CENTURY FARMS
- Mills Farm
- Morningview
- Southern Meadows
- Sylvan Grove
- Mission Ranch
- Nottingham By The Green
- Wycliff
- Green Meadows
- Westbrooke
- Round Hill
- Shannon Valley
- Prairie View
- Nottingham Forest
- Southpointe
- The Crossings
- Hampton Place
- Nottingham Forest South
- Wilshire Farms
- Wolf Run
- Brookridge Estates
- Sundance Ridge- Archers Landing
- Coventry Valley
- The Wilderness
- Oak Park Manor
- WatersEdge
- Regency Park
- Pinehurst Est.
- Empire Estates
- Quincy Court
- Kensington Manor
- Greenbrier
- Sundance Ridge- Red Fox Run
- Pinebrooke
- Hanover
- Sanctuary
- Pinehurst
- Windgates
- The Estates of Gleneagles
- Rancho Santa Fe
- Willow Bend at the Village
- Quail Valley
- Villas of Tamarind
- Wyngate
- Heatherwood
- Stone Haven
- Santa Fe Vista
- Lionsgate- By the Green
- Oak Tree Meadow
- Summerwood
- Coffee Creek Crossing
- Beverly Estates
- Riverstone Valley
- Milburn West
- Heritage Farms
- Gramercy Park
- Woodstock
- Elmhurst
- Chapel Hill Villas
- Holmes Crest
- Wilshire Hills
- Rolling Woods
- Wilderness Valley
- Gramercy Place
- Deer Valley
- Chalet
- The Orchards
- Willowbrook
- Highcroft
- Mills Ranch
- Nottingham St. Andrews
- Tomahawk Ridge
- Westbrooke South
- Southmoor
- Oakshire
- Windham Park Bridgestone
- Indian Creek Estates
- Windsor Hills
- Milburn View
- Bentwood Park
- Deer Creek
- The Villages
- Kensington At St. Andrews
- Marbella
- Fairway Woods
- Solera Reserve
- St. Andrews Highlands
- Amesbury Lake Brookhaven
- Craigmont
- Maple Crest
- The Village of Deer Creek
- Scenic Woods
- BEDFORD COURT AT NOTTINGHAM
- Lionsgate- By the Park
- Morse Village
- Highland Acres
- Mills Crossing
- Comanche Height
- Briarford Place
- Lionsgate- The Links
- Saddle Hills
- Pepper Pointe
- Arbor View
- Kingston Oaks
- Country Oaks
- Ranchview
- Mission Mooreland
- Highland Village
- Kenilworth
- Brookhollow
- Morningside
- Overland Height
- Wilshire Park
- Hunters Pointe
- Colonial Village
- Lionsgate- Club Villas
- Village Of Kensington
- Kingston Lakes
- Milburn Place
- Fontainebleau East
- Wynnewood
- Windham Park Southwind
- Walmer View
- Pinewood North
- Grand Oaks
- Stonebridge Court
- Vendome
- Colton
- Antioch Acres
- Lancaster Brandon Place
- Lancaster Weybury
- Wellington Park Hunters Glen
- Kensington Valley
- Lionsgate
- Wakefield Estates
- Parkway 103
- Park Place
- Regency at Oak Park
- Villas at Metcalf Village
- Indian Creek Woods
- The Park at Forest Green
- Broxton Square
- Fontainebleau
- Cross Creek
- Tower Grove
- Wedgewood
- Cherry Hills
- Wilderness- Cottages at
- Oakview
- Rockwood Commons
- Brittany Highlands
- Eastland Meadows
- Canterbury Estates
- Wheatley
- Devereaux
- The Clearing
- Greenbrier Park
- Hampton Court Nottingham
- Fieldstone
- Villas Of Fairway Woods
- Ranch Villas at Nall Hills
- The Ridge At Pinewood
- Westridge Estate
- Bluestem
- Knightsbrooke
- South Woods
- Foxfield Estates
- Edson Place
- Stonegate
- Johnson Hills
- Cherokee Hills South
- Breyfogle
- Hawthorne Place
- Nottingham Place
- Greenwich Hills
- Wellington Park Carriage Hills
- Prairie Manor
- Sumarlee Estates
- Brookridge West
- Meadow Acres
- Monitor Square
- Nallwood Height
- Bentwood Crossings
- Evergreen
- Oxford Mills
- Lancaster Parkbridge
- Oakview Estates
- Sun Hill
- Bordeaux Condominium
- Centennial Park
- Villas of Ironwoods
- Woodland View
- Executive Hills
- Grant Gardens
- Rayven Plains
- Southmoor Garden
- Switzer Lake Estates
- Cobblestone Condominium
- Hawthorne View
- Mission Forest
- Proctor Place
- Southwood
- Southwest Garden
- Metcalf 56
- Indian Heights Estates
- Colony West
- Sue Car
- Quivira Farms
- Park Estates
- Conser Addition
- Forest Creek Estates
- Coventry
- Riverstone
- College Park
- Stonegate Reserve
- Bruce Acres
- Colton Lake Estates
- Early Place
- Garnett Highland
- Linden Place
- Meadows Of Blue Valley
- Metcalf 3rd Add
- Montecito Place
- Breyfogle Garden
- Somerset Brooke
- Tower Court
- Windsor Manor
- Wycliff West
- River Ridge Farms West
- The Farm at Garnet Hill
- Brookhill
- Camelot
- Brandon Place of Lancaster
- Twin Oaks
- Greenway Place
- Holmes Overland Park Annex
- Jessups
- Martys 1st Addn
- Milburn Park
- Wild Horse
- Woodmyre
- Walnut Reserve
- Broadmoor
- Kingston Meadow
- Colton Lakes South
- Stanley
③ Nearby cities — two steps out
Search homes nearby Wilderness- Parkview at the
| Place | Market (Market type is set by months of supply — how long it would take to sell every home for sale at the current pace. Under ~4 months favors sellers (low inventory, faster sales, homes near or above asking); over ~6 favors buyers (more choice, more negotiating room). 4–6 is balanced.) | Months supply | Median list | Sell-to-list | Days to contract | For sale | Coming soon | Under contract |
|---|---|---|---|---|---|---|---|---|
| Overland Park | — | — | $727,830 | — | — | 509 | 58 | 311 |
| Olathe | — | — | $629,950 | — | — | 529 | 34 | 296 |
| Shawnee | — | — | $563,475 | — | — | 181 | 20 | 97 |
| Lenexa | — | — | $649,950 | — | — | 194 | 15 | 75 |
| Leawood | — | — | $899,000 | — | — | 132 | 16 | 63 |
| Prairie Village | — | — | $864,950 | — | — | 57 | 15 | 43 |
How we compute these
- Market.
- Market type is set by months of supply — how long it would take to sell every home for sale at the current pace. Under ~4 months favors sellers (low inventory, faster sales, homes near or above asking); over ~6 favors buyers (more choice, more negotiating room). 4–6 is balanced.
- Months supply.
- How many months it would take to sell every home now for sale at the pace of the last 90 days: homes for sale ÷ (closings in the last 90 days ÷ 3).
- Median list.
- The middle asking price among the homes for sale right now. Half are listed above it, half below.
- Days to contract.
- The middle number of days between a home being listed and going under contract, over the last 90 days of closings. It is not days-to-close, and it is not how long today's listings have been sitting. Newly built homes are excluded, because a build finishing is not a market moving.
- For sale.
- Homes listed as active right now. A live count, not a monthly average.
- Coming soon.
- Homes announced but not yet accepting showings. A live count.
- Under contract.
- Homes with an accepted contract that have not closed yet. A live count.
④ Zip codes, every city, then wider — widest
Nearby ZIP codes
| Place | Market (Market type is set by months of supply — how long it would take to sell every home for sale at the current pace. Under ~4 months favors sellers (low inventory, faster sales, homes near or above asking); over ~6 favors buyers (more choice, more negotiating room). 4–6 is balanced.) | Months supply | Median list | Sell-to-list | Days to contract | For sale | Coming soon | Under contract |
|---|---|---|---|---|---|---|---|---|
| 66212 | Strong Seller's | 1.7 mo | $370,000 | 101% | 4d | 58 | 13 | 38 |
| 66221 | Balanced | 4.8 mo | $965,928 | 99% | 16d | 134 | 7 | 60 |
| 66213 | Strong Seller's | 1.5 mo | $595,000 | 102% | 3d | 32 | 9 | 28 |
| 66223 | Strong Seller's | 1.5 mo | $512,500 | 100% | 6d | 29 | 4 | 28 |
| 66204 | Strong Seller's | 1.4 mo | $315,000 | 102% | 3d | 27 | 3 | 22 |
| 66210 | Strong Seller's | 1.5 mo | $330,000 | 101% | 5d | 28 | 4 | 22 |
How we compute these
- Market.
- Market type is set by months of supply — how long it would take to sell every home for sale at the current pace. Under ~4 months favors sellers (low inventory, faster sales, homes near or above asking); over ~6 favors buyers (more choice, more negotiating room). 4–6 is balanced.
- Months supply.
- How many months it would take to sell every home now for sale at the pace of the last 90 days: homes for sale ÷ (closings in the last 90 days ÷ 3).
- Median list.
- The middle asking price among the homes for sale right now. Half are listed above it, half below.
- Days to contract.
- The middle number of days between a home being listed and going under contract, over the last 90 days of closings. It is not days-to-close, and it is not how long today's listings have been sitting. Newly built homes are excluded, because a build finishing is not a market moving.
- For sale.
- Homes listed as active right now. A live count, not a monthly average.
- Coming soon.
- Homes announced but not yet accepting showings. A live count.
- Under contract.
- Homes with an accepted contract that have not closed yet. A live count.
Search homes for sale in every city we cover
| City | Market (Market type is set by months of supply — how long it would take to sell every home for sale at the current pace. Under ~4 months favors sellers (low inventory, faster sales, homes near or above asking); over ~6 favors buyers (more choice, more negotiating room). 4–6 is balanced.) | Months supply | Median list | Sell-to-list | Days to contract | For sale | Coming soon | Under contract |
|---|---|---|---|---|---|---|---|---|
| Archie | Seller's | 3.2 mo | $337,450 | 100% | 45d | 15 | 1 | 5 |
| Avondale | Strong Buyer's | 12 mo | Median— | 102% | 7d | 3 | 0 | 0 |
| Basehor | Balanced | 4.5 mo | $474,500 | 99% | 35d | 97 | 4 | 54 |
| Belton | Seller's | 2.5 mo | $364,950 | 101% | 18d | 75 | 7 | 37 |
| Birmingham | Strong Buyer's | 12 mo | Median— | 101% | 8d | 2 | 0 | 0 |
| Blue Springs | Seller's | 2.9 mo | $395,000 | 100% | 14d | 209 | 13 | 120 |
How we compute these
- Market.
- Market type is set by months of supply — how long it would take to sell every home for sale at the current pace. Under ~4 months favors sellers (low inventory, faster sales, homes near or above asking); over ~6 favors buyers (more choice, more negotiating room). 4–6 is balanced.
- Months supply.
- How many months it would take to sell every home now for sale at the pace of the last 90 days: homes for sale ÷ (closings in the last 90 days ÷ 3).
- Median list.
- The middle asking price among the homes for sale right now. Half are listed above it, half below.
- Days to contract.
- The middle number of days between a home being listed and going under contract, over the last 90 days of closings. It is not days-to-close, and it is not how long today's listings have been sitting. Newly built homes are excluded, because a build finishing is not a market moving.
- For sale.
- Homes listed as active right now. A live count, not a monthly average.
- Coming soon.
- Homes announced but not yet accepting showings. A live count.
- Under contract.
- Homes with an accepted contract that have not closed yet. A live count.
Show all 109 cities
- Archie
- Avondale
- Basehor
- Belton
- Birmingham
- Blue Springs
- Bonner Springs
- Buckner
- Bucyrus
- Camden Point
- Claycomo
- Cleveland
- Creighton
- De Soto
- Dearborn
- Drexel
- East Lynne
- Easton
- Edgerton
- Edgerton
- Edwardsville
- Eudora
- Excelsior Springs
- Fairway
- Farley
- Ferrelview
- Fontana
- Freeman
- Gallatin
- Garden City
- Gardner
- Gladstone
- Grain Valley
- Grandview
- Greenwood
- Harrisonville
- Holt
- Houston Lake
- Independence
- Kansas City, MO
- Kansas City
- Kearney
- Kingsville
- Lacygne
- Lake Lotawana
- Lake Quivira
- Lake Tapawingo
- Lake Waukomis
- Lake Winnebago
- Lane
- Lansing
- Lawrence
- Lawson
- Leavenworth
- Leawood
- Lee's Summit
- Lenexa
- Levasy
- Liberty
- Linwood
- Loch Lloyd
- Lone Jack
- Louisburg
- McLouth
- Merriam
- Mission
- Mission Hills
- Mission Woods
- Missouri City
- Napoleon
- North Kansas City
- Northmoor
- Oak Grove
- Oakview
- Olathe
- Osawatomie
- Overland Park
- Paola
- Parker
- Parkville
- Peculiar
- Platte City
- Platte Woods
- Pleasant Hill
- Pleasant Valley
- Prairie Village
- Prathersville
- Raymore
- Raytown
- Riverside
- Roeland Park
- Rushville
- Shawnee
- Sibley
- Smithville
- Spring Hill
- Stilwell
- Strasburg
- Sugar Creek
- Tonganoxie
- Tracy
- Trimble
- Village Of Loch Lloyd
- Village Of Oaks
- Weatherby Lake
- Wellsville
- Weston
- Westwood
- Westwood Hills
Search for homes in popular markets
| Market | For sale |
|---|---|
| Heritage Ranch | 29 |
| Canyon Lakes | 27 |
| Garrett Ranch | 25 |
| Seven Bridges | 25 |
| Falcon Lakes | 23 |
| Boulder Creek | 21 |
How we compute these
- Market.
- Market type is set by months of supply — how long it would take to sell every home for sale at the current pace. Under ~4 months favors sellers (low inventory, faster sales, homes near or above asking); over ~6 favors buyers (more choice, more negotiating room). 4–6 is balanced.
- For sale.
- Homes listed as active right now. A live count, not a monthly average.
Show all 53 popular markets
- Heritage Ranch
- Canyon Lakes
- Garrett Ranch
- Seven Bridges
- Falcon Lakes
- Boulder Creek
- Tomahawk Valley
- Southern Meadows
- Parkside Reserve
- Woodlawn Estates
- Prairie Farms
- Wild Horse
- Ruskin Heights
- Thousand Oaks
- Heritage Farms
- Stonebridge Pointe
- Tapp Farms
- Woodmyre
- WaterCrest Landing
- The View
- Creekmoor - Cunningham
- Marlborough Heights
- Riverstone Valley
- Woodland Hills
- Vista Village
- Chapel Hill
- The Meadows At Greenfield
- Arbor Lake
- Stonebridge Villas
- Ashton Farms
- Dayton Creek
- Prairie Trace
- Providence Pointe
- Bristol Highlands
- Piper Creek Estates
- Tuscany
- The Manhattan Condominiums
- East Village of Leawood
- Prairie Canyon
- Dwyer Farms
- Sundance Ridge- Archers Landing
- Lone Star Prairie
- Riverstone
- Canyon Creek Forest
- Far View Heights
- Wolf Run
- Terrybrook Farms
- Clay Creek Meadows
- Oaks of Edgewood
- Cliffs of Watercrest
- Lakeview Ridge
- Red Hawk Run
- Sanctuary
Or go wider still county, metro and state
| Place | Market (Market type is set by months of supply — how long it would take to sell every home for sale at the current pace. Under ~4 months favors sellers (low inventory, faster sales, homes near or above asking); over ~6 favors buyers (more choice, more negotiating room). 4–6 is balanced.) | Months supply | Median list | Sell-to-list | Days to contract | For sale | Coming soon | Under contract |
|---|---|---|---|---|---|---|---|---|
| Jackson County, MO | Seller's | 3.8 mo | $275,000 | 99% | 19d | 2,943 | 140 | 1,109 |
| Clay County, MO | Seller's | 2.9 mo | $389,900 | 100% | 15d | 884 | 59 | 435 |
| Cass County, MO | Balanced | 4.6 mo | $369,900 | 99% | 27d | 655 | 28 | 249 |
| Platte County, MO | Seller's | 3.8 mo | $499,900 | 101% | 20d | 459 | 26 | 208 |
| Johnson County, KS | Seller's | 2.8 mo | $614,950 | 101% | 7d | 1,927 | 176 | 1,089 |
| Wyandotte County, KS | Seller's | 3.9 mo | $249,000 | 100% | 20d | 513 | 28 | 199 |
| Leavenworth County, KS | Balanced | 5 mo | $293,500 | 99% | 26d | 472 | 21 | 142 |
| Miami County, KS | Balanced | 5.1 mo | $328,250 | 99% | 35d | 248 | 9 | 85 |
| Kansas City metro | — | — | Median— | — | — | 7,630 | — | — |
How we compute these
- Market.
- Market type is set by months of supply — how long it would take to sell every home for sale at the current pace. Under ~4 months favors sellers (low inventory, faster sales, homes near or above asking); over ~6 favors buyers (more choice, more negotiating room). 4–6 is balanced.
- Months supply.
- How many months it would take to sell every home now for sale at the pace of the last 90 days: homes for sale ÷ (closings in the last 90 days ÷ 3).
- Median list.
- The middle asking price among the homes for sale right now. Half are listed above it, half below.
- Days to contract.
- The middle number of days between a home being listed and going under contract, over the last 90 days of closings. It is not days-to-close, and it is not how long today's listings have been sitting. Newly built homes are excluded, because a build finishing is not a market moving.
- For sale.
- Homes listed as active right now. A live count, not a monthly average.
- Coming soon.
- Homes announced but not yet accepting showings. A live count.
- Under contract.
- Homes with an accepted contract that have not closed yet. A live count.