
Johnson County KS Real Estate & Homes For Sale
· 1,989 homes for sale in Johnson CountyHouseLoop Vision identified 903 homes for sale in Johnson County, KS with white kitchen cabinets, 588 with a freestanding tub, 53 with a pool, 168 with a home gym, 1,262 with a big backyard and 866 with a finished basement, plus 4 more features. See what HouseLoop Vision found
1,989 homes for sale in Johnson County · Sorted by Newest Listed
Real estate in Johnson County, Kansas
Johnson County, KS has about 249,531 households and a median household income of $109,208. Roughly 69% of homes are owner-occupied, the median owner's home value is $391,200, 58% of adults hold a bachelor's degree or higher. The average commute runs 20.6 minutes. About 620,631 people live in Johnson County, KS, per the U.S. Census Bureau's American Community Survey 5-year estimate (2020–2024). New construction is still adding supply: 1,221 building permits were issued in September 2026.
The honest question every buyer in Johnson County faces right now is whether the slower pace works for them or against them. Sellers, for their part, need to price with precision: the days of any number working are behind you, and overpriced listings are sitting while well-priced ones still move.
The county is not one market — it is ten distinct ones wearing the same zip code umbrella. Overland Park is the anchor, the largest city in Kansas, and the place most out-of-state buyers default to for good reason: walkable retail corridors like 119th Street, a relentless pipeline of new construction, and school districts that routinely appear on national best-of lists. Olathe sits just west and offers more square footage per dollar, a booming job base, and a slightly younger buyer demographic. Lenexa is the quiet overachiever — strong city planning, the Lenexa City Center development, and easy access to both I-35 and K-7 make it a sleeper pick that more buyers are waking up to.
Leawood and Prairie Village are the county's prestige addresses. Leawood skews newer and larger, with estates along Town Center and Hallbrook that push well past seven figures. Prairie Village is the opposite — smaller lots, mid-century ranch homes, mature trees, and a village-square feel around the Corinth shops that attracts buyers who want character over square footage. Shawnee draws buyers who want more land without driving to the edge of civilization, and Roeland Park and Mission offer some of the county's most accessible entry price points for first-time buyers who still want to be 15 minutes from downtown Kansas City. Gardner and Spring Hill, at the county's southern edge, are where the new construction land rush is happening — builders are platting subdivisions faster than the infrastructure can keep up, which is worth knowing before you assume the commute is manageable.
Schools drive a disproportionate amount of the decision-making in Johnson County, and that reputation is earned. Blue Valley, Shawnee Mission, and Olathe school districts all carry strong ratings, with Blue Valley frequently cited as one of the top public districts in the Midwest. Buyers should map school boundaries before falling in love with a specific neighborhood.
Homes that show well and land at the right number are still finding buyers. Homes that are priced to what a neighbor got two years ago are becoming cautionary tales. Johnson County rewards preparation on both sides of the transaction.
Housing market trends in Johnson County, Kansas
| Measure | Oct 2026 | Sep 2026 | Oct 2025 |
|---|---|---|---|
| Median sale price | $450,000 | $470,000 | $471,250 |
| Median price per sq ft | $214 | $212 | $210 |
| Median days to contract | 17 | 19 | 18 |
| Sell-to-list ratio | 100% | 100% | 100% |
| Homes sold | 755 | 773 | 714 |
| New listings | 927 | 1,026 | 832 |
| Went under contract | 699 | 721 | 634 |
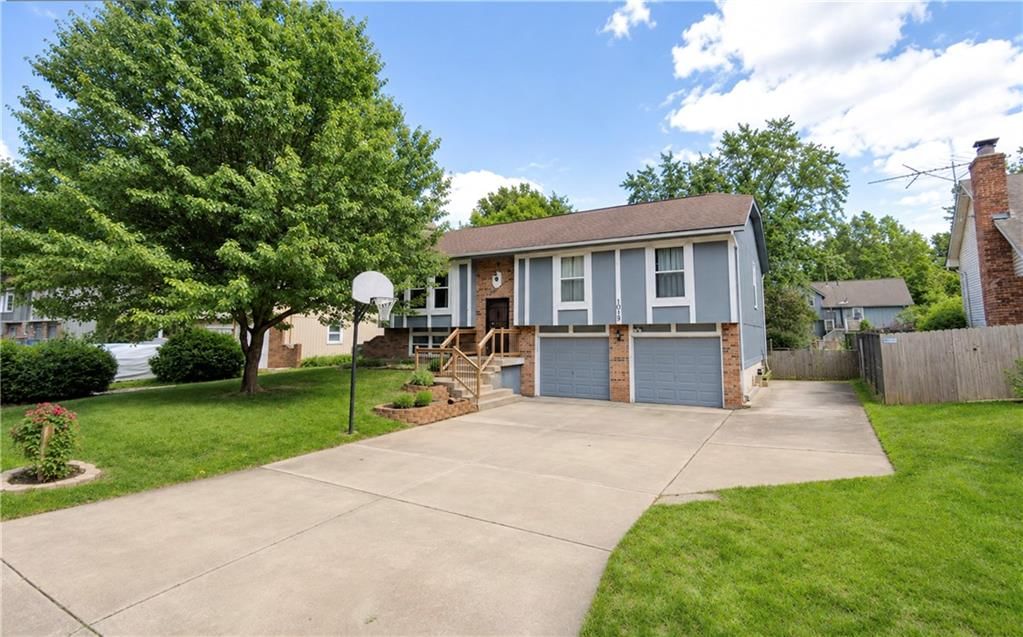
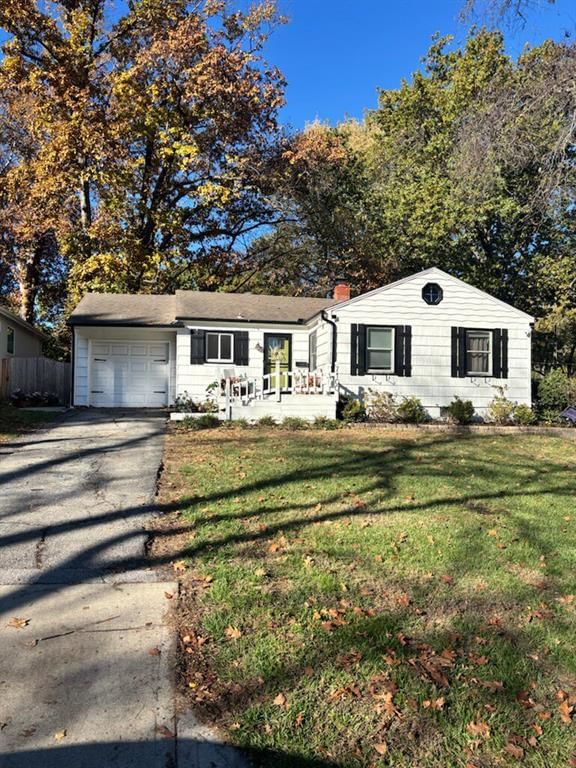
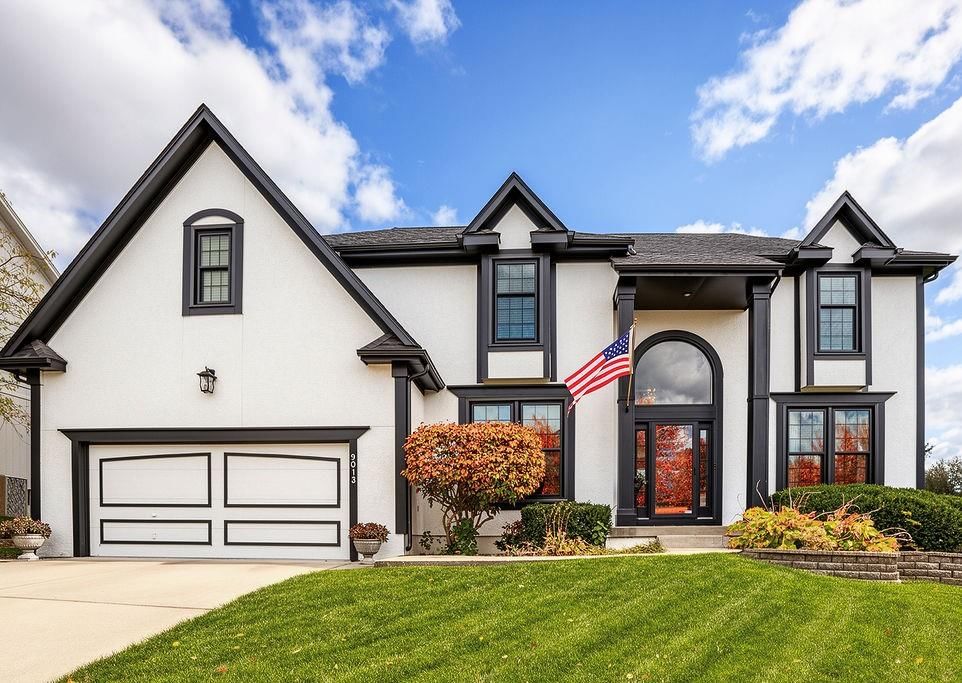
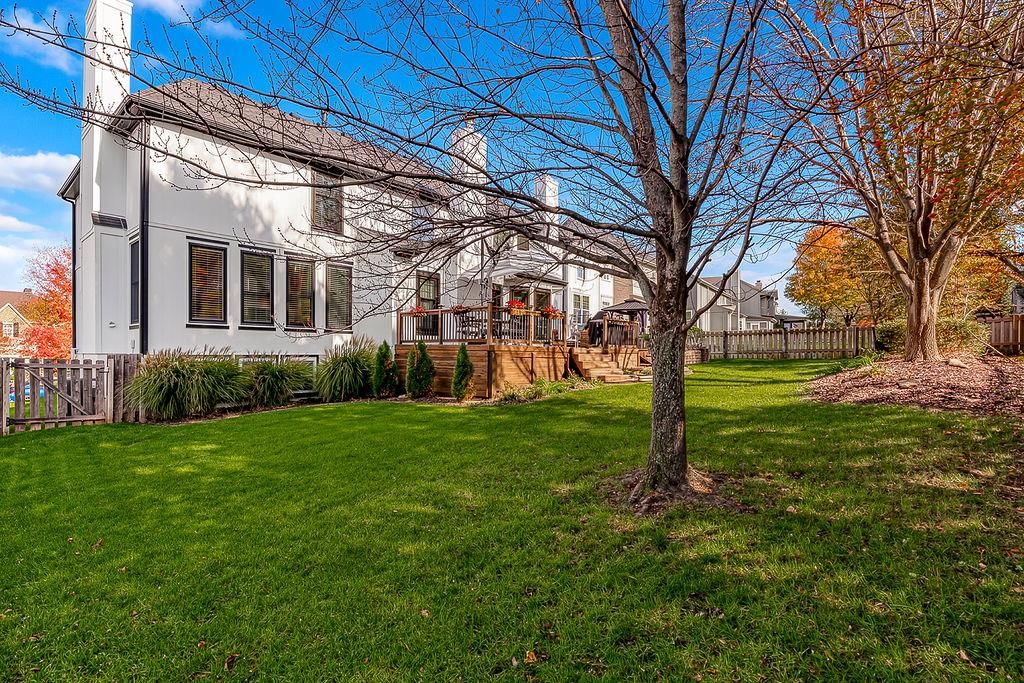
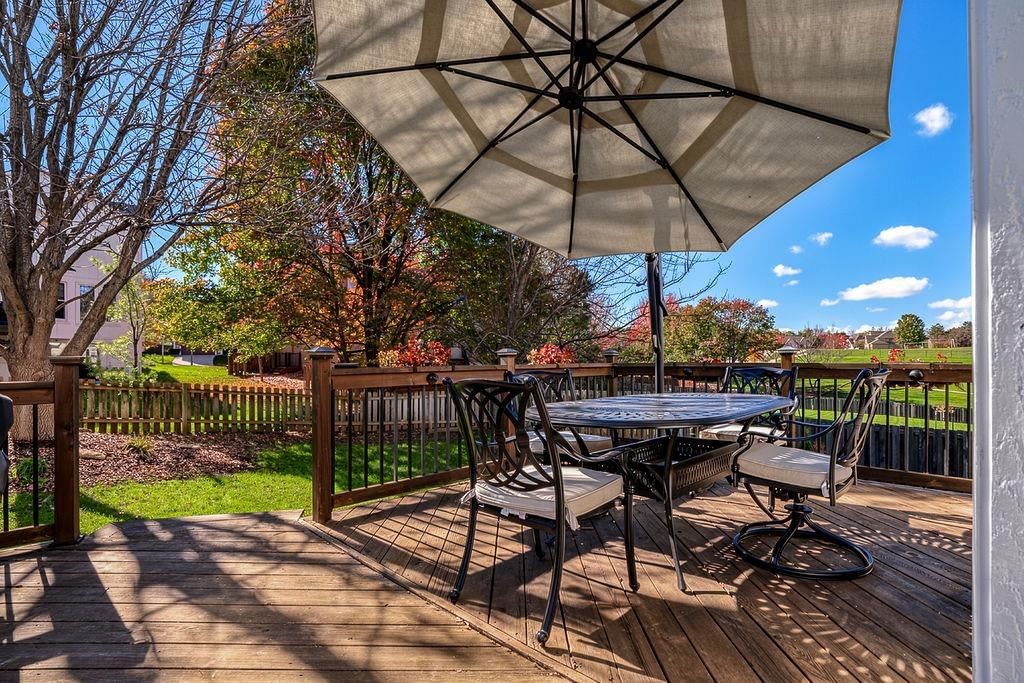
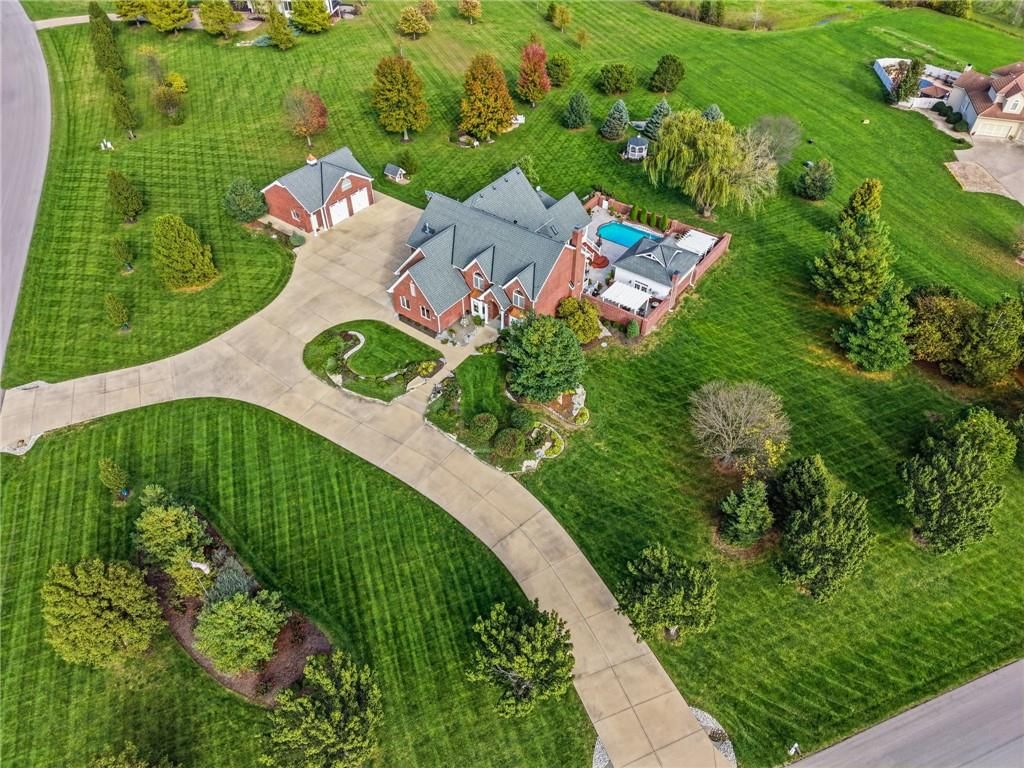
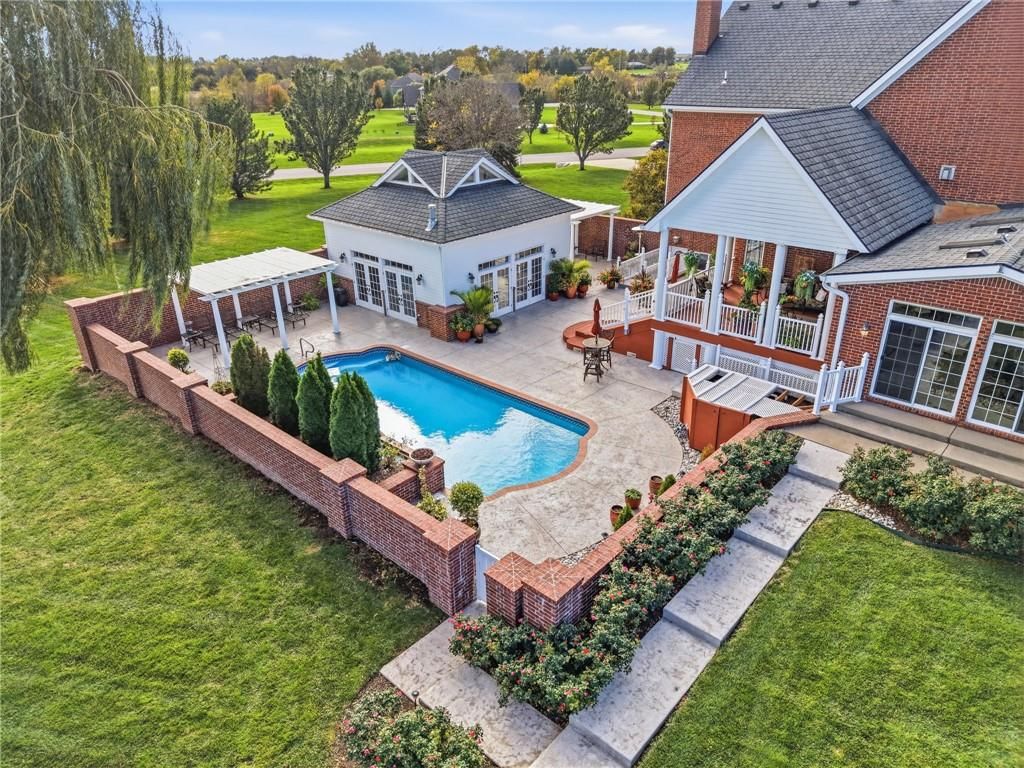
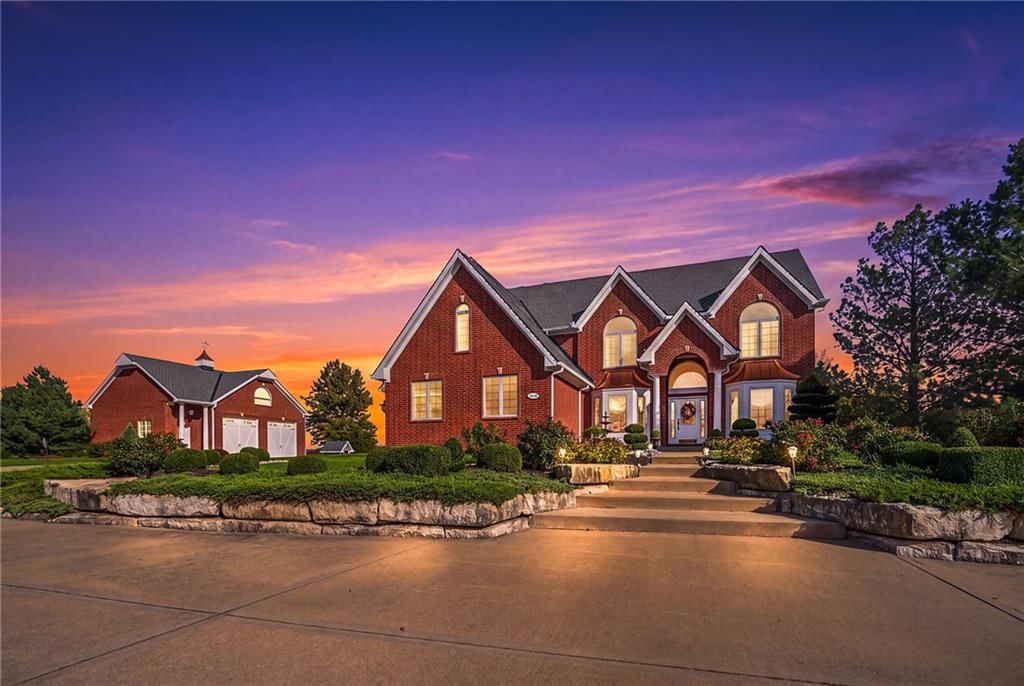
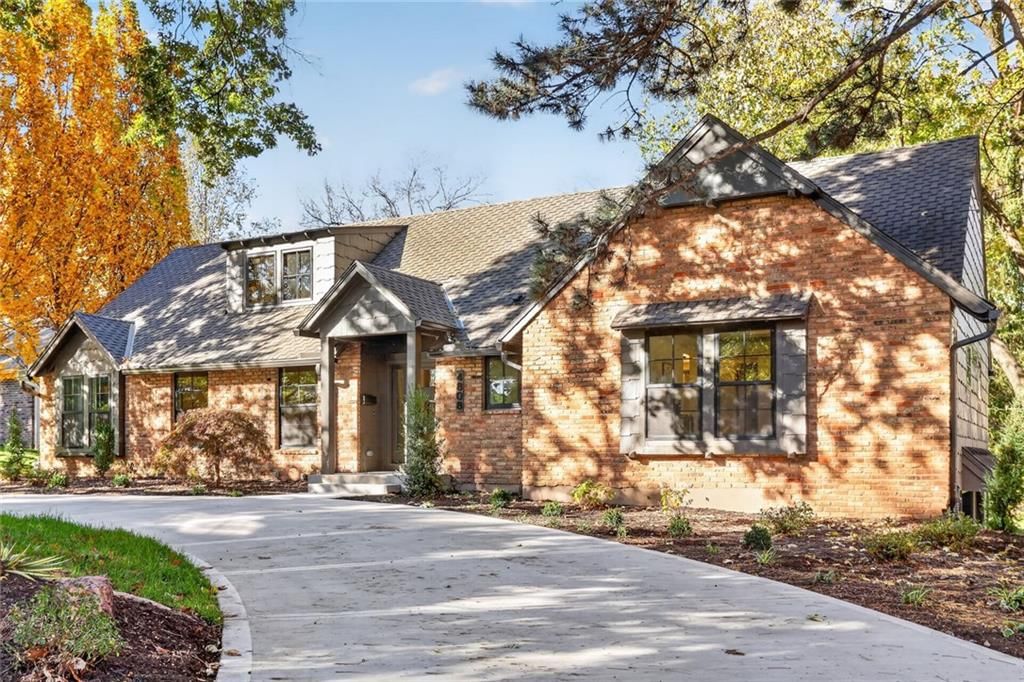
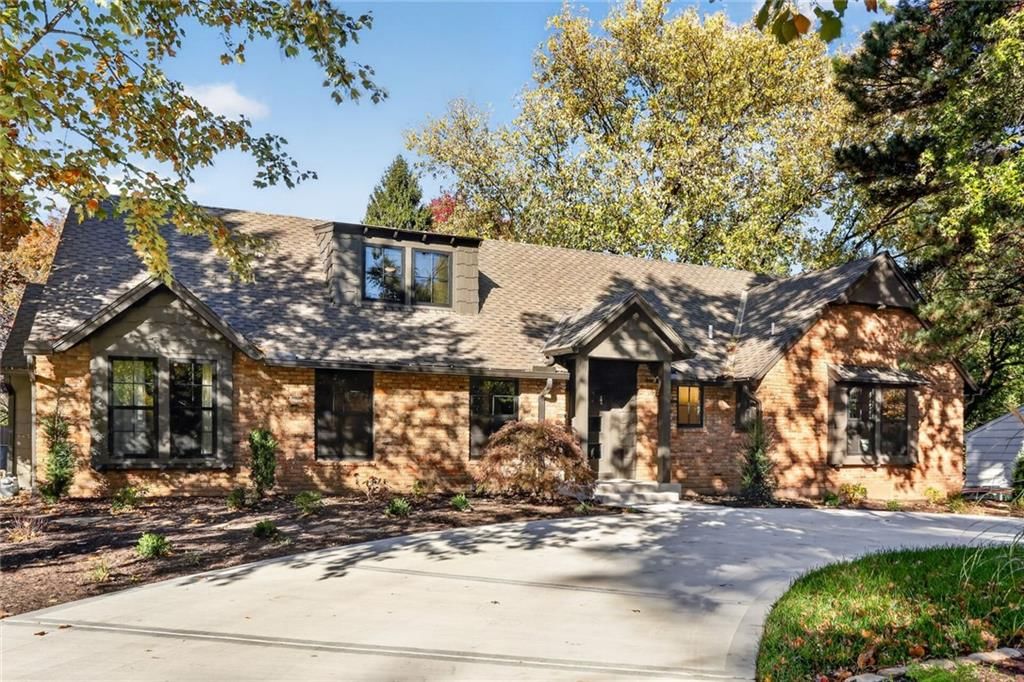
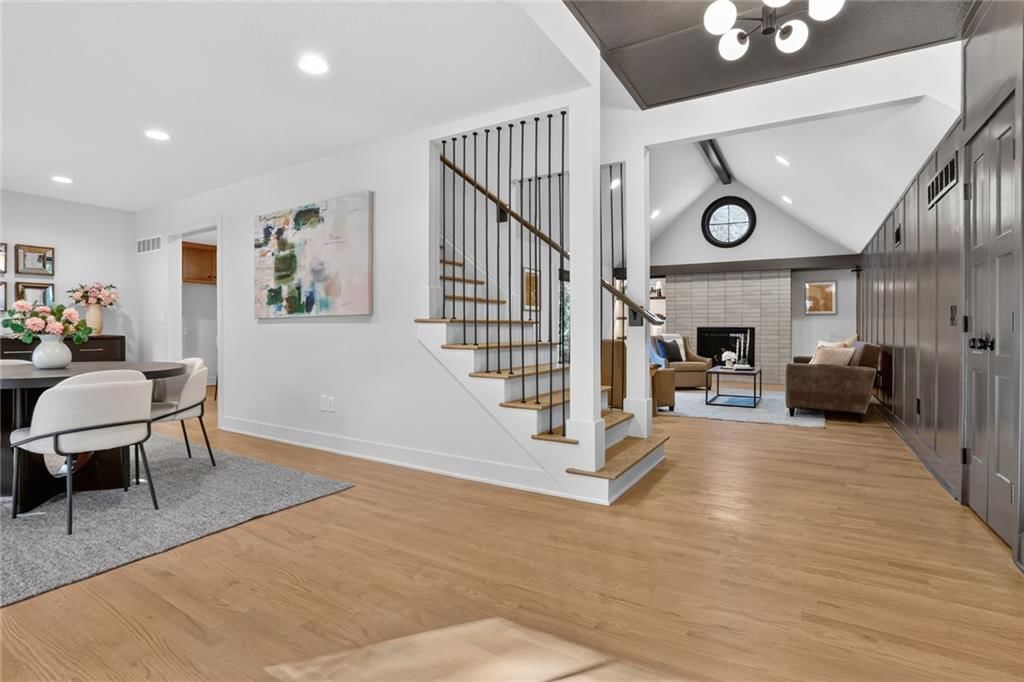
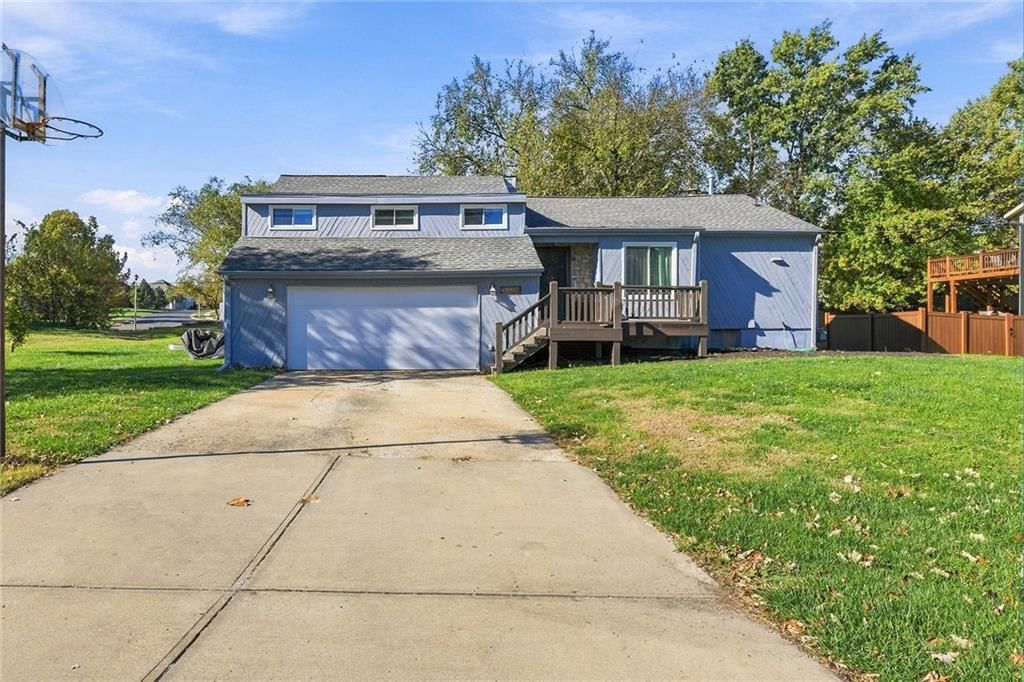
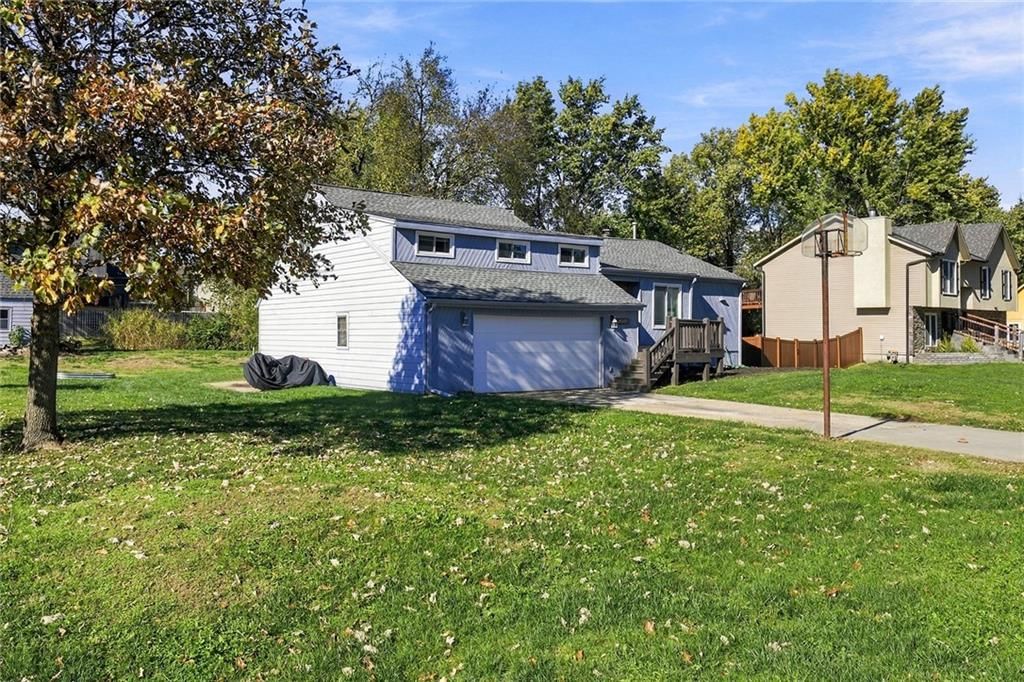
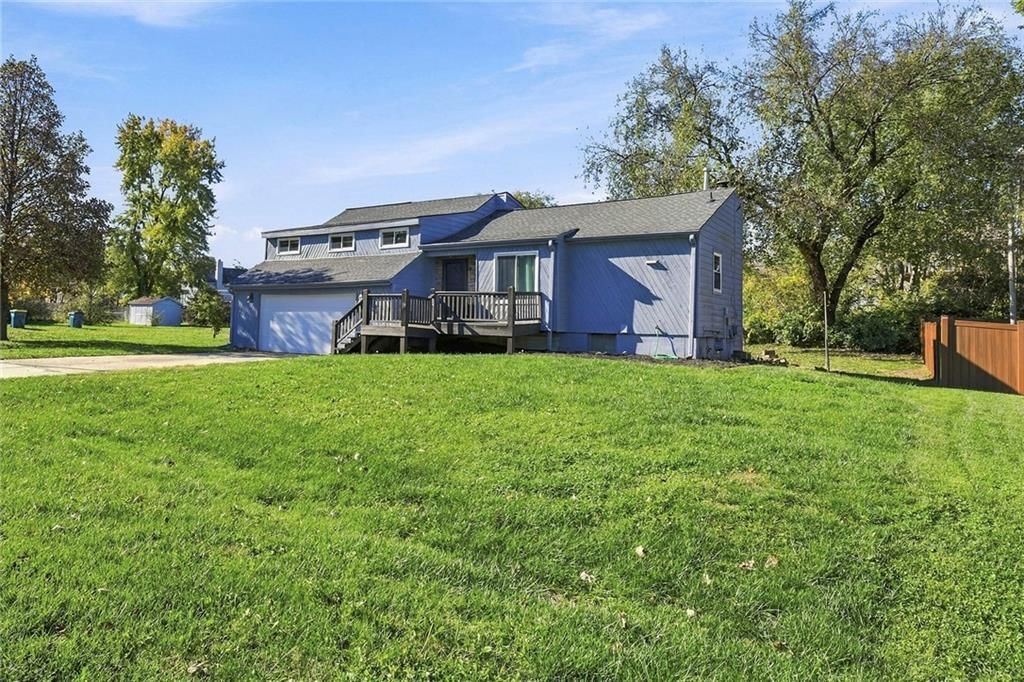
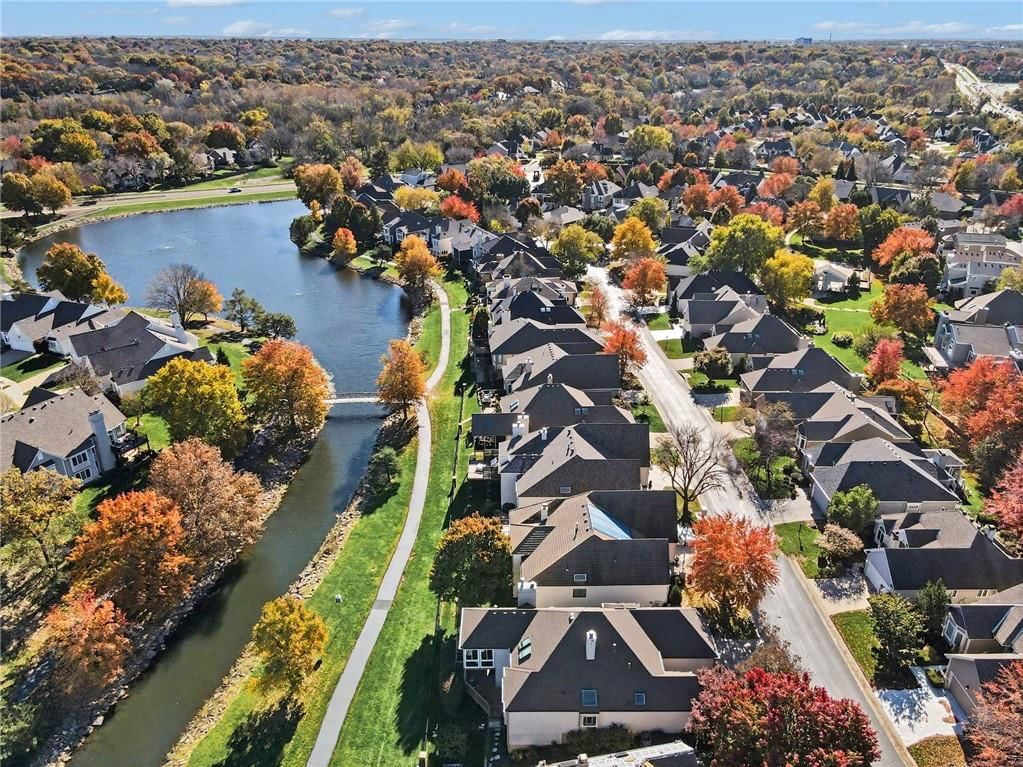
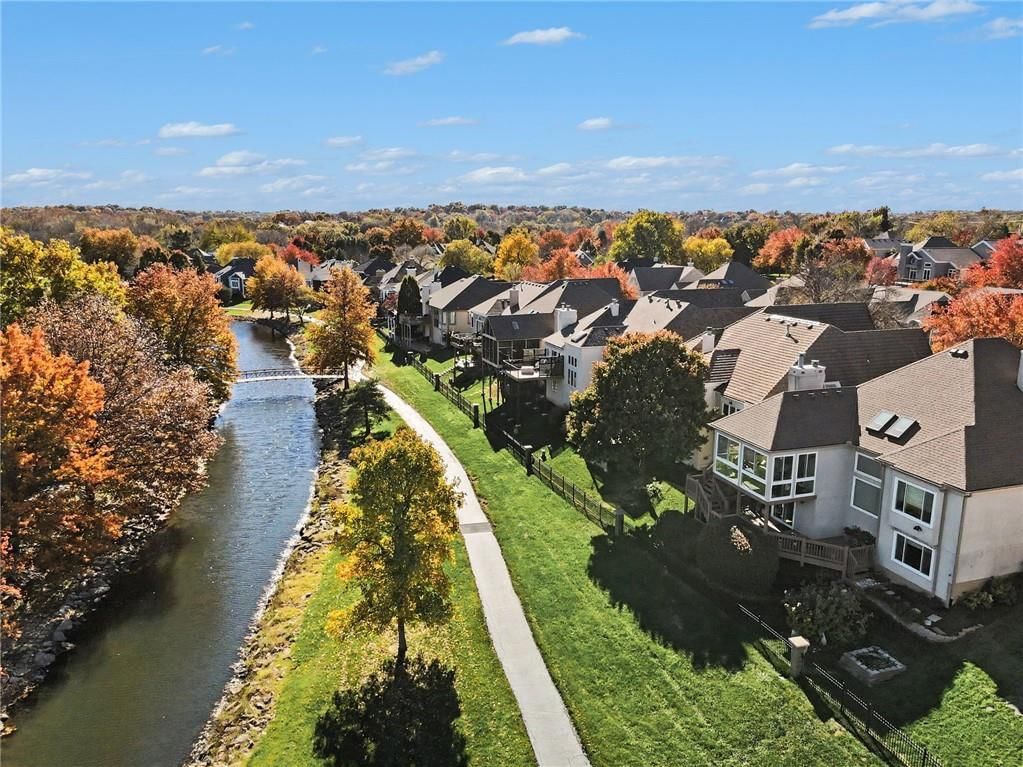
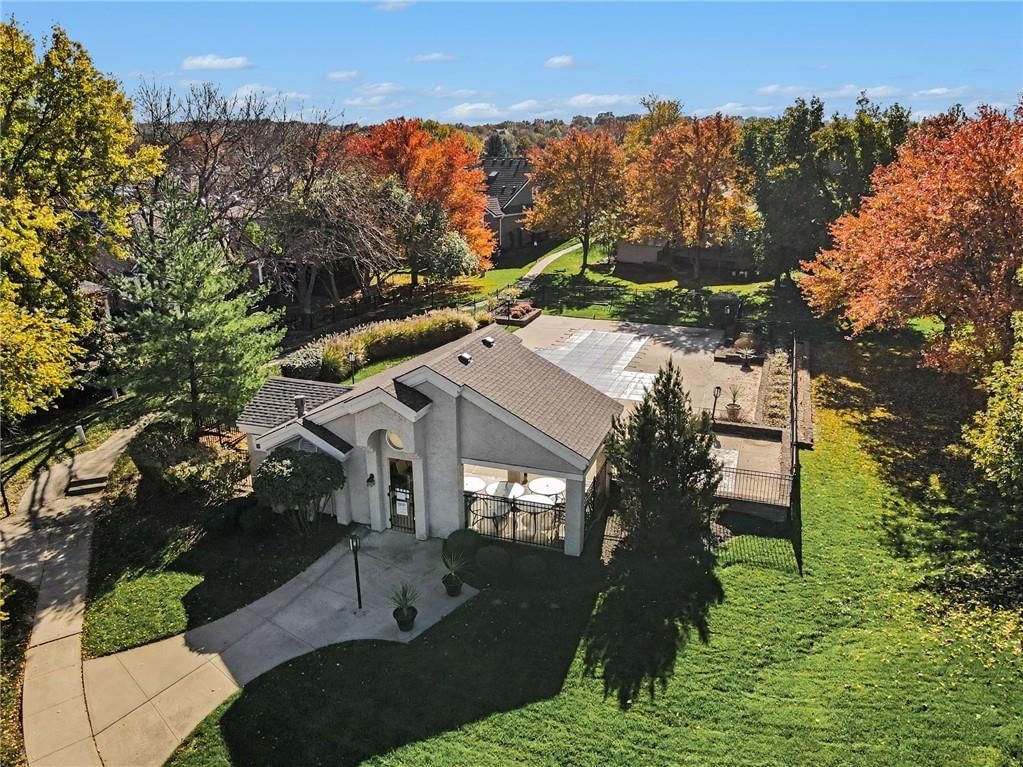
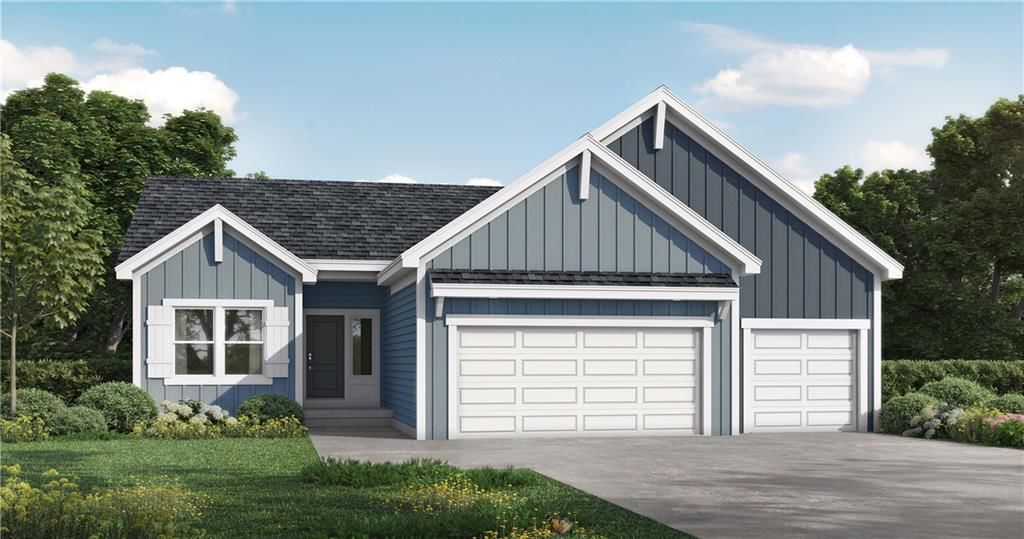
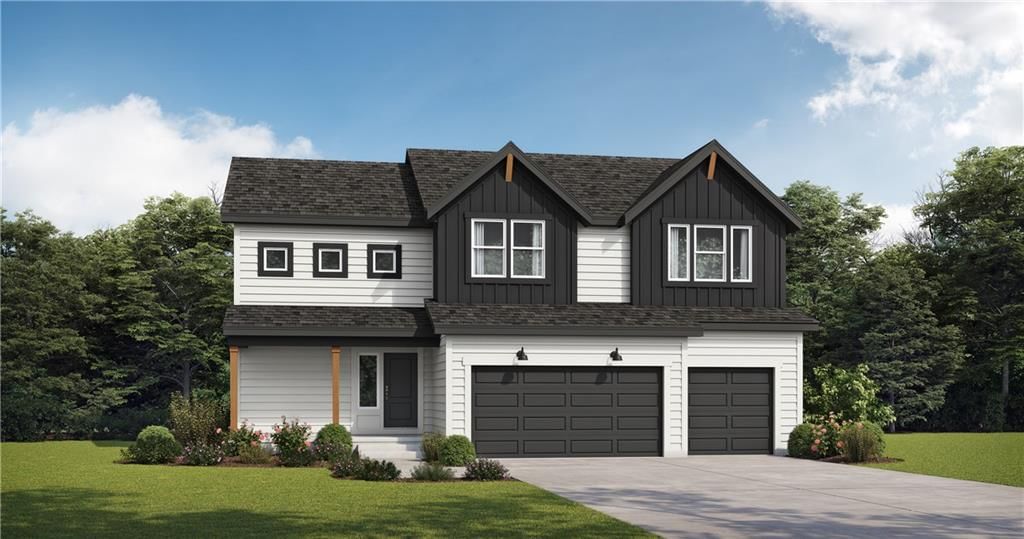
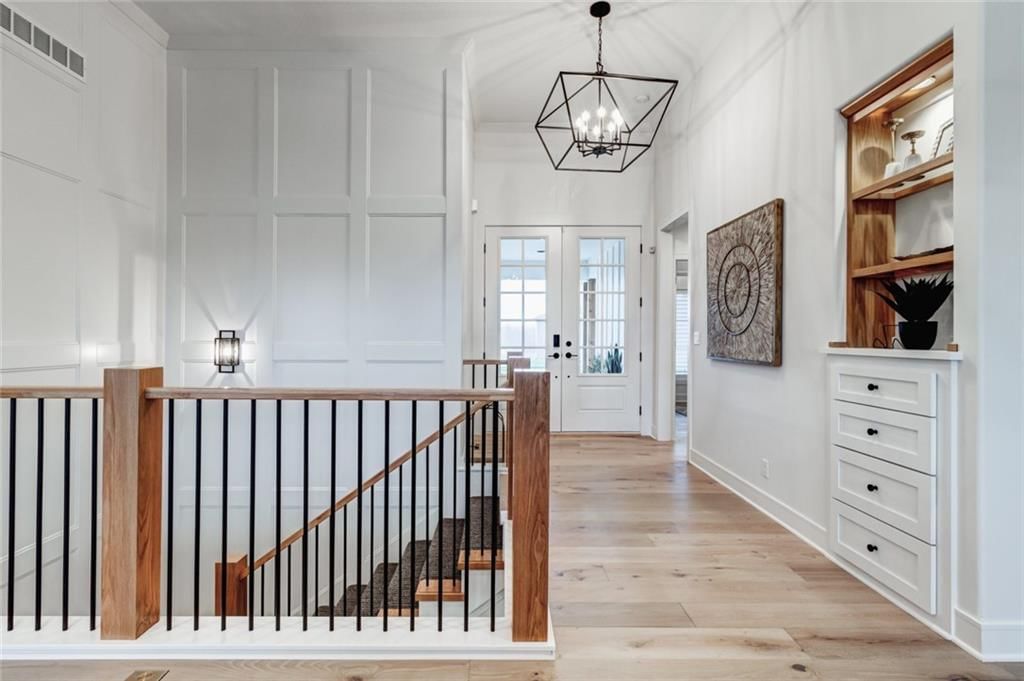
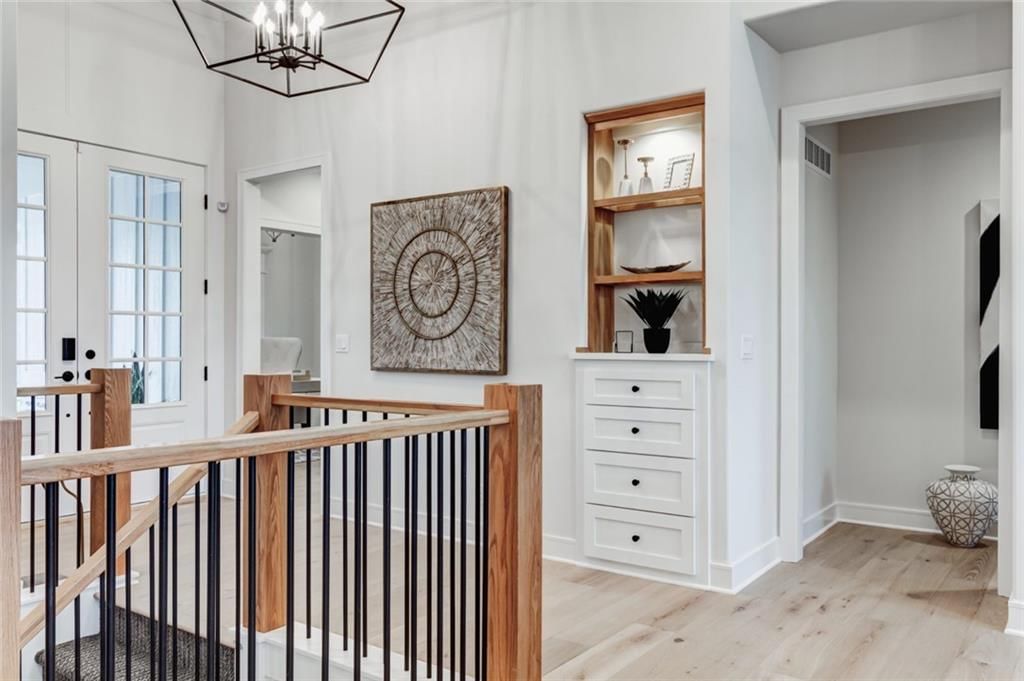
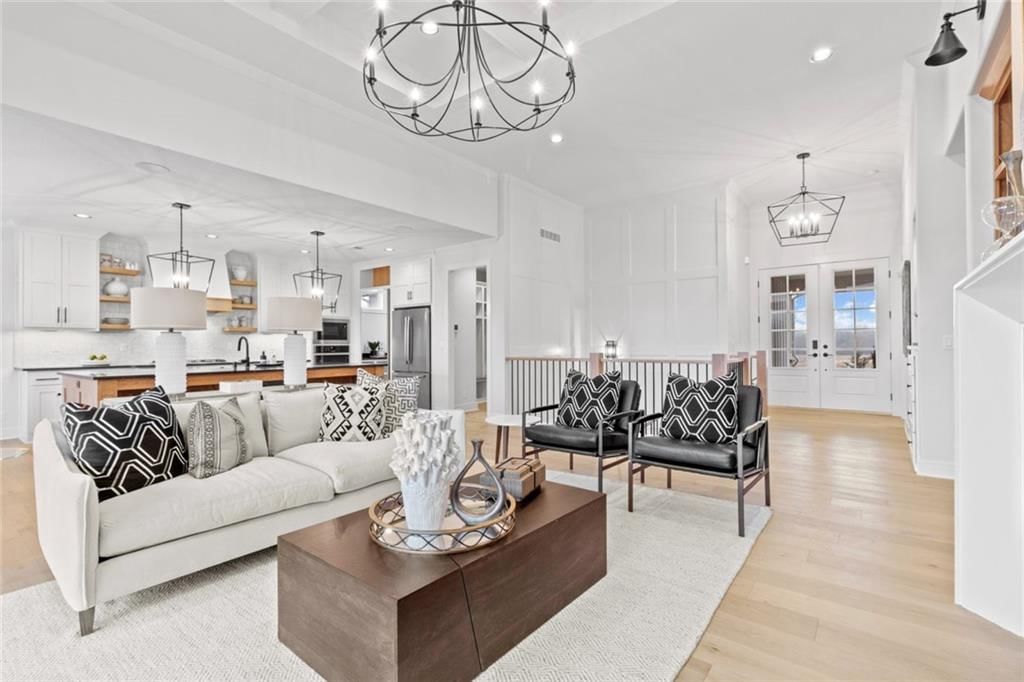
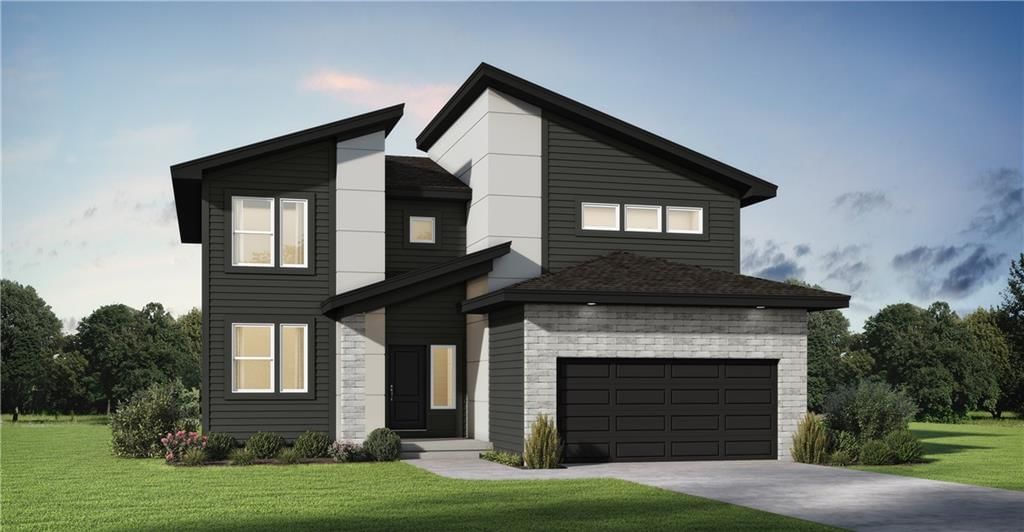
HouseLoop Vision in Johnson County, KS
As of Nov 14, 2026
HouseLoop Vision identified 903 homes for sale in Johnson County, KS with white kitchen cabinets, 588 with a freestanding tub, 53 with a pool, 168 with a home gym, 1,262 with a big backyard and 866 with a finished basement, plus 4 more features.
HouseLoop Vision has looked at the photos of 1,961 of the 1,988 homes for sale in Johnson County, KS. 27 haven't been looked at yet.
| HouseLoop Vision feature | Homes for sale | Where HouseLoop Vision saw it |
|---|---|---|
| White kitchen cabinets | 903 | 5938 CATALINA Street (photo 8), 7819 England Drive (photo 10), 8300 Johnson Drive (photo 8) |
| Freestanding tub | 588 | 9436 Aurora Street (photo 22), 11378 S Cook Street (photo 33), 8512 W 139th Street (photo 30) |
| Pool | 53 | 18165 Brentwood Drive (photo 1), 13908 HOWE Drive (photo 5), 21726 W 96th Street (photo 40) |
| Home gym | 168 | 9013 W 148th Terrace (photo 34), 16644 King Street (photo 45), 12707 Woodson Street (photo 71) |
| Big backyard | 1,262 | 7134 Riggs Street (photo 7), 30815 W 82 Street (photo 1), 12215 ASH Street (photo 10) |
| Finished basement | 866 | 4808 W 83rd Street (photo 20), 3816 W 58th Street (photo 56), 9301 LAMAR Avenue (photo 39) |
| Kitchen island | 1,333 | 37916 W 208th Street (photo 3), 37909 W 208th Terrace (photo 7) |
| Two-story living room | 399 | 16211 Overbrook Lane (photo 12), 10531 Mission Road #312 (photo 11), 18 Le Mans Court (photo 14) |
| Fenced yard | 788 | 6350 Longview Road (photo 6), 1106 E Elizabeth Street (photo 10), 12721 W 100th Street (photo 24) |
| 3-car garage | 533 | 16920 Rosehill Street (photo 28), 7239 Richards Drive (photo 1), 16171 S Laurelwood Street (photo 1) |
Key HouseLoop Vision features
- White kitchen cabinets
- Freestanding tub
- Pool
- Home gym
- Big backyard
- Finished basement
- Kitchen island
- Two-story living room
- Fenced yard
- 3-car garage
Questions buyers ask about Johnson County, KS
- How many homes for sale in Johnson County, KS have white kitchen cabinets?
- HouseLoop Vision identified 903 homes for sale in Johnson County, KS with white kitchen cabinets. One is 5938 CATALINA Street (photo 8).
- How many homes for sale in Johnson County, KS have a freestanding tub?
- HouseLoop Vision identified 588 homes for sale in Johnson County, KS with a freestanding tub. One is 9436 Aurora Street (photo 22).
- How many homes for sale in Johnson County, KS have a pool?
- HouseLoop Vision identified 53 homes for sale in Johnson County, KS with a pool. One is 18165 Brentwood Drive (photo 1).
- How many homes for sale in Johnson County, KS have a home gym?
- HouseLoop Vision identified 168 homes for sale in Johnson County, KS with a home gym. One is 9013 W 148th Terrace (photo 34).
- How many homes for sale in Johnson County, KS have a big backyard?
- HouseLoop Vision identified 1,262 homes for sale in Johnson County, KS with a big backyard. One is 7134 Riggs Street (photo 7).
Communities in Johnson County, Kansas
Leawood
- Living in Leawood
As of Oct 15, 2026
Lenexa
- Living in Lenexa
Lenexa Hills Elementary (elementary) is rated 8 out of ten.
Mission
- Living in Mission
Broadmoor is 11 minutes away on foot.
Olathe
- Living in Olathe
As of Oct 15, 2026
Overland Park
- Living in Overland Park
Aspen Grove Elementary (elementary) is rated 9 out of ten, Aubry Bend Middle School (middle school) 10 and Blue Valley Southwest High School (high school) 9.
- Living in Century Farms
Homes here often come with a kitchen island and a deck or patio.
- Living in Chapel Hill
Homes here often come with a kitchen island and hardwood floors.
- Living in Coventry Valley
Homes here often come with a white kitchen and a kitchen island.
- Living in Lionsgate
Lakewood Middle School is rated 9 of ten.
- Living in Mills Farm
Aubry Bend Middle School (middle school) is rated 10 out of ten.
- Living in Nall Hills
Trailwood Elementary School is rated 10 of ten, Indian Woods Middle School is rated 8 and Shawnee Mission South High School is rated 8.
- Living in Oak Park
Homes here often come with a big or fenced backyard.
- Living in Polo Fields
Aubry Bend Middle School (middle school) is rated 10 out of ten.
- Living in Quivira Falls
Rosehill East Park has a playground for the kids and a paved trail for a walk and a picnic shelter for a picnic, 8 minutes by car.
- Living in Riverstone Valley
Homes here often come with a home office and a kitchen island.
- Living in Sanctuary
Homes here often come with a white kitchen and a kitchen island.
- Living in Southern Meadows
Homes here often come with a kitchen island and hardwood floors.
- Living in Sundance Ridge
Stilwell Elementary School (elementary) is rated 8 out of ten, about 3.6 miles away, Blue Valley Middle School (middle school) 9, about 2.6 miles away and Blue Valley High School (high school) 10, about 3.4 miles away.
- Living in Terrybrook Farms
Homes here often come with a deck or patio.
- Living in Wild Horse
Homes here often come with a home office and a deck or patio.
- Living in Wolf Run
Timber Sage Elementary School (elementary) is rated 9 out of ten, about 1.7 miles away, Forest Spring Middle School (middle school) 9, about 3.8 miles away and Spring Hill High School (high school) 8, about 3.8 miles away.
- Living in Woodmyre
Homes here often come with a deck or patio and a kitchen island.
Prairie Village
- Living in Prairie Village
As of Oct 15, 2026
Shawnee
- Living in Shawnee
As of Oct 17, 2026
- Living in Canyon Lakes
Homes here often come with a white kitchen and a kitchen island.
Schools serving Johnson County
| School | Median list | For sale |
|---|---|---|
| School districts | ||
| Olathe School District | Median$590,600 | 493 |
| Blue Valley School District | Median$830,425 | 462 |
| Shawnee Mission School District | Median$437,000 | 435 |
| Spring Hill School District | Median$598,855 | 299 |
| De Soto School District | Median$652,475 | 158 |
| Gardner Edgerton School District | Median$395,900 | 125 |
| High schools | ||
| Spring Hill | Median$599,150 | 273 |
| Olathe Northwest | Median$638,925 | 172 |
| Blue Valley | Median$771,566 | 147 |
| Blue Valley Southwest | Median$1,042,500 | 142 |
| Olathe West | Median$672,225 | 130 |
| Shawnee Mission East | Median$849,500 | 113 |
How we compute these
- Median list.
- The middle asking price among the homes for sale right now. Half are listed above it, half below.
- For sale.
- Homes listed as active right now. A live count, not a monthly average.
Popular home searches in Johnson County
| Search | For sale |
|---|---|
| Open houses | For sale318 |
| Luxury homes | For sale284 |
| Just listed homes | For sale149 |
| Price-reduced homes | For sale665 |
| Coming soon homes | For sale101 |
| Homes under contract | For sale1,040 |
How we compute these
- For sale.
- Homes listed as active right now. A live count, not a monthly average.
Homes by price in Johnson County
| Price range | For sale |
|---|---|
| Under $200,000 | For sale34 |
| Under $300,000 | For sale178 |
| Under $400,000 | For sale479 |
| Under $500,000 | For sale751 |
How we compute these
- For sale.
- Homes listed as active right now. A live count, not a monthly average.
Homes by feature in Johnson County
| Feature | For sale |
|---|---|
| Homes with 2+ full bathrooms | For sale1,689 |
| Homes with an attached garage | For sale1,633 |
| 2-car garage homes | For sale1,620 |
| Homes with an open floor plan | For sale1,610 |
How we compute these
- For sale.
- Homes listed as active right now. A live count, not a monthly average.
Search by property type in Johnson County
| Property type | Market (Market type is set by months of supply — how long it would take to sell every home for sale at the current pace. Under ~4 months favors sellers (low inventory, faster sales, homes near or above asking); over ~6 favors buyers (more choice, more negotiating room). 4–6 is balanced.) | Months supply | For sale | Median sale | Sell-to-list | Days to contract | Coming soon | Under contract |
|---|---|---|---|---|---|---|---|---|
| Single Family | Seller's | 2.4 mo | 1,419 | Median$485,000 | 101% | 16d | 81 | 857 |
| Townhouse | Seller's | 2.6 mo | 84 | Median$320,000 | 100% | 16d | 9 | 29 |
| Villa | — | — | — | Median— | — | — | — | — |
| Condo / Loft | Strong Seller's | 1.9 mo | 24 | Median$221,500 | 101% | 17d | 1 | 12 |
| Half Duplex | — | — | — | Median— | — | — | — | — |
| Duplex | — | — | — | Median— | — | — | — | — |
| Triplex | — | — | — | Median— | — | — | — | — |
| Quadruplex | — | — | — | Median— | — | — | — | — |
| Lots / Land | Strong Buyer's | 22.4 mo | 181 | Median$322,000 | 90% | 90d | 0 | 19 |
How we compute these
- Market.
- Market type is set by months of supply — how long it would take to sell every home for sale at the current pace. Under ~4 months favors sellers (low inventory, faster sales, homes near or above asking); over ~6 favors buyers (more choice, more negotiating room). 4–6 is balanced.
- Months supply.
- How many months it would take to sell every home now for sale at the pace of the last 90 days: homes for sale ÷ (closings in the last 90 days ÷ 3).
- For sale.
- Homes listed as active right now. A live count, not a monthly average.
- Days to contract.
- The middle number of days between a home being listed and going under contract, over the last 90 days of closings. It is not days-to-close, and it is not how long today's listings have been sitting. Newly built homes are excluded, because a build finishing is not a market moving.
- Coming soon.
- Homes announced but not yet accepting showings. A live count.
- Under contract.
- Homes with an accepted contract that have not closed yet. A live count.
Search homes in Johnson County
| City | Market (Market type is set by months of supply — how long it would take to sell every home for sale at the current pace. Under ~4 months favors sellers (low inventory, faster sales, homes near or above asking); over ~6 favors buyers (more choice, more negotiating room). 4–6 is balanced.) | Months supply | Median list | Sell-to-list | Days to contract | For sale | Coming soon | Under contract |
|---|---|---|---|---|---|---|---|---|
| Overland Park | Seller's | 2.3 mo | Median$738,561 | 101% | 16d | 493 | 29 | 293 |
| Olathe | Seller's | 3 mo | Median$614,700 | 99% | 18d | 538 | 21 | 284 |
| Shawnee | Seller's | 2.5 mo | Median$526,975 | 100% | 16d | 178 | 8 | 94 |
| Lenexa | Seller's | 2.8 mo | Median$609,000 | 98% | 21d | 194 | 13 | 77 |
| Leawood | Seller's | 3.1 mo | Median$865,000 | 100% | 18d | 142 | 9 | 61 |
| Prairie Village | Strong Seller's | 1.9 mo | Median$885,000 | 104% | 13d | 72 | 7 | 44 |
| Gardner | Seller's | 2.5 mo | Median$411,495 | 99% | 19d | 96 | 3 | 54 |
| Spring Hill | Balanced | 4.4 mo | Median$474,999 | 98% | 29d | 167 | 1 | 72 |
| Mission | Strong Seller's | 1.7 mo | Median$394,000 | 100% | 14d | 26 | 3 | 10 |
| Roeland Park | Strong Seller's | 1.7 mo | Median$355,000 | 100% | 13d | 20 | 1 | 10 |
| Merriam | Seller's | 2.6 mo | Median$285,500 | 103% | 12d | 21 | 1 | 7 |
| Fairway | Strong Seller's | 1.7 mo | Median$800,000 | 99% | 17d | 13 | 0 | 4 |
| De Soto | Balanced | 5.9 mo | Median$545,000 | 98% | 25d | 48 | 1 | 13 |
| Stilwell | Buyer's | 7.9 mo | Median$637,500 | 98% | 18d | 53 | 0 | 3 |
| Mission Hills | Strong Seller's | 1.2 mo | Median$2,285,000 | 102% | 14d | 5 | 1 | 7 |
| Edgerton | Balanced | 5 mo | Median$330,990 | 99% | 35d | 35 | 1 | 7 |
| Westwood | Seller's | 2.2 mo | Median$875,000 | 101% | 15d | 10 | 2 | 1 |
| Lake Quivira | Seller's | 3.6 mo | Median$780,000 | 87% | 68d | 3 | 0 | 2 |
| Bucyrus | Strong Buyer's | 10 mo | Median$971,510 | 95% | 21d | 22 | 2 | 4 |
| Westwood Hills | Seller's | 3 mo | Median$465,000 | 95% | — | 1 | 0 | 0 |
| Mission Woods | Strong Buyer's | 12 mo | Median— | 95% | — | 3 | 0 | 0 |
| Eudora | Strong Buyer's | 12.2 mo | Median$329,500 | 98% | 14d | 61 | 2 | 10 |
| Tonganoxie | Balanced | 5.9 mo | Median$224,500 | 100% | 28d | 110 | 1 | 21 |
How we compute these
- Market.
- Market type is set by months of supply — how long it would take to sell every home for sale at the current pace. Under ~4 months favors sellers (low inventory, faster sales, homes near or above asking); over ~6 favors buyers (more choice, more negotiating room). 4–6 is balanced.
- Months supply.
- How many months it would take to sell every home now for sale at the pace of the last 90 days: homes for sale ÷ (closings in the last 90 days ÷ 3).
- Median list.
- The middle asking price among the homes for sale right now. Half are listed above it, half below.
- Days to contract.
- The middle number of days between a home being listed and going under contract, over the last 90 days of closings. It is not days-to-close, and it is not how long today's listings have been sitting. Newly built homes are excluded, because a build finishing is not a market moving.
- For sale.
- Homes listed as active right now. A live count, not a monthly average.
- Coming soon.
- Homes announced but not yet accepting showings. A live count.
- Under contract.
- Homes with an accepted contract that have not closed yet. A live count.
ZIP codes in Johnson County
| Place | Market (Market type is set by months of supply — how long it would take to sell every home for sale at the current pace. Under ~4 months favors sellers (low inventory, faster sales, homes near or above asking); over ~6 favors buyers (more choice, more negotiating room). 4–6 is balanced.) | Months supply | Median list | Sell-to-list | Days to contract | For sale | Coming soon | Under contract |
|---|---|---|---|---|---|---|---|---|
| 66062 | Seller's | 2.6 mo | Median$609,048 | 100% | 18d | 257 | 10 | 152 |
| 66061 | Seller's | 3.4 mo | Median$615,000 | 99% | 19d | 282 | 12 | 133 |
| 66208 | Strong Seller's | 1.7 mo | Median$1,099,000 | 104% | 13d | 59 | 5 | 45 |
| 66212 | Strong Seller's | 1.2 mo | Median$358,400 | 101% | 15d | 46 | 5 | 40 |
How we compute these
- Market.
- Market type is set by months of supply — how long it would take to sell every home for sale at the current pace. Under ~4 months favors sellers (low inventory, faster sales, homes near or above asking); over ~6 favors buyers (more choice, more negotiating room). 4–6 is balanced.
- Months supply.
- How many months it would take to sell every home now for sale at the pace of the last 90 days: homes for sale ÷ (closings in the last 90 days ÷ 3).
- Median list.
- The middle asking price among the homes for sale right now. Half are listed above it, half below.
- Days to contract.
- The middle number of days between a home being listed and going under contract, over the last 90 days of closings. It is not days-to-close, and it is not how long today's listings have been sitting. Newly built homes are excluded, because a build finishing is not a market moving.
- For sale.
- Homes listed as active right now. A live count, not a monthly average.
- Coming soon.
- Homes announced but not yet accepting showings. A live count.
- Under contract.
- Homes with an accepted contract that have not closed yet. A live count.