
Banner View, Lee's Summit MO Real Estate & Homes For Sale
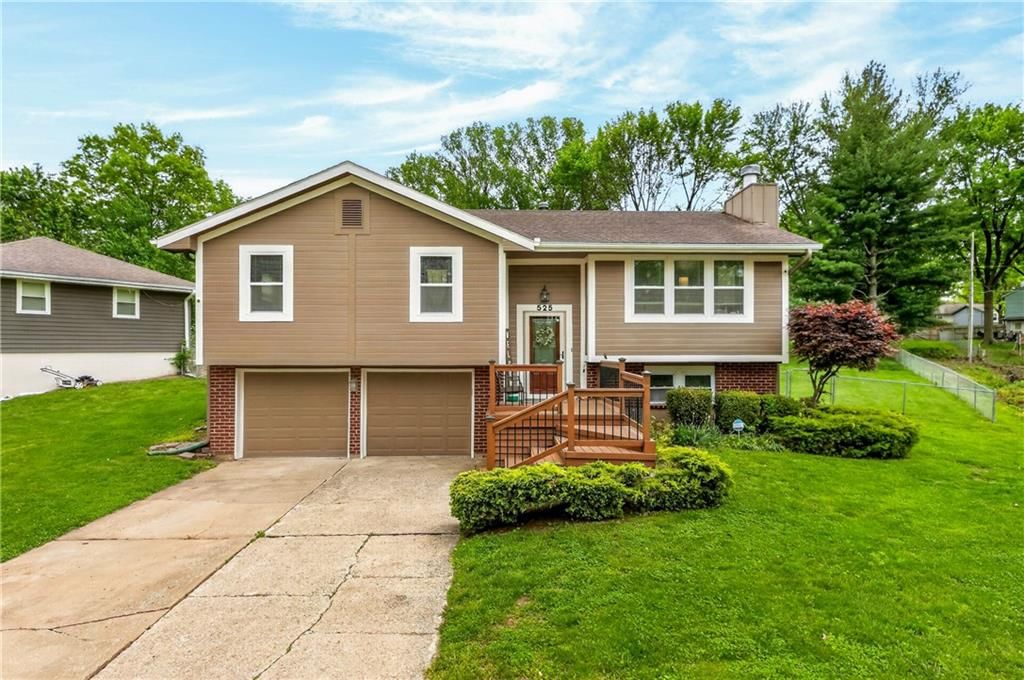
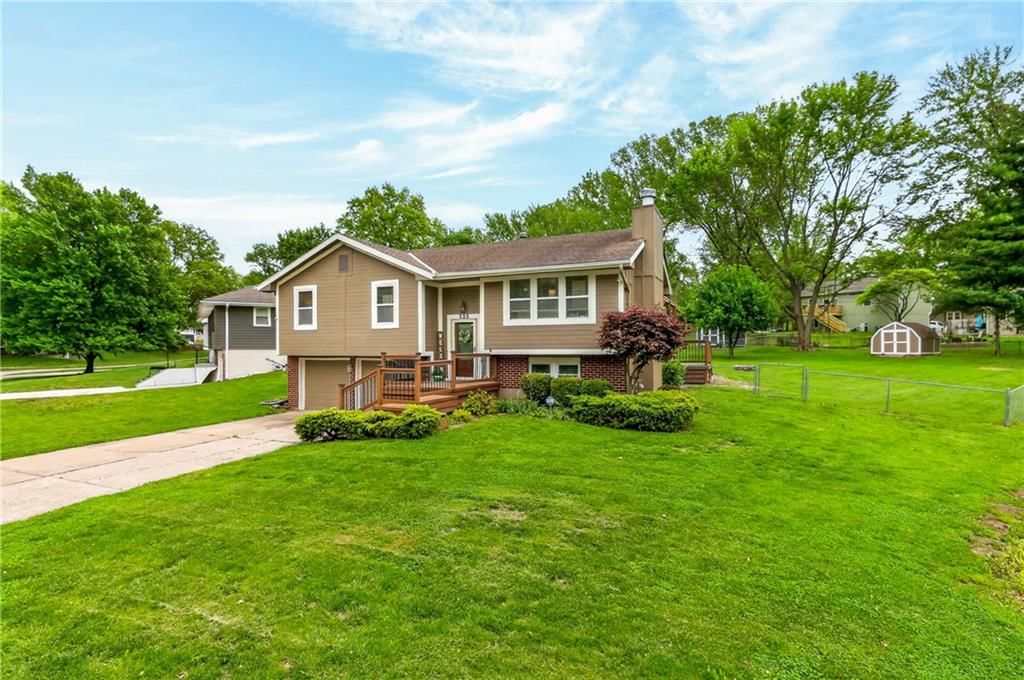
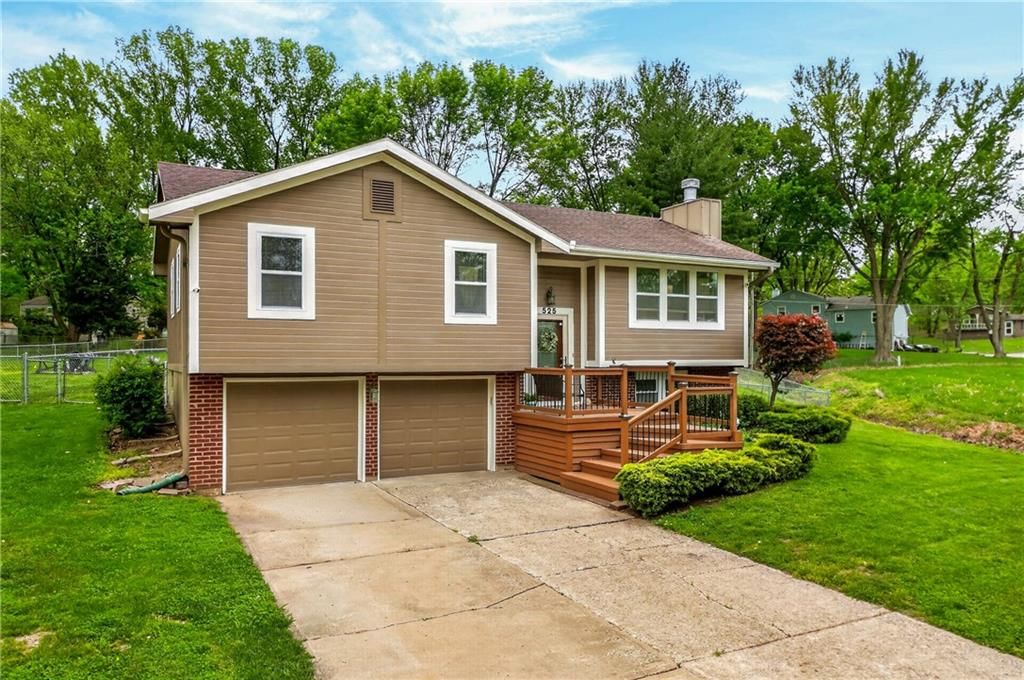
1 home in Banner View · Sorted by Newest Listed
No homes for sale in Banner View right now — showing recently sold & under contract.
Start with the numbers that matter to you
Real estate in Banner View, Lee's Summit, Missouri
Banner View, Lee's Summit has 0 homes for sale right now.
Sources — listings, prices and days on market: Heartland MLS as distributed by MLS GRID, as of October 5, 2026 · analysis and home values: HouseLoop calculations
Housing market trends in Banner View, Lee's Summit, Missouri
As of Oct 5, 2026, Banner View, Lee's Summit: 0 homes for sale.
| Measure | Oct 2025 | Sep 2025 | Oct 2024 | Change |
|---|---|---|---|---|
| Homes sold | 1 | 1 | 1 | 0% |
| New listings | 1 | 1 | 0 | — |
| Went under contract | 1 | 1 | 0 | — |
Real estate FAQs about Banner View
How many homes are for sale in Banner View, Lee's Summit?
How many homes have sold in Banner View, Lee's Summit in the past year?
② Its neighborhoods — one step out
Nearby neighborhoods to Banner View
| Neighborhood | Market (Market type is set by months of supply — how long it would take to sell every home for sale at the current pace. Under ~4 months favors sellers (low inventory, faster sales, homes near or above asking); over ~6 favors buyers (more choice, more negotiating room). 4–6 is balanced.) | Months supply | For sale | Median sale | Sell-to-list | Days to contract | Coming soon | Under contract |
|---|---|---|---|---|---|---|---|---|
| Lakewood | Seller's | 2.1 mo | 10 | $502,500 | 101% | 23d | 0 | 8 |
| Eagle Creek | Strong Seller's ▲ | 1.5 mo | 4 | $462,000 | 101% | 21d | 0 | 3 |
| Woodlawn Estates | Seller's | 3.3 mo | 20 | $332,000 | 102% | 28d | 0 | 7 |
| Condos of Oaks Ridge Meadows | Seller's | 3.4 mo | 7 | $210,000 | 100% | 18d | 0 | 3 |
| Highland Meadows | Strong Seller's | 0.7 mo | 1 | $547,917 | 100% | 47d | 0 | 1 |
| Raintree Lake | Strong Seller's | 0.9 mo | 4 | $449,500 | 100% | 23d | 1 | 1 |
How we compute these
- Market.
- Market type is set by months of supply — how long it would take to sell every home for sale at the current pace. Under ~4 months favors sellers (low inventory, faster sales, homes near or above asking); over ~6 favors buyers (more choice, more negotiating room). 4–6 is balanced.
- Months supply.
- How many months it would take to sell every home now for sale at the pace of the last 90 days: homes for sale ÷ (closings in the last 90 days ÷ 3).
- For sale.
- Homes listed as active right now. A live count, not a monthly average.
- Days to contract.
- The middle number of days between a home being listed and going under contract, over the last 90 days of closings. It is not days-to-close, and it is not how long today's listings have been sitting. Newly built homes are excluded, because a build finishing is not a market moving.
- Coming soon.
- Homes announced but not yet accepting showings. A live count.
- Under contract.
- Homes with an accepted contract that have not closed yet. A live count.
Show all 114 neighborhoods
- Lakewood
- Eagle Creek
- Woodlawn Estates
- Condos of Oaks Ridge Meadows
- Highland Meadows
- Raintree Lake
- Vista Del Verde
- Oaks Ridge Meadows
- Hook Farms
- Hawthorn Ridge
- Woodside Ridge
- Ashton at Charleston Park
- Arborwalk
- Pryor Ridge
- Winterset Valley
- Winterset Park
- White Ridge Farms
- Bent Tree Bluffs
- Raintree Villas
- Oak Tree Farms
- New Longview
- Parkwood at Stoney Creek
- Maple Tree
- Stoney Creek Estates
- Sterling Hills
- Windemere
- Napa Valley
- The Retreat at Hook Farms
- Newberry Commons
- Village Fair
- Reserve at Stoney Creek
- Monarch View
- Summit Station
- Summit View Farms
- Meadows Of Winterset
- Crystal View Estates
- Lake Ridge Meadows
- Park Ridge Manor
- Morgan Acres
- Manor at Bailey Farms
- Osage
- Briarcroft
- Foxberry Estates
- Dalton's Ridge
- Legacy Wood
- Arlington Park
- Windsboro
- Sunnybrook
- Longview Farm
- Trails of Park Ridge
- Lakewood- Chapel Ridge Woods
- Manor at Stoney Creek
- Park Ridge Summit
- Paddock at Richardson Ran
- Indian Creek South
- Knoll Brook
- Castle Rock Estates
- Cobey Creek
- Silkwood Estates
- Canterbury
- Noeleen Acres
- The Estates at Chapman Farms
- Maple Tree Manor
- Woodland Oaks
- Courchevel
- The Crossings
- Howard's Add
- Summit Crossings
- Westbrooke
- Cambridge Heights
- Bridgehampton
- Mill Creek Of Summit Mill
- Woodbury Park
- Foxwood East
- Orchard Hills
- Lochkirk
- Pin Oak Estates
- Scherer Crossing
- Cedar Creek Village
- Fields of Highland Park
- Preston Meadows
- Pine Tree Village
- Twin Creek
- Meadows at Summit Ridge
- Country Woods
- Eagle Creek- Countryside
- Whispering Woods
- Villas at Meadows of Winterset
- Raintree Reserve
- Timber Meadows
- Strother East
- Sequoia Residential
- Lawnwood
- Greenridge One
- Brentwood Estates
- Remington Park
- Hidden Creek
- Fairfield Woods
- Park Ridge Meadows
- Gatewood Hills
- Woods Chapel Park
- Windmill Ridge Estates
- Unity Ridge & Gardens
- Ridgeview Manor
- Ravencrest
- Country Meadows Estates
- Sunrise East
- Lakewood Shores
- Swall Add
- East Haven Acres
- Sunrise Addition
- Lake Ridge Meadow
- The Forests Of Brookridge Est
- Ritter's Acres
③ Nearby cities — two steps out
Search homes nearby Banner View
| Place | Market (Market type is set by months of supply — how long it would take to sell every home for sale at the current pace. Under ~4 months favors sellers (low inventory, faster sales, homes near or above asking); over ~6 favors buyers (more choice, more negotiating room). 4–6 is balanced.) | Months supply | Median list | Sell-to-list | Days to contract | For sale | Coming soon | Under contract |
|---|---|---|---|---|---|---|---|---|
| Lee's Summit | Seller's | 3 mo | $520,000 | 100% | 14d | 406 | 27 | 219 |
| Kansas City | Seller's | 4 mo | $268,000 | 100% | 18d | 2,119 | 111 | 828 |
| Independence | Seller's | 3.1 mo | $224,900 | 100% | 19d | 409 | 22 | 174 |
| Blue Springs | Seller's | 2.9 mo | $395,000 | 100% | 14d | 208 | 14 | 120 |
| Raytown | Seller's | 2.7 mo | $231,250 | 100% | 21d | 99 | 3 | 37 |
| Grandview | Seller's | 2.2 mo | $249,500 | 101% | 17d | 56 | 2 | 30 |
How we compute these
- Market.
- Market type is set by months of supply — how long it would take to sell every home for sale at the current pace. Under ~4 months favors sellers (low inventory, faster sales, homes near or above asking); over ~6 favors buyers (more choice, more negotiating room). 4–6 is balanced.
- Months supply.
- How many months it would take to sell every home now for sale at the pace of the last 90 days: homes for sale ÷ (closings in the last 90 days ÷ 3).
- Median list.
- The middle asking price among the homes for sale right now. Half are listed above it, half below.
- Days to contract.
- The middle number of days between a home being listed and going under contract, over the last 90 days of closings. It is not days-to-close, and it is not how long today's listings have been sitting. Newly built homes are excluded, because a build finishing is not a market moving.
- For sale.
- Homes listed as active right now. A live count, not a monthly average.
- Coming soon.
- Homes announced but not yet accepting showings. A live count.
- Under contract.
- Homes with an accepted contract that have not closed yet. A live count.
④ Zip codes, every city, then wider — widest
Nearby ZIP codes
| Place | Market (Market type is set by months of supply — how long it would take to sell every home for sale at the current pace. Under ~4 months favors sellers (low inventory, faster sales, homes near or above asking); over ~6 favors buyers (more choice, more negotiating room). 4–6 is balanced.) | Months supply | Median list | Sell-to-list | Days to contract | For sale | Coming soon | Under contract |
|---|---|---|---|---|---|---|---|---|
| 64083 | Balanced | 4.9 mo | $405,381 | 99% | 31d | 185 | 10 | 115 |
| 64086 | Seller's | 3.7 mo | $462,376 | 101% | 16d | 129 | 9 | 53 |
| 64064 | Seller's | 3.5 mo | $525,000 | 100% | 16d | 103 | 6 | 57 |
| 64081 | Seller's | 2.7 mo | $505,000 | 100% | 11d | 77 | 4 | 64 |
| 64063 | Seller's | 2.4 mo | $364,900 | 102% | 8d | 56 | 6 | 30 |
| 64082 | Seller's | 3.1 mo | $599,900 | 100% | 23d | 87 | 9 | 46 |
How we compute these
- Market.
- Market type is set by months of supply — how long it would take to sell every home for sale at the current pace. Under ~4 months favors sellers (low inventory, faster sales, homes near or above asking); over ~6 favors buyers (more choice, more negotiating room). 4–6 is balanced.
- Months supply.
- How many months it would take to sell every home now for sale at the pace of the last 90 days: homes for sale ÷ (closings in the last 90 days ÷ 3).
- Median list.
- The middle asking price among the homes for sale right now. Half are listed above it, half below.
- Days to contract.
- The middle number of days between a home being listed and going under contract, over the last 90 days of closings. It is not days-to-close, and it is not how long today's listings have been sitting. Newly built homes are excluded, because a build finishing is not a market moving.
- For sale.
- Homes listed as active right now. A live count, not a monthly average.
- Coming soon.
- Homes announced but not yet accepting showings. A live count.
- Under contract.
- Homes with an accepted contract that have not closed yet. A live count.
Search homes for sale in every city we cover
| City | Market (Market type is set by months of supply — how long it would take to sell every home for sale at the current pace. Under ~4 months favors sellers (low inventory, faster sales, homes near or above asking); over ~6 favors buyers (more choice, more negotiating room). 4–6 is balanced.) | Months supply | Median list | Sell-to-list | Days to contract | For sale | Coming soon | Under contract |
|---|---|---|---|---|---|---|---|---|
| Archie | Seller's | 3.2 mo | $337,450 | 100% | 45d | 15 | 1 | 5 |
| Avondale | Strong Buyer's | 12 mo | Median— | 102% | 7d | 3 | 0 | 0 |
| Basehor | Balanced | 4.5 mo | $479,275 | 100% | 34d | 97 | 3 | 53 |
| Belton | Seller's | 2.5 mo | $364,950 | 101% | 18d | 75 | 7 | 36 |
| Birmingham | Strong Buyer's | 12 mo | Median— | 101% | 8d | 2 | 0 | 0 |
| Blue Springs | Seller's | 2.9 mo | $395,000 | 100% | 14d | 208 | 14 | 120 |
How we compute these
- Market.
- Market type is set by months of supply — how long it would take to sell every home for sale at the current pace. Under ~4 months favors sellers (low inventory, faster sales, homes near or above asking); over ~6 favors buyers (more choice, more negotiating room). 4–6 is balanced.
- Months supply.
- How many months it would take to sell every home now for sale at the pace of the last 90 days: homes for sale ÷ (closings in the last 90 days ÷ 3).
- Median list.
- The middle asking price among the homes for sale right now. Half are listed above it, half below.
- Days to contract.
- The middle number of days between a home being listed and going under contract, over the last 90 days of closings. It is not days-to-close, and it is not how long today's listings have been sitting. Newly built homes are excluded, because a build finishing is not a market moving.
- For sale.
- Homes listed as active right now. A live count, not a monthly average.
- Coming soon.
- Homes announced but not yet accepting showings. A live count.
- Under contract.
- Homes with an accepted contract that have not closed yet. A live count.
Show all 109 cities
- Archie
- Avondale
- Basehor
- Belton
- Birmingham
- Blue Springs
- Bonner Springs
- Buckner
- Bucyrus
- Camden Point
- Claycomo
- Cleveland
- Creighton
- De Soto
- Dearborn
- Drexel
- East Lynne
- Easton
- Edgerton
- Edgerton
- Edwardsville
- Eudora
- Excelsior Springs
- Fairway
- Farley
- Ferrelview
- Fontana
- Freeman
- Gallatin
- Garden City
- Gardner
- Gladstone
- Grain Valley
- Grandview
- Greenwood
- Harrisonville
- Holt
- Houston Lake
- Independence
- Kansas City, MO
- Kansas City
- Kearney
- Kingsville
- Lacygne
- Lake Lotawana
- Lake Quivira
- Lake Tapawingo
- Lake Waukomis
- Lake Winnebago
- Lane
- Lansing
- Lawrence
- Lawson
- Leavenworth
- Leawood
- Lee's Summit
- Lenexa
- Levasy
- Liberty
- Linwood
- Loch Lloyd
- Lone Jack
- Louisburg
- McLouth
- Merriam
- Mission
- Mission Hills
- Mission Woods
- Missouri City
- Napoleon
- North Kansas City
- Northmoor
- Oak Grove
- Oakview
- Olathe
- Osawatomie
- Overland Park
- Paola
- Parker
- Parkville
- Peculiar
- Platte City
- Platte Woods
- Pleasant Hill
- Pleasant Valley
- Prairie Village
- Prathersville
- Raymore
- Raytown
- Riverside
- Roeland Park
- Rushville
- Shawnee
- Sibley
- Smithville
- Spring Hill
- Stilwell
- Strasburg
- Sugar Creek
- Tonganoxie
- Tracy
- Trimble
- Village Of Loch Lloyd
- Village Of Oaks
- Weatherby Lake
- Wellsville
- Weston
- Westwood
- Westwood Hills
Search for homes in popular markets
| Market | For sale |
|---|---|
| Heritage Ranch | 29 |
| Canyon Lakes | 27 |
| Garrett Ranch | 25 |
| Seven Bridges | 25 |
| Falcon Lakes | 23 |
| Boulder Creek | 21 |
How we compute these
- Market.
- Market type is set by months of supply — how long it would take to sell every home for sale at the current pace. Under ~4 months favors sellers (low inventory, faster sales, homes near or above asking); over ~6 favors buyers (more choice, more negotiating room). 4–6 is balanced.
- For sale.
- Homes listed as active right now. A live count, not a monthly average.
Show all 53 popular markets
- Heritage Ranch
- Canyon Lakes
- Garrett Ranch
- Seven Bridges
- Falcon Lakes
- Boulder Creek
- Tomahawk Valley
- Southern Meadows
- Parkside Reserve
- Woodlawn Estates
- Prairie Farms
- Wild Horse
- Ruskin Heights
- Thousand Oaks
- Heritage Farms
- Stonebridge Pointe
- Tapp Farms
- Woodmyre
- WaterCrest Landing
- The View
- Creekmoor - Cunningham
- Marlborough Heights
- Riverstone Valley
- Woodland Hills
- Vista Village
- Chapel Hill
- The Meadows At Greenfield
- Arbor Lake
- Stonebridge Villas
- Ashton Farms
- Dayton Creek
- Prairie Trace
- Providence Pointe
- Bristol Highlands
- Piper Creek Estates
- Tuscany
- The Manhattan Condominiums
- East Village of Leawood
- Prairie Canyon
- Dwyer Farms
- Sundance Ridge- Archers Landing
- Lone Star Prairie
- Riverstone
- Canyon Creek Forest
- Far View Heights
- Wolf Run
- Terrybrook Farms
- Clay Creek Meadows
- Oaks of Edgewood
- Cliffs of Watercrest
- Lakeview Ridge
- Red Hawk Run
- Sanctuary
Or go wider still county, metro and state
| Place | Market (Market type is set by months of supply — how long it would take to sell every home for sale at the current pace. Under ~4 months favors sellers (low inventory, faster sales, homes near or above asking); over ~6 favors buyers (more choice, more negotiating room). 4–6 is balanced.) | Months supply | Median list | Sell-to-list | Days to contract | For sale | Coming soon | Under contract |
|---|---|---|---|---|---|---|---|---|
| Jackson County, MO | Seller's | 3.8 mo | $274,900 | 99% | 19d | 2,920 | 141 | 1,123 |
| Clay County, MO | Seller's | 2.9 mo | $389,900 | 100% | 15d | 879 | 59 | 441 |
| Cass County, MO | Balanced | 4.6 mo | $369,450 | 99% | 27d | 656 | 28 | 250 |
| Platte County, MO | Seller's | 3.8 mo | $499,000 | 101% | 20d | 459 | 23 | 212 |
| Johnson County, KS | Seller's | 2.8 mo | $615,000 | 101% | 7d | 1,909 | 178 | 1,110 |
| Wyandotte County, KS | Seller's | 3.9 mo | $249,000 | 100% | 20d | 512 | 26 | 199 |
| Leavenworth County, KS | Balanced | 5 mo | $295,000 | 99% | 26d | 471 | 19 | 144 |
| Miami County, KS | Balanced | 5.2 mo | $325,000 | 99% | 35d | 249 | 8 | 86 |
| Kansas City metro | — | — | Median— | — | — | 7,630 | — | — |
How we compute these
- Market.
- Market type is set by months of supply — how long it would take to sell every home for sale at the current pace. Under ~4 months favors sellers (low inventory, faster sales, homes near or above asking); over ~6 favors buyers (more choice, more negotiating room). 4–6 is balanced.
- Months supply.
- How many months it would take to sell every home now for sale at the pace of the last 90 days: homes for sale ÷ (closings in the last 90 days ÷ 3).
- Median list.
- The middle asking price among the homes for sale right now. Half are listed above it, half below.
- Days to contract.
- The middle number of days between a home being listed and going under contract, over the last 90 days of closings. It is not days-to-close, and it is not how long today's listings have been sitting. Newly built homes are excluded, because a build finishing is not a market moving.
- For sale.
- Homes listed as active right now. A live count, not a monthly average.
- Coming soon.
- Homes announced but not yet accepting showings. A live count.
- Under contract.
- Homes with an accepted contract that have not closed yet. A live count.