
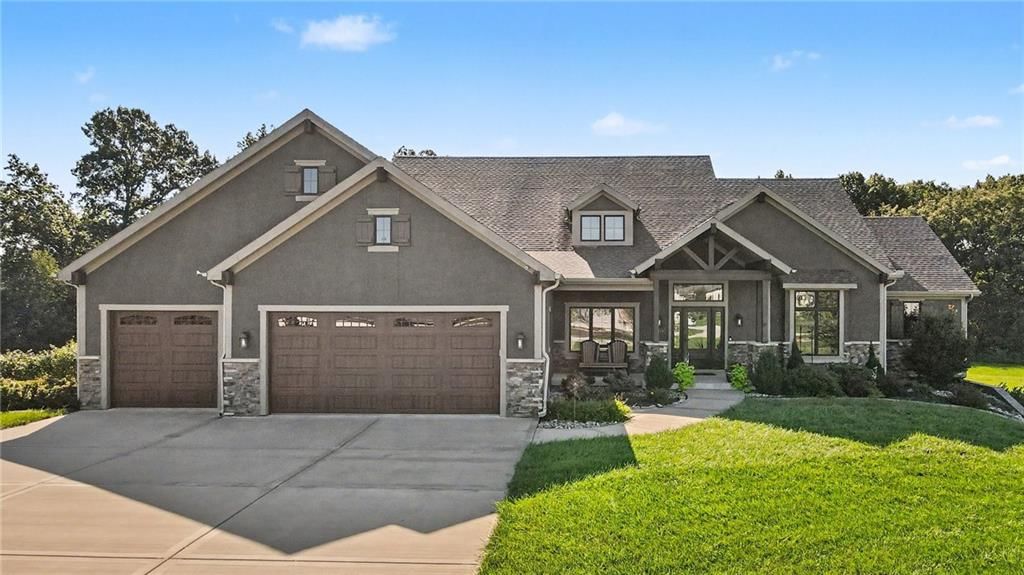
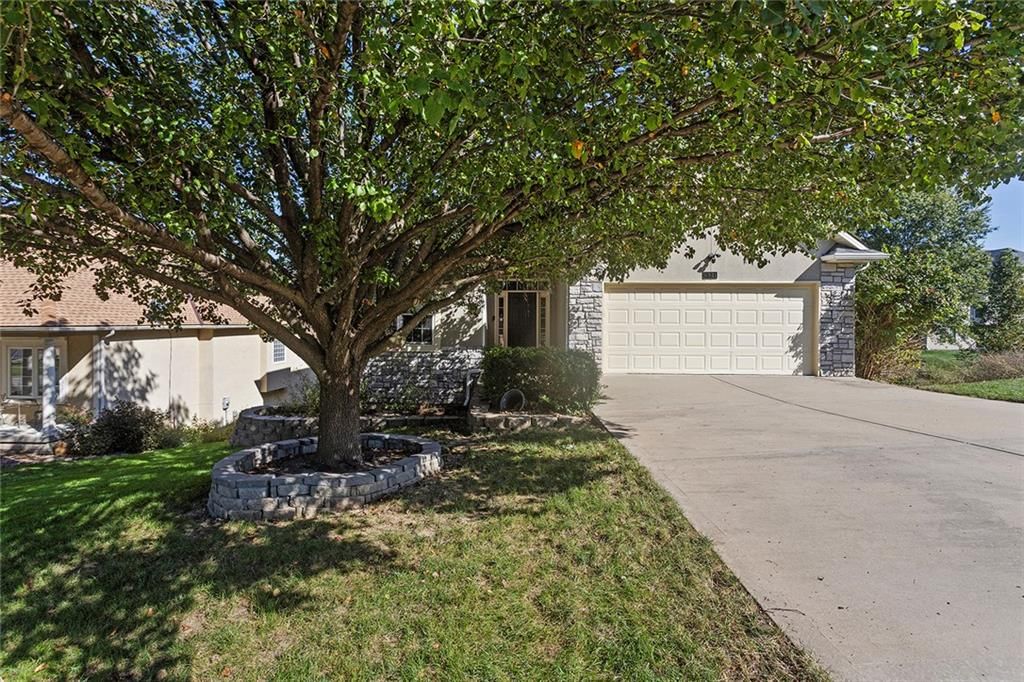
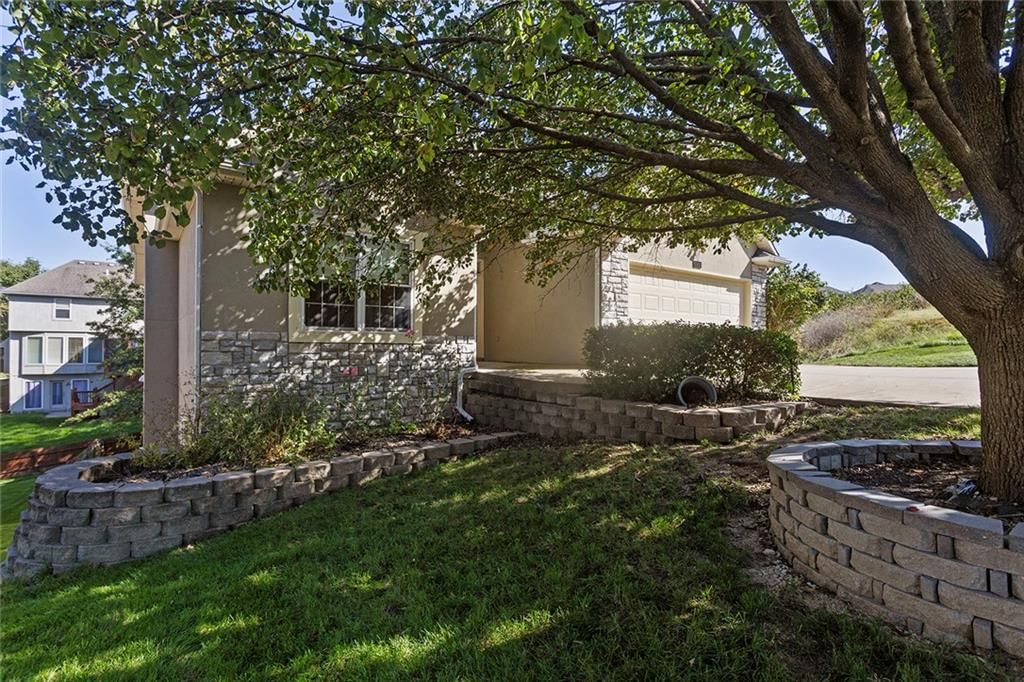
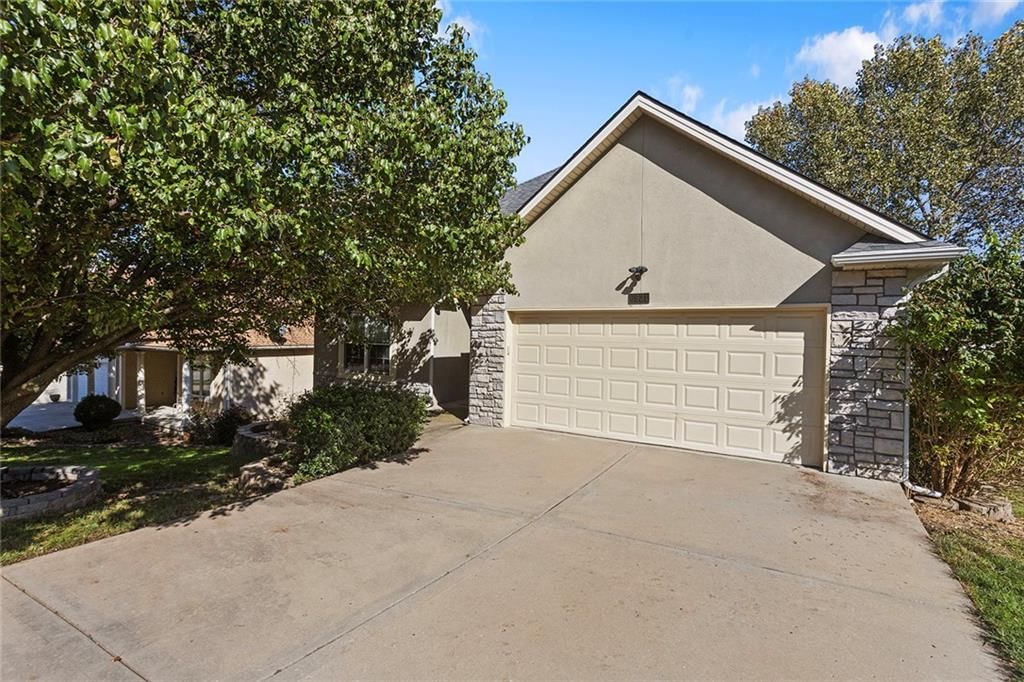
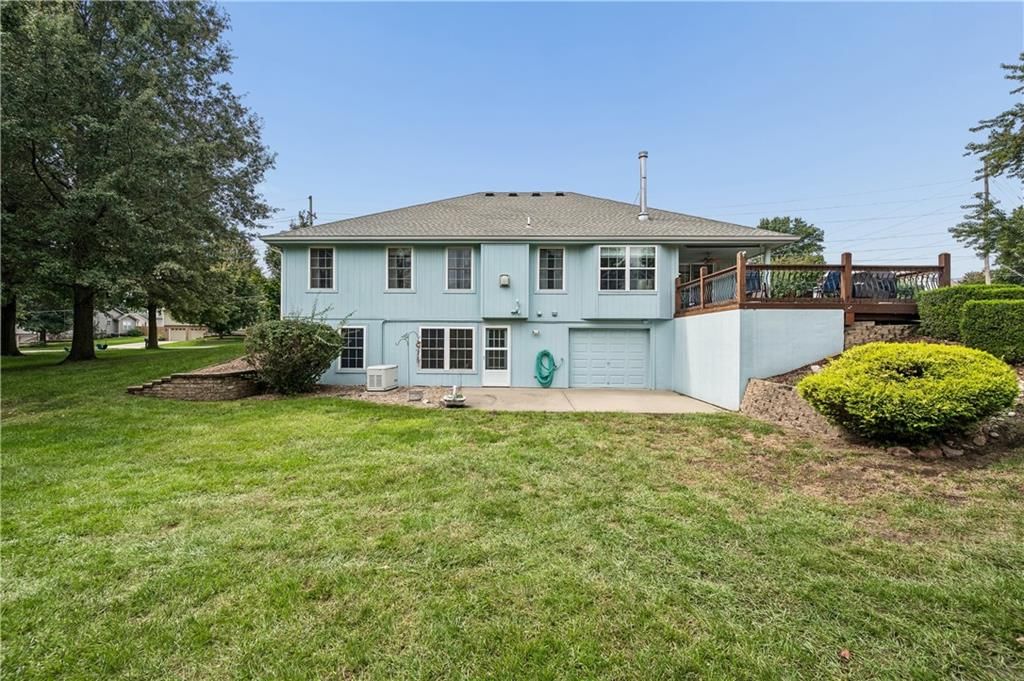
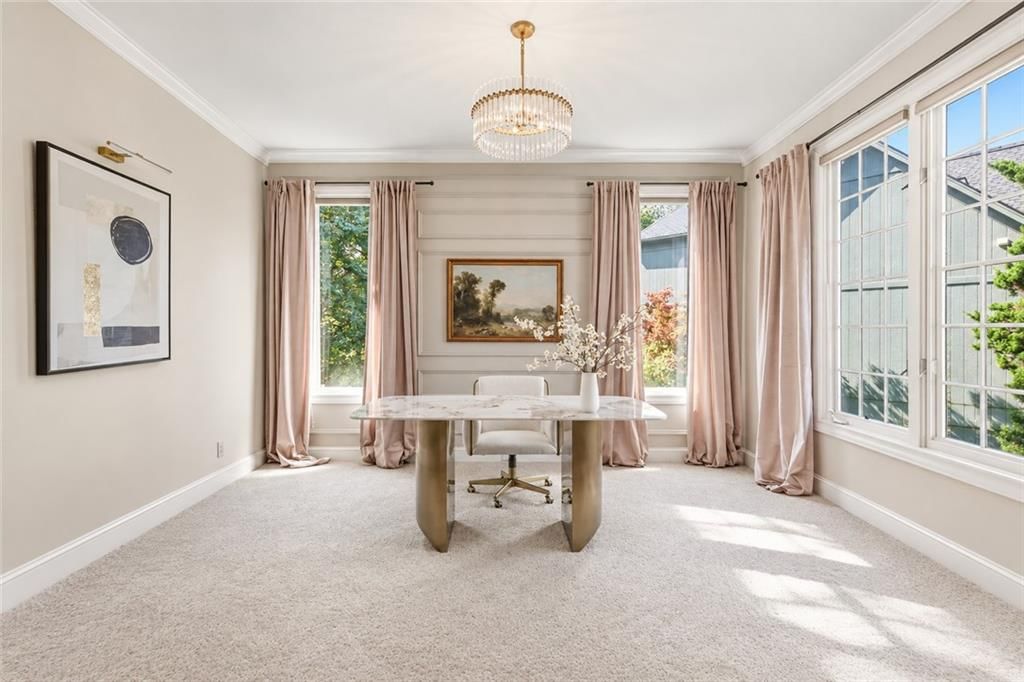
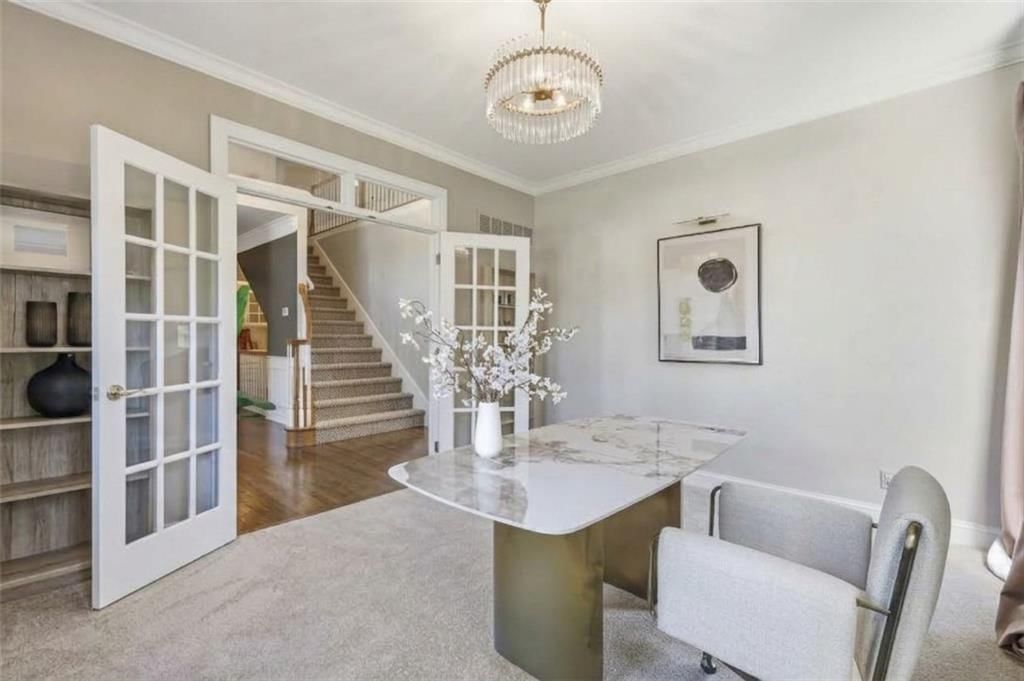
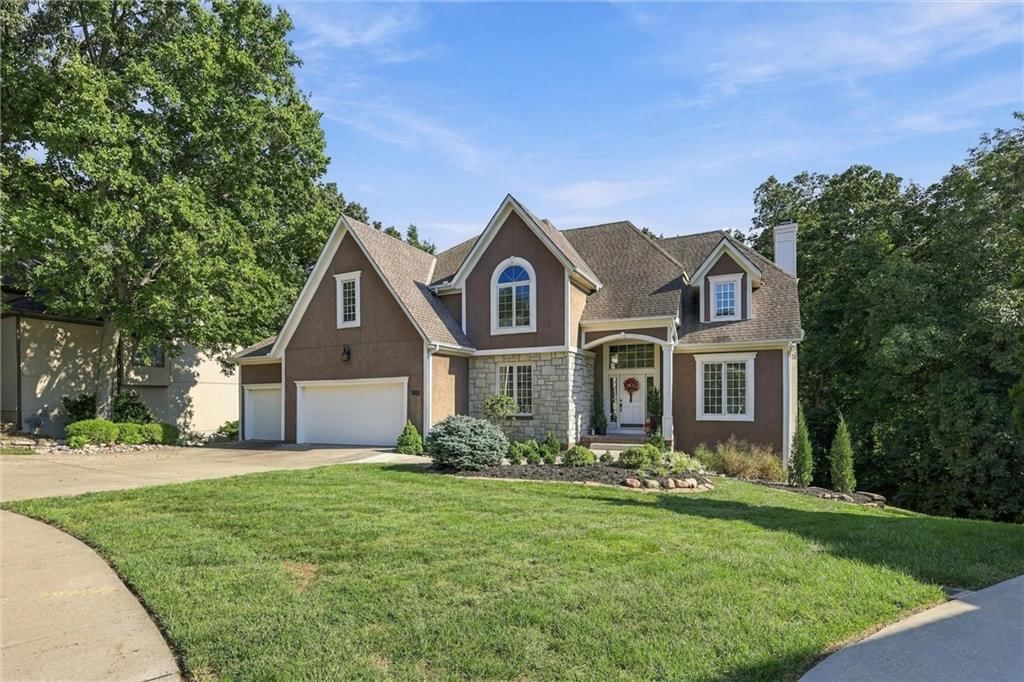
Homes with a Covered Patio for Sale in Clay County, MO
· 116 homes for sale in Clay County116 homes for sale in Clay County · Sorted by Newest Listed
Real estate in Clay County, Missouri
Clay County, MO has about 102,171 households and a median household income of $88,468. Roughly 69% of homes are owner-occupied, the median owner's home value is $275,600, 37% of adults hold a bachelor's degree or higher. The average commute runs 22.8 minutes. About 258,122 people live in Clay County, MO, per the U.S. Census Bureau's American Community Survey 5-year estimate (2020–2024). New construction is still adding supply: 27 building permits were issued in September 2026.
The real question for anyone eyeing Clay County right now is whether to move quickly or wait — and the honest answer depends on which side of the transaction you're on. This is not a market where you make an offer sight unseen on your lunch break.
Liberty is the gravitational center of Clay County's family market and earns that reputation honestly. Liberty Public Schools consistently rank among Missouri's best, the historic square gives the city an actual downtown rather than a strip-mall corridor, and the drive to downtown Kansas City runs about 20 minutes on a normal day. Inventory here tends to go faster than the county average, and buyers competing for the right street in Liberty should be pre-approved and decisive. Kearney and Smithville sit farther north and reward buyers who want more land, newer construction, and a slower pace without giving up the highway connection to the metro.
Gladstone and North Kansas City serve a completely different buyer profile. The housing stock skews older here, which means more character but also more due diligence on inspections. Pleasant Valley is small and often overlooked, but its position along the Missouri River bluffs gives it views and quiet that are genuinely hard to find this close to the city.
Excelsior Springs is the county's most underrated market for buyers willing to stretch the commute slightly. Holt and Lawson, at the county's northern edge, are rural in character and draw buyers specifically looking for acreage, hobby farms, or new builds on larger lots.
A well-maintained home in Liberty or Gladstone priced at or slightly below the per-square-foot average will behave very differently from a five-acre parcel in Holt. Buyers who treat it as a sign of weakness in the market will find the best listings don't wait for them. Clay County rewards both sides when they show up prepared.
Housing market trends in Clay County, Missouri
| Measure | Oct 2026 | Sep 2026 | Oct 2025 |
|---|---|---|---|
| Median sale price | $324,500 | $338,250 | $335,000 |
| Median price per sq ft | $182 | $184 | $176 |
| Median days to contract | 21 | 16 | 22 |
| Sell-to-list ratio | 100% | 100% | 100% |
| Homes sold | 290 | 334 | 271 |
| New listings | 374 | 398 | 351 |
| Went under contract | 296 | 299 | 269 |
Popular home searches in Clay County
| Search | For sale |
|---|---|
| Open houses | For sale66 |
| Luxury homes | For sale41 |
| Just listed homes | For sale65 |
| Price-reduced homes | For sale338 |
| Coming soon homes | For sale51 |
| Homes under contract | For sale426 |
How we compute these
- For sale.
- Homes listed as active right now. A live count, not a monthly average.
Homes by price in Clay County
| Price range | For sale |
|---|---|
| Under $200,000 | For sale133 |
| Under $300,000 | For sale300 |
| Under $400,000 | For sale483 |
| Under $500,000 | For sale619 |
How we compute these
- For sale.
- Homes listed as active right now. A live count, not a monthly average.
Search homes in Clay County
| City | Market (Market type is set by months of supply — how long it would take to sell every home for sale at the current pace. Under ~4 months favors sellers (low inventory, faster sales, homes near or above asking); over ~6 favors buyers (more choice, more negotiating room). 4–6 is balanced.) | Months supply | Median list | Sell-to-list | Days to contract | For sale | Coming soon | Under contract |
|---|---|---|---|---|---|---|---|---|
| Kansas City | Seller's | 3.8 mo | Median$259,000 | 99% | 21d | 2,168 | 103 | 776 |
| Liberty | Seller's | 2.5 mo | Median$400,000 | 98% | 25d | 103 | 9 | 48 |
| Gladstone | Seller's | 2.3 mo | Median$265,000 | 97% | 16d | 55 | 4 | 25 |
| Kearney | Balanced | 4.3 mo | Median$492,000 | 98% | 24d | 110 | 7 | 31 |
| Smithville | Seller's | 3.9 mo | Median$329,950 | 96% | 24d | 83 | 4 | 25 |
How we compute these
- Market.
- Market type is set by months of supply — how long it would take to sell every home for sale at the current pace. Under ~4 months favors sellers (low inventory, faster sales, homes near or above asking); over ~6 favors buyers (more choice, more negotiating room). 4–6 is balanced.
- Months supply.
- How many months it would take to sell every home now for sale at the pace of the last 90 days: homes for sale ÷ (closings in the last 90 days ÷ 3).
- Median list.
- The middle asking price among the homes for sale right now. Half are listed above it, half below.
- Days to contract.
- The middle number of days between a home being listed and going under contract, over the last 90 days of closings. It is not days-to-close, and it is not how long today's listings have been sitting. Newly built homes are excluded, because a build finishing is not a market moving.
- For sale.
- Homes listed as active right now. A live count, not a monthly average.
- Coming soon.
- Homes announced but not yet accepting showings. A live count.
- Under contract.
- Homes with an accepted contract that have not closed yet. A live count.