
Cass County MO Real Estate & Homes For Sale
· 652 homes for sale in Cass CountyHouseLoop Vision identified 184 homes for sale in Cass County, MO with white kitchen cabinets, 66 with a freestanding tub, 23 with a pool, 32 with a home gym, 368 with a big backyard and 173 with a finished basement, plus 4 more features. See what HouseLoop Vision found
652 homes for sale in Cass County · Sorted by Newest Listed
Real estate in Cass County, Missouri
Cass County, MO has about 43,206 households and a median household income of $87,535. Roughly 76% of homes are owner-occupied, the median owner's home value is $292,400, 30% of adults hold a bachelor's degree or higher. The average commute runs 28.0 minutes. About 110,773 people live in Cass County, MO, per the U.S. Census Bureau's American Community Survey 5-year estimate (2020–2024). New construction is still adding supply: 24 building permits were issued in September 2026.
The real question for anyone eyeing Cass County right now is simple: is this a place to get a deal, or a place to get stuck? For buyers, the honest answer is yes to both — if you know which cities to target.
Homes that are priced right are moving. The ones chasing last year's numbers are the ones sitting.
Raymore and Belton anchor the northern end of the county closest to Kansas City, and they draw the largest share of commuter buyers. Both cities have Raymore-Peculiar school district coverage, which consistently ranks among the stronger districts in the metro and is genuinely a selling point, not just marketing language. Belton carries a slightly older housing stock but offers lower price points and quick access to I-49, making it a first-time buyer favorite. Peculiar sits just south and has that small-town identity that buyers either find charming or feel is too removed — worth a visit before committing.
Harrisonville is the county seat and functions as the commercial and civic center of Cass County. Pleasant Hill and Garden City appeal to buyers who want acreage without paying Loch Lloyd prices, and both communities have a genuinely rural character that holds. Lee's Summit technically bleeds into Cass County on its southern edge, and homes listed there carry some of that Lee's Summit brand premium. Cleveland and Archie are the furthest south and are honestly best suited for buyers prioritizing land and quiet over commute convenience.
For sellers: the data is not alarming, but it is honest. A well-prepared, correctly priced home in Raymore or Belton should not take four months to sell. If a listing is sitting, price is almost always the reason. Cass County rewards buyers who do the homework on which city fits their actual life.
Housing market trends in Cass County, Missouri
| Measure | Oct 2026 | Sep 2026 | Oct 2025 |
|---|---|---|---|
| Median sale price | $320,000 | $349,990 | $344,950 |
| Median price per sq ft | $186 | $189 | $188 |
| Median days to contract | 26 | 22 | 27 |
| Sell-to-list ratio | 100% | 100% | 100% |
| Homes sold | 153 | 161 | 140 |
| New listings | 208 | 242 | 165 |
| Went under contract | 143 | 160 | 124 |


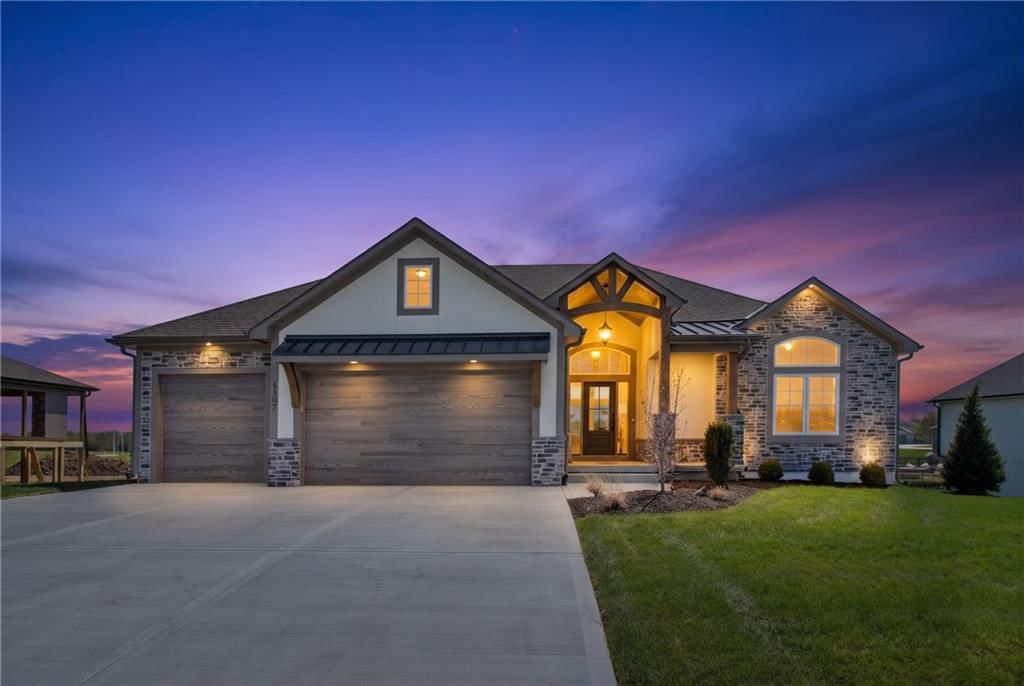
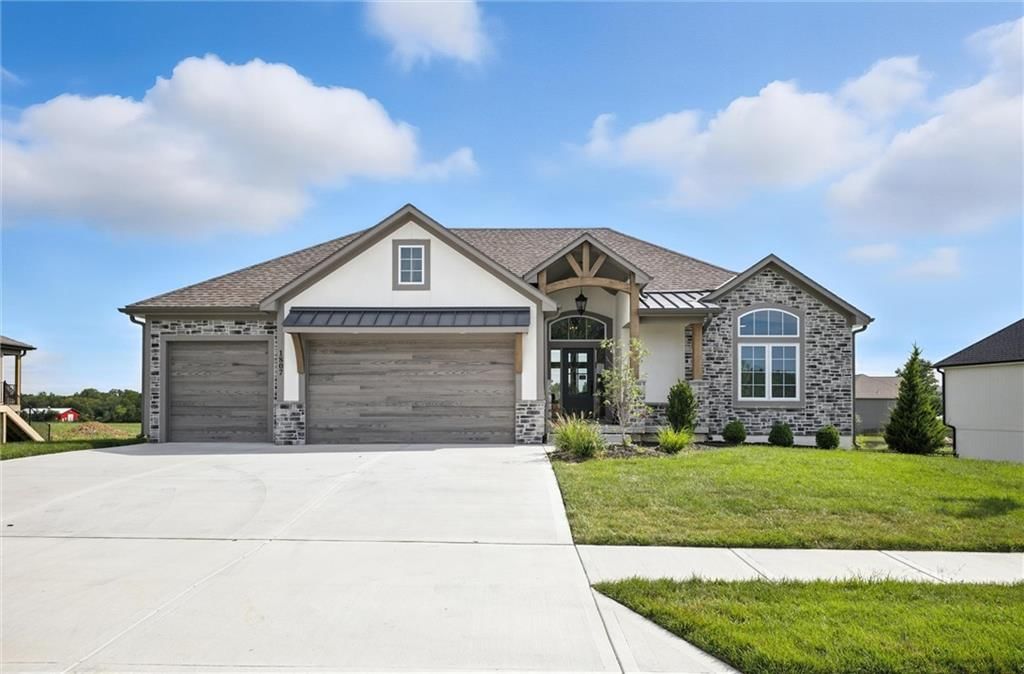
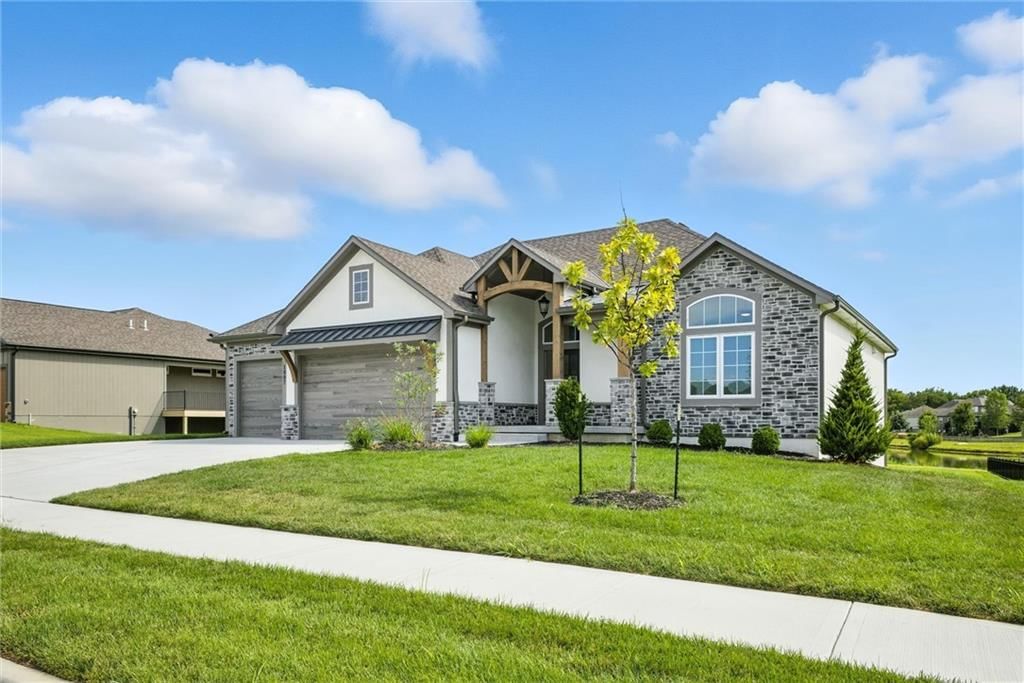
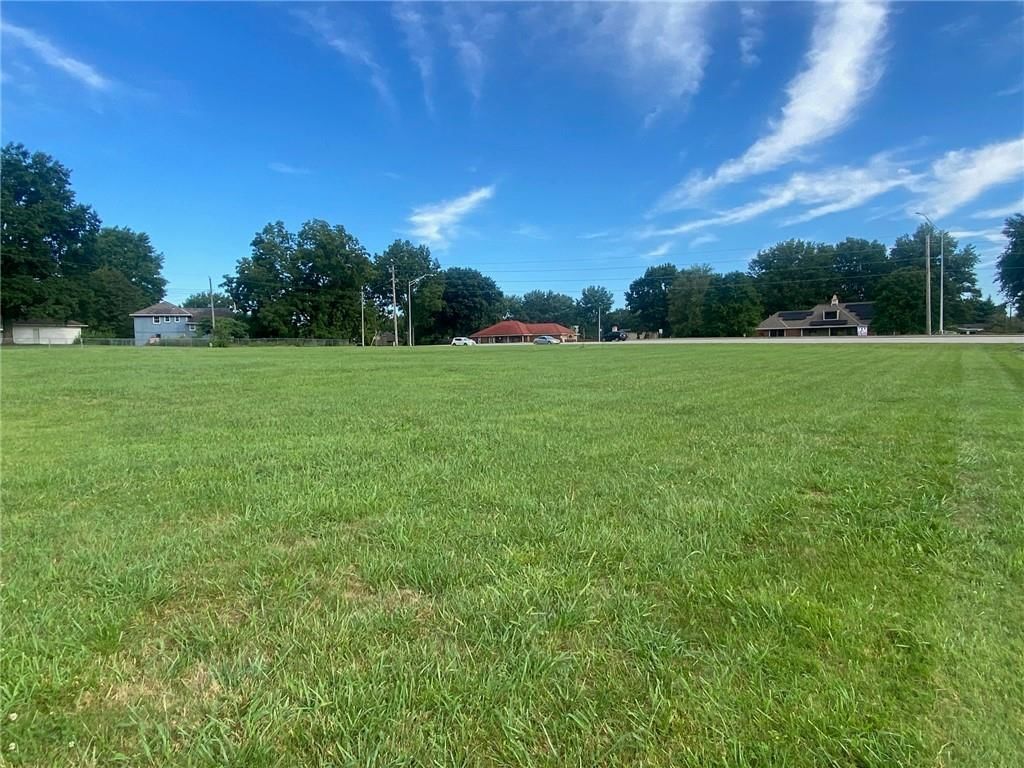
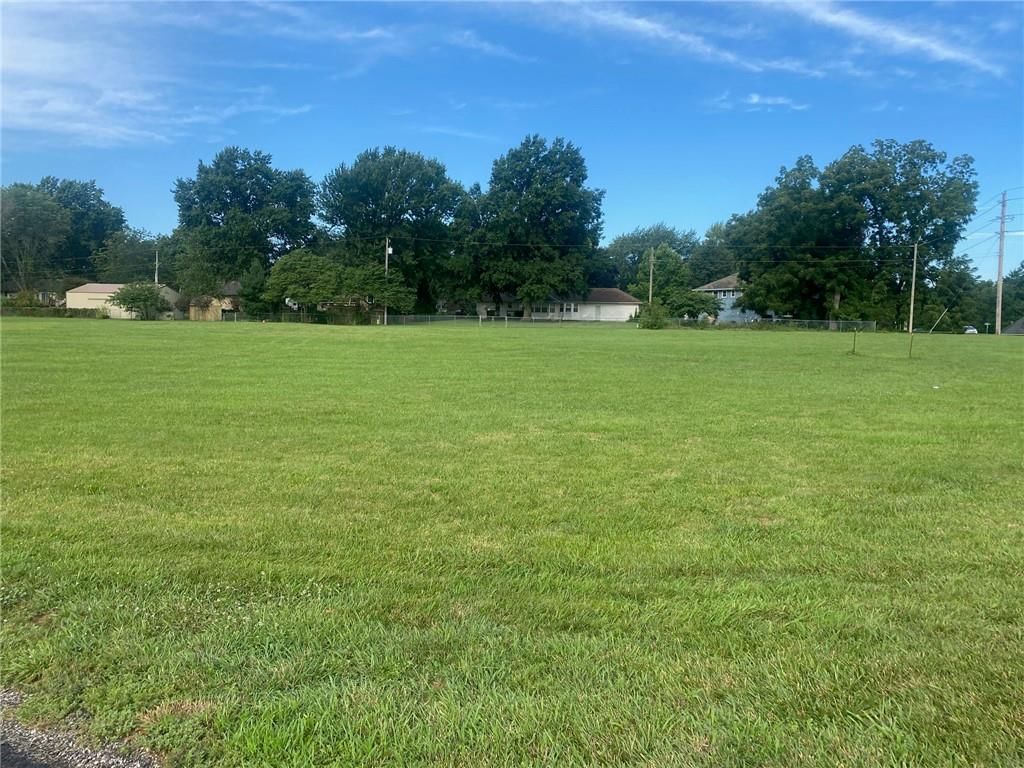
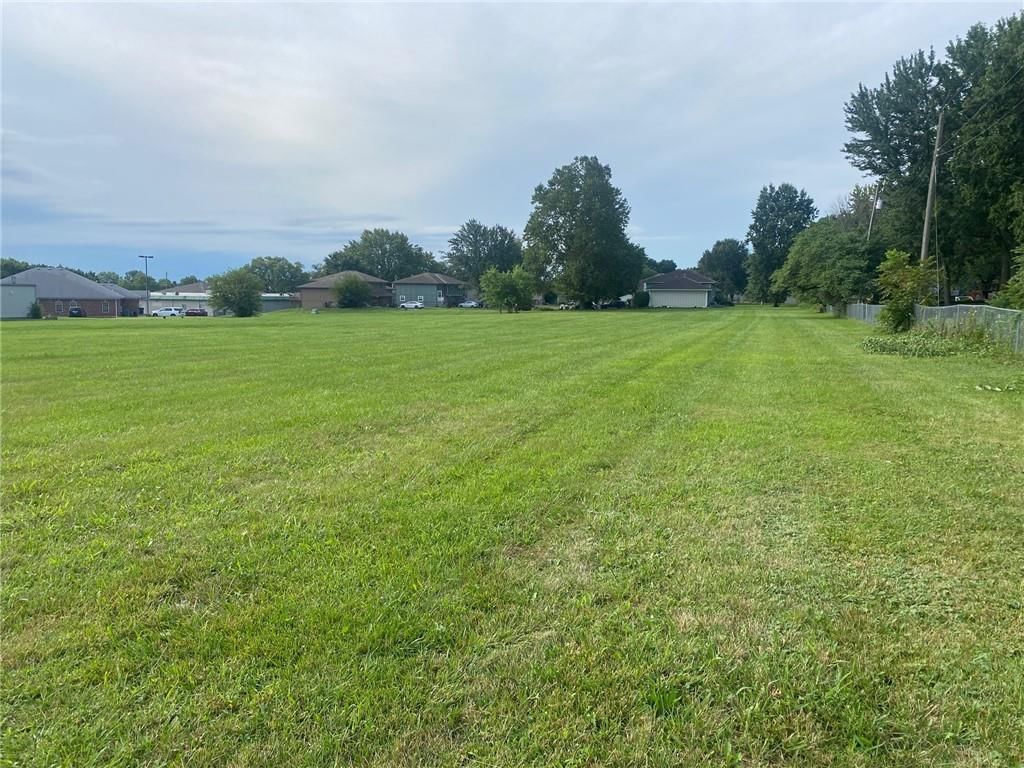


HouseLoop Vision in Cass County, MO
As of Nov 16, 2026
HouseLoop Vision identified 184 homes for sale in Cass County, MO with white kitchen cabinets, 66 with a freestanding tub, 23 with a pool, 32 with a home gym, 368 with a big backyard and 173 with a finished basement, plus 4 more features.
HouseLoop Vision has looked at the photos of 613 of the 652 homes for sale in Cass County, MO. 39 haven't been looked at yet.
| HouseLoop Vision feature | Homes for sale | Where HouseLoop Vision saw it |
|---|---|---|
| White kitchen cabinets | 184 | 125 Sitter Street (photo 3), 1811 Halls Creek Avenue (photo 7) |
| Freestanding tub | 66 | 1211 Belinder Drive (photo 20), 518 Johnston Parkway (photo 20), 916 Old Mill Road (photo 20) |
| Pool | 23 | 50 Hever Knoll (photo 5), 16900 S Stonehaven Drive (photo 50), 12908 E 244th Street (photo 39) |
| Home gym | 32 | 1210 S Cedar Street (photo 17), 810 Logan Avenue (photo 35), 16917 Cross Creek Drive (photo 26) |
| Big backyard | 368 | 28108 Missouri 7 Highway (photo 1), 26607 E 291st Street (photo 59) |
| Finished basement | 173 | 406 N Adams Street (photo 27), 11808 E 231st Street (photo 14), 415 Park Avenue (photo 27) |
| Kitchen island | 285 | 11603 Centennial Street (photo 7), 210 W Sunrise Drive (photo 9) |
| Two-story living room | 67 | 16008 Argyle Drive (photo 23), 247 N Franklin Street (photo 5), 1221 Deaton Circle (photo 3) |
| Fenced yard | 191 | 902 Ingleside Drive (photo 41), 505 Baldwin Street (photo 26), 18803 S Sunrise Drive (photo 25) |
| 3-car garage | 75 | 901 S Ash Street (photo 1), 16204 Bluegrass Court (photo 1), 22701 Shadow Glen Drive (photo 35) |
Key HouseLoop Vision features
- White kitchen cabinets
- Freestanding tub
- Pool
- Home gym
- Big backyard
- Finished basement
- Kitchen island
- Two-story living room
- Fenced yard
- 3-car garage
Questions buyers ask about Cass County, MO
- How many homes for sale in Cass County, MO have white kitchen cabinets?
- HouseLoop Vision identified 184 homes for sale in Cass County, MO with white kitchen cabinets. One is 125 Sitter Street (photo 3).
- How many homes for sale in Cass County, MO have a freestanding tub?
- HouseLoop Vision identified 66 homes for sale in Cass County, MO with a freestanding tub. One is 1211 Belinder Drive (photo 20).
- How many homes for sale in Cass County, MO have a pool?
- HouseLoop Vision identified 23 homes for sale in Cass County, MO with a pool. One is 50 Hever Knoll (photo 5).
- How many homes for sale in Cass County, MO have a home gym?
- HouseLoop Vision identified 32 homes for sale in Cass County, MO with a home gym. One is 1210 S Cedar Street (photo 17).
- How many homes for sale in Cass County, MO have a big backyard?
- HouseLoop Vision identified 368 homes for sale in Cass County, MO with a big backyard. One is 28108 Missouri 7 Highway (photo 1).
Schools serving Cass County
| School | Median list | For sale |
|---|---|---|
| School districts | ||
| Raymore-Peculiar School District | Median$389,900 | 275 |
| Belton School District | Median$379,990 | 89 |
| Harrisonville School District | Median$305,000 | 79 |
| Pleasant Hill School District | Median$288,950 | 76 |
| Sherwood School District | Median$250,000 | 33 |
| Cass-Midway School District | Median$220,000 | 31 |
| East Lynne School District | Median$235,300 | 20 |
| Archie School District | Median$419,950 | 18 |
| Drexel School District | Median— | — |
| Lee's Summit School District | Median— | — |
| High schools | ||
| Raymore-Peculiar | Median$398,495 | 200 |
| Pleasant Hill | Median$274,900 | 51 |
How we compute these
- Median list.
- The middle asking price among the homes for sale right now. Half are listed above it, half below.
- For sale.
- Homes listed as active right now. A live count, not a monthly average.
Popular home searches in Cass County
| Search | For sale |
|---|---|
| Open houses | For sale36 |
| Luxury homes | For sale55 |
| Just listed homes | For sale33 |
| Price-reduced homes | For sale259 |
| Coming soon homes | For sale21 |
| Homes under contract | For sale234 |
How we compute these
- For sale.
- Homes listed as active right now. A live count, not a monthly average.
Homes by price in Cass County
| Price range | For sale |
|---|---|
| Under $200,000 | For sale126 |
| Under $300,000 | For sale248 |
| Under $400,000 | For sale398 |
| Under $500,000 | For sale475 |
How we compute these
- For sale.
- Homes listed as active right now. A live count, not a monthly average.
Homes by feature in Cass County
| Feature | For sale |
|---|---|
| Two or more stories | For sale429 |
| Homes with no HOA | For sale407 |
| Homes with 2+ full bathrooms | For sale387 |
| 2-car garage homes | For sale364 |
How we compute these
- For sale.
- Homes listed as active right now. A live count, not a monthly average.
Search by property type in Cass County
| Property type | Market (Market type is set by months of supply — how long it would take to sell every home for sale at the current pace. Under ~4 months favors sellers (low inventory, faster sales, homes near or above asking); over ~6 favors buyers (more choice, more negotiating room). 4–6 is balanced.) | Months supply | For sale | Median sale | Sell-to-list | Days to contract | Coming soon | Under contract |
|---|---|---|---|---|---|---|---|---|
| Single Family | Seller's | 3.2 mo | 404 | Median$355,000 | 99% | 23d | 19 | 209 |
| Townhouse | — | — | — | Median— | — | — | — | — |
| Villa | — | — | — | Median— | — | — | — | — |
| Half Duplex | — | — | — | Median— | — | — | — | — |
| Duplex | — | — | — | Median— | — | — | — | — |
| Lots / Land | Strong Buyer's | 15.8 mo | 203 | Median$200,000 | 92% | 22d | 1 | 10 |
How we compute these
- Market.
- Market type is set by months of supply — how long it would take to sell every home for sale at the current pace. Under ~4 months favors sellers (low inventory, faster sales, homes near or above asking); over ~6 favors buyers (more choice, more negotiating room). 4–6 is balanced.
- Months supply.
- How many months it would take to sell every home now for sale at the pace of the last 90 days: homes for sale ÷ (closings in the last 90 days ÷ 3).
- For sale.
- Homes listed as active right now. A live count, not a monthly average.
- Days to contract.
- The middle number of days between a home being listed and going under contract, over the last 90 days of closings. It is not days-to-close, and it is not how long today's listings have been sitting. Newly built homes are excluded, because a build finishing is not a market moving.
- Coming soon.
- Homes announced but not yet accepting showings. A live count.
- Under contract.
- Homes with an accepted contract that have not closed yet. A live count.
Search homes in Cass County
| City | Market (Market type is set by months of supply — how long it would take to sell every home for sale at the current pace. Under ~4 months favors sellers (low inventory, faster sales, homes near or above asking); over ~6 favors buyers (more choice, more negotiating room). 4–6 is balanced.) | Months supply | Median list | Sell-to-list | Days to contract | For sale | Coming soon | Under contract |
|---|---|---|---|---|---|---|---|---|
| Raymore | Balanced | 4.5 mo | Median$379,950 | 96% | 26d | 189 | 9 | 100 |
| Belton | Seller's | 2.7 mo | Median$350,000 | 100% | 23d | 79 | 2 | 43 |
| Pleasant Hill | Balanced | 4.6 mo | Median$254,900 | 97% | 26d | 85 | 3 | 17 |
| Harrisonville | Balanced | 4.9 mo | Median$322,500 | 93% | 29d | 88 | 2 | 16 |
| Peculiar | Balanced | 4.5 mo | Median$369,990 | 95% | 30d | 76 | 3 | 31 |
| Lee's Summit | Seller's | 2.9 mo | Median$500,000 | 98% | 19d | 426 | 17 | 227 |
| Garden City | Balanced | 5.1 mo | Median$265,000 | 96% | 30d | 26 | 0 | 6 |
| Loch Lloyd | Buyer's | 6.9 mo | Median$1,595,000 | 88% | 49d | 16 | 0 | 2 |
| Cleveland | Balanced | 5.5 mo | Median$308,900 | 110% | 30d | 13 | 1 | 3 |
| Archie | Seller's ▲ | 2.8 mo | Median$389,000 | 95% | 38d | 13 | 0 | 4 |
| Lake Winnebago | Strong Buyer's | 8.4 mo | Median$1,059,000 | 100% | 76d | 19 | 0 | 4 |
| Drexel | Buyer's | 6.9 mo | Median$235,000 | 100% | 36d | 20 | 0 | 6 |
| Freeman | Strong Buyer's | 11 mo | Median$235,000 | 85% | 30d | 21 | 0 | 1 |
| Creighton | Buyer's | 6.3 mo | Median$259,000 | 90% | 75d | 12 | 0 | 1 |
| East Lynne | Strong Buyer's | 13.2 mo | Median$45,000 | 98% | 42d | 11 | 0 | 3 |
| Greenwood | Seller's | 2.6 mo | Median$694,850 | 99% | 16d | 28 | 1 | 12 |
| Strasburg | Strong Buyer's | 12 mo | Median$15,000 | 93% | — | 1 | 0 | 0 |
| Kingsville | Strong Buyer's | 12 mo | Median$365,000 | 87% | 22d | 54 | 0 | 9 |
| Village Of Loch Lloyd | — | — | Median$6,750,000 | — | — | 1 | 0 | 0 |
How we compute these
- Market.
- Market type is set by months of supply — how long it would take to sell every home for sale at the current pace. Under ~4 months favors sellers (low inventory, faster sales, homes near or above asking); over ~6 favors buyers (more choice, more negotiating room). 4–6 is balanced.
- Months supply.
- How many months it would take to sell every home now for sale at the pace of the last 90 days: homes for sale ÷ (closings in the last 90 days ÷ 3).
- Median list.
- The middle asking price among the homes for sale right now. Half are listed above it, half below.
- Days to contract.
- The middle number of days between a home being listed and going under contract, over the last 90 days of closings. It is not days-to-close, and it is not how long today's listings have been sitting. Newly built homes are excluded, because a build finishing is not a market moving.
- For sale.
- Homes listed as active right now. A live count, not a monthly average.
- Coming soon.
- Homes announced but not yet accepting showings. A live count.
- Under contract.
- Homes with an accepted contract that have not closed yet. A live count.
ZIP codes in Cass County
| Place | Market (Market type is set by months of supply — how long it would take to sell every home for sale at the current pace. Under ~4 months favors sellers (low inventory, faster sales, homes near or above asking); over ~6 favors buyers (more choice, more negotiating room). 4–6 is balanced.) | Months supply | Median list | Sell-to-list | Days to contract | For sale | Coming soon | Under contract |
|---|---|---|---|---|---|---|---|---|
| 64083 | Balanced | 4.5 mo | Median$379,900 | 96% | 27d | 198 | 9 | 109 |
| 64012 | Seller's | 3.1 mo | Median$384,490 | 97% | 23d | 97 | 2 | 44 |
| 64080 | Balanced | 4.6 mo | Median$252,450 | 96% | 27d | 84 | 3 | 17 |
| 64701 | Balanced | 4.9 mo | Median$322,500 | 93% | 29d | 88 | 2 | 16 |
How we compute these
- Market.
- Market type is set by months of supply — how long it would take to sell every home for sale at the current pace. Under ~4 months favors sellers (low inventory, faster sales, homes near or above asking); over ~6 favors buyers (more choice, more negotiating room). 4–6 is balanced.
- Months supply.
- How many months it would take to sell every home now for sale at the pace of the last 90 days: homes for sale ÷ (closings in the last 90 days ÷ 3).
- Median list.
- The middle asking price among the homes for sale right now. Half are listed above it, half below.
- Days to contract.
- The middle number of days between a home being listed and going under contract, over the last 90 days of closings. It is not days-to-close, and it is not how long today's listings have been sitting. Newly built homes are excluded, because a build finishing is not a market moving.
- For sale.
- Homes listed as active right now. A live count, not a monthly average.
- Coming soon.
- Homes announced but not yet accepting showings. A live count.
- Under contract.
- Homes with an accepted contract that have not closed yet. A live count.