
Just Listed Homes in Cass County, MO
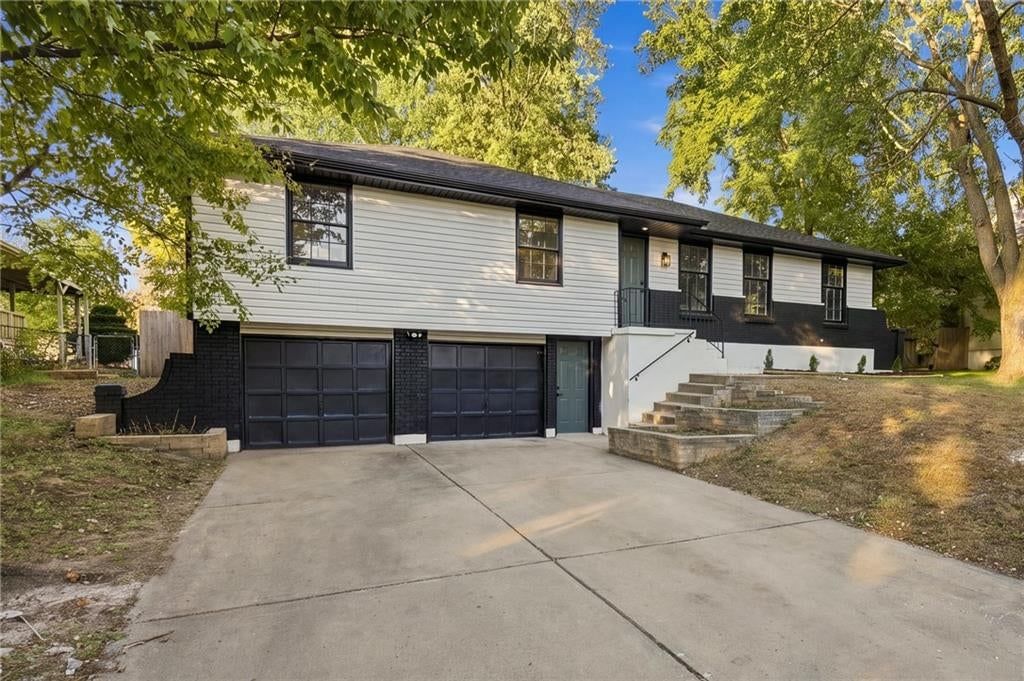
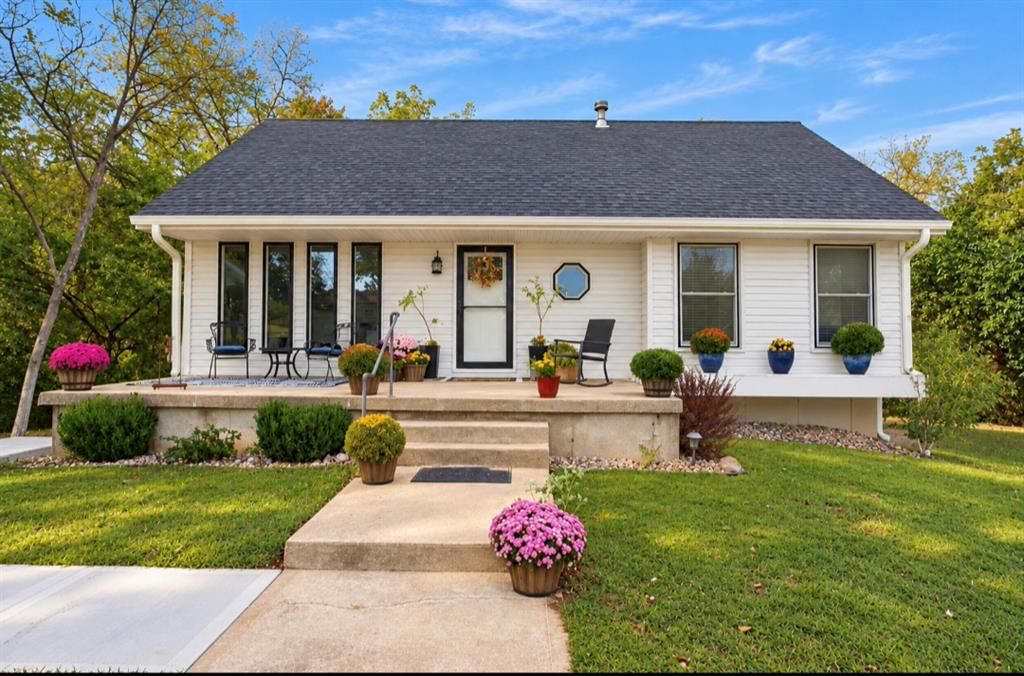
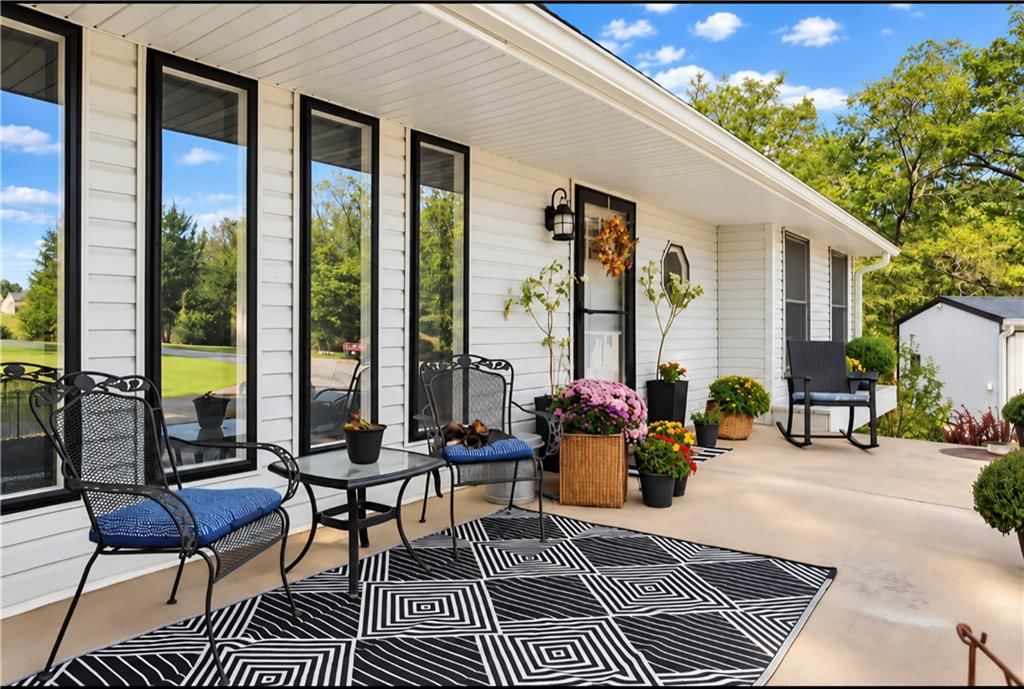
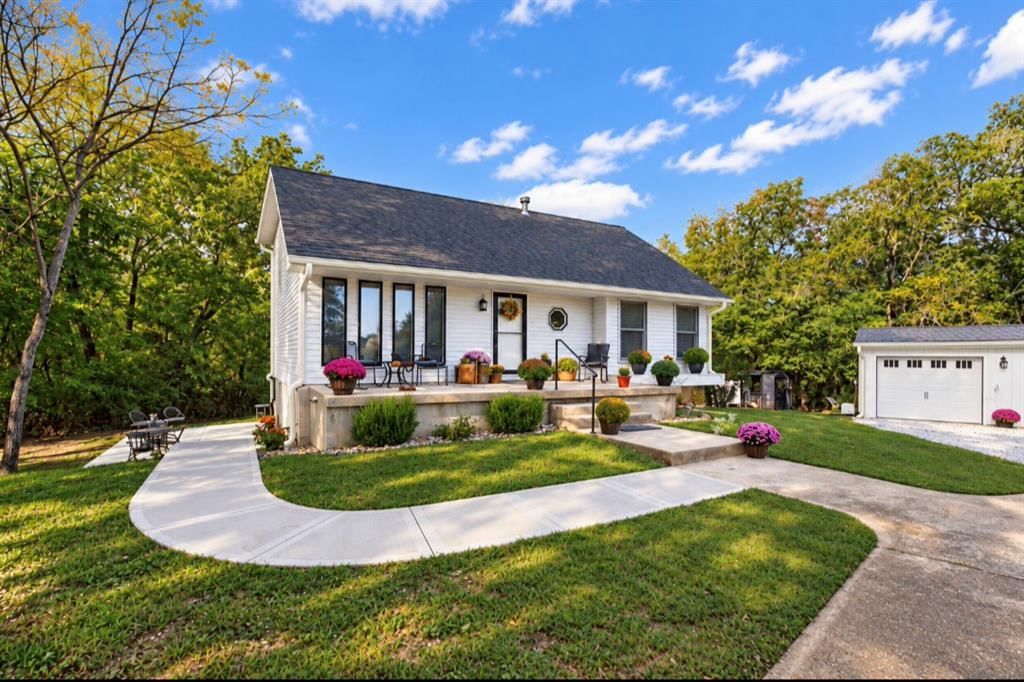
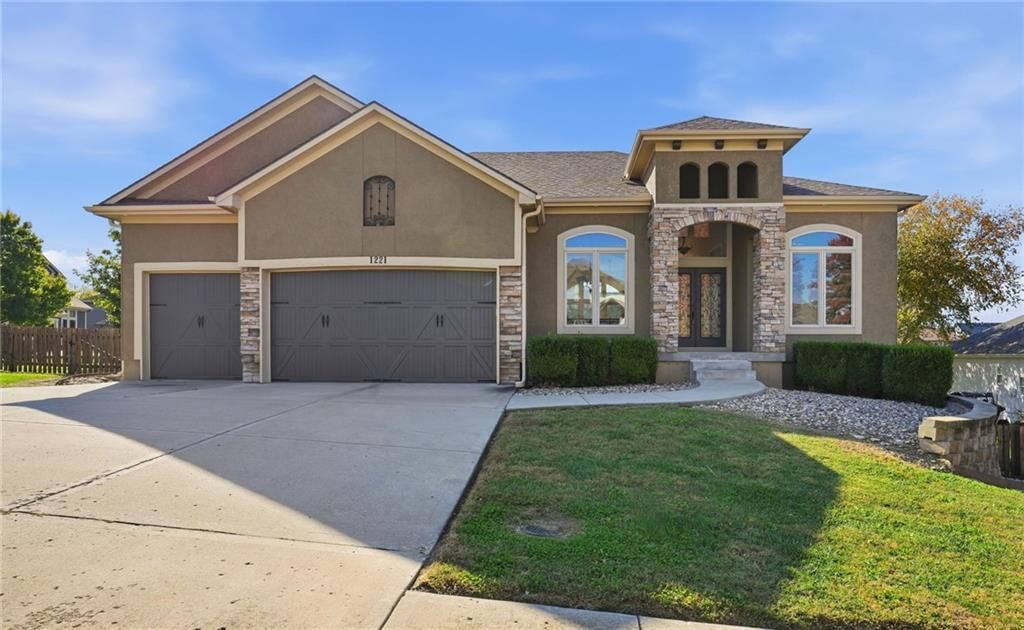
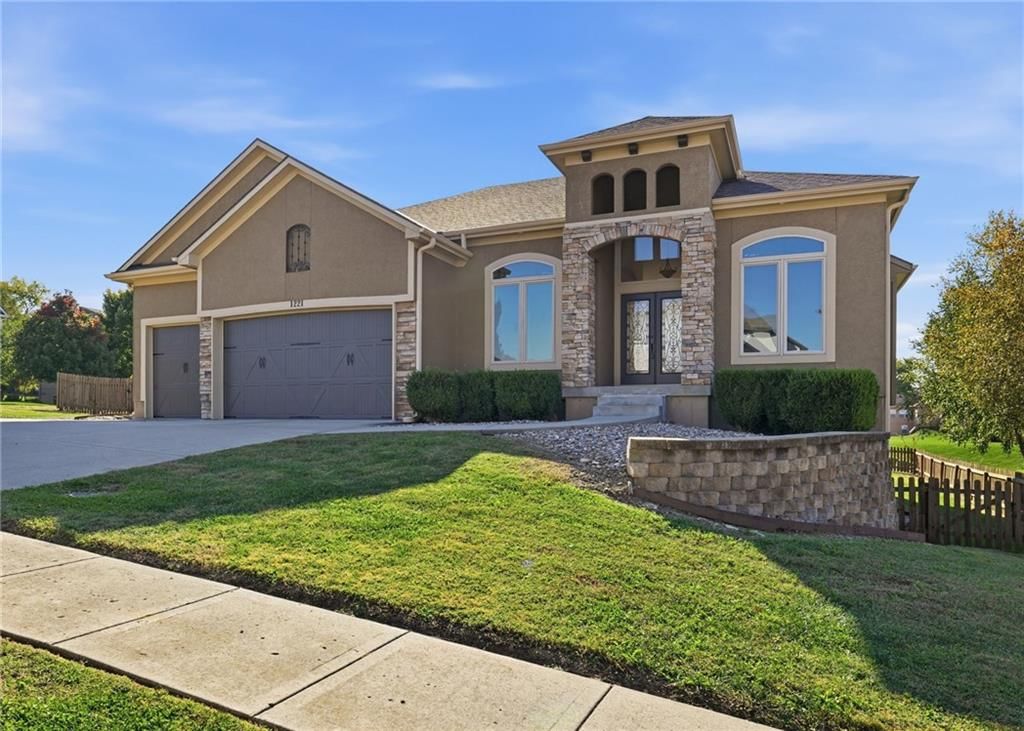
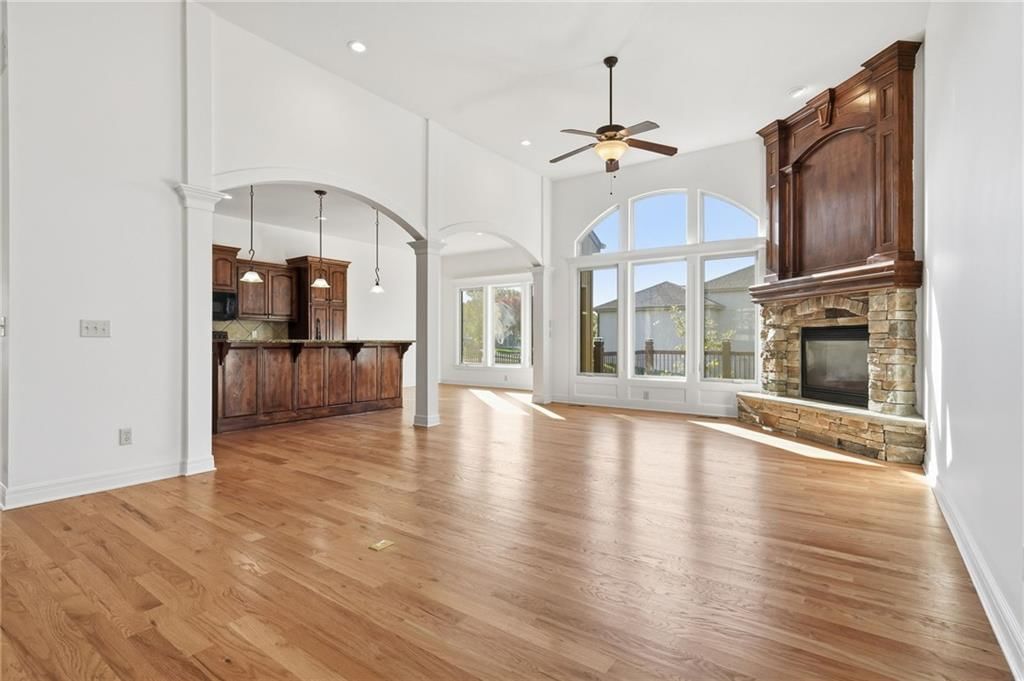
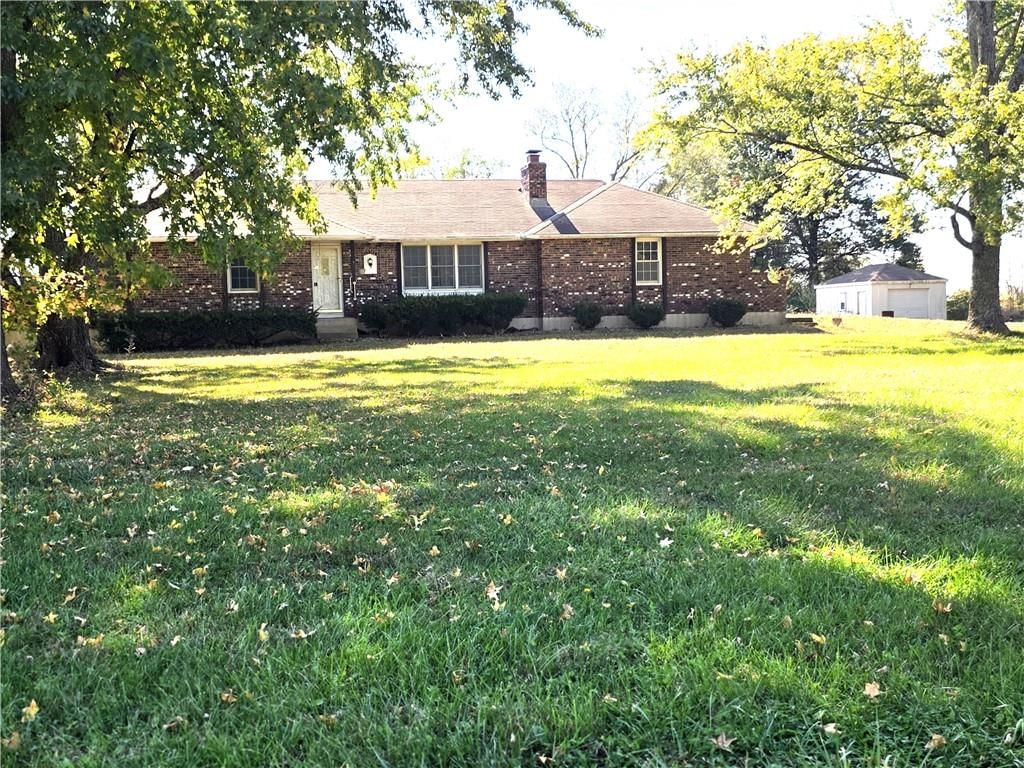
· 30 homes for sale in Cass County30 homes for sale in Cass County · Sorted by Newest Listed
Real estate in Cass County, Missouri
Cass County, MO has about 43,206 households and a median household income of $87,535. Roughly 76% of homes are owner-occupied, the median owner's home value is $292,400, 30% of adults hold a bachelor's degree or higher. The average commute runs 28.0 minutes. About 110,773 people live in Cass County, MO, per the U.S. Census Bureau's American Community Survey 5-year estimate (2020–2024). New construction is still adding supply: 70 building permits were issued in August 2026.
The real question for anyone eyeing Cass County right now is simple: is this a place to get a deal, or a place to get stuck? For buyers, the honest answer is yes to both — if you know which cities to target.
Homes that are priced right are moving. The ones chasing last year's numbers are the ones sitting.
Raymore and Belton anchor the northern end of the county closest to Kansas City, and they draw the largest share of commuter buyers. Both cities have Raymore-Peculiar school district coverage, which consistently ranks among the stronger districts in the metro and is genuinely a selling point, not just marketing language. Belton carries a slightly older housing stock but offers lower price points and quick access to I-49, making it a first-time buyer favorite. Peculiar sits just south and has that small-town identity that buyers either find charming or feel is too removed — worth a visit before committing.
Harrisonville is the county seat and functions as the commercial and civic center of Cass County. Pleasant Hill and Garden City appeal to buyers who want acreage without paying Loch Lloyd prices, and both communities have a genuinely rural character that holds. Lee's Summit technically bleeds into Cass County on its southern edge, and homes listed there carry some of that Lee's Summit brand premium. Cleveland and Archie are the furthest south and are honestly best suited for buyers prioritizing land and quiet over commute convenience.
For sellers: the data is not alarming, but it is honest. A well-prepared, correctly priced home in Raymore or Belton should not take four months to sell. If a listing is sitting, price is almost always the reason. Cass County rewards buyers who do the homework on which city fits their actual life.
Housing market trends in Cass County, Missouri
| Measure | Oct 2026 | Sep 2026 | Oct 2025 |
|---|---|---|---|
| Median sale price | $315,000 | $349,990 | $344,950 |
| Median price per sq ft | $182 | $189 | $188 |
| Median days to contract | 27 | 22 | 27 |
| Sell-to-list ratio | 100% | 100% | 100% |
| Homes sold | 145 | 161 | 140 |
| New listings | 208 | 242 | 165 |
| Went under contract | 139 | 160 | 124 |







Popular home searches in Cass County
| Search | For sale |
|---|---|
| Open houses | For sale10 |
| Luxury homes | For sale52 |
| Just listed homes | For sale30 |
| Price-reduced homes | For sale245 |
| Coming soon homes | For sale22 |
| Homes under contract | For sale229 |
How we compute these
- For sale.
- Homes listed as active right now. A live count, not a monthly average.
Homes by price in Cass County
| Price range | For sale |
|---|---|
| Under $200,000 | For sale127 |
| Under $300,000 | For sale252 |
| Under $400,000 | For sale403 |
| Under $500,000 | For sale485 |
How we compute these
- For sale.
- Homes listed as active right now. A live count, not a monthly average.
Search homes in Cass County
| City | Market (Market type is set by months of supply — how long it would take to sell every home for sale at the current pace. Under ~4 months favors sellers (low inventory, faster sales, homes near or above asking); over ~6 favors buyers (more choice, more negotiating room). 4–6 is balanced.) | Months supply | Median list | Sell-to-list | Days to contract | For sale | Coming soon | Under contract |
|---|---|---|---|---|---|---|---|---|
| Raymore | Balanced | 4.6 mo | Median$380,000 | 96% | 27d | 192 | 5 | 97 |
| Belton | Seller's | 2.7 mo | Median$349,000 | 100% | 22d | 80 | 4 | 39 |
| Pleasant Hill | Balanced | 4.2 mo | Median$249,750 | 96% | 22d | 81 | 5 | 22 |
| Harrisonville | Balanced | 4.7 mo | Median$327,500 | 93% | 29d | 86 | 1 | 14 |
| Peculiar | Balanced ▲ | 4.8 mo | Median$374,990 | 95% | 34d | 79 | 2 | 27 |
How we compute these
- Market.
- Market type is set by months of supply — how long it would take to sell every home for sale at the current pace. Under ~4 months favors sellers (low inventory, faster sales, homes near or above asking); over ~6 favors buyers (more choice, more negotiating room). 4–6 is balanced.
- Months supply.
- How many months it would take to sell every home now for sale at the pace of the last 90 days: homes for sale ÷ (closings in the last 90 days ÷ 3).
- Median list.
- The middle asking price among the homes for sale right now. Half are listed above it, half below.
- Days to contract.
- The middle number of days between a home being listed and going under contract, over the last 90 days of closings. It is not days-to-close, and it is not how long today's listings have been sitting. Newly built homes are excluded, because a build finishing is not a market moving.
- For sale.
- Homes listed as active right now. A live count, not a monthly average.
- Coming soon.
- Homes announced but not yet accepting showings. A live count.
- Under contract.
- Homes with an accepted contract that have not closed yet. A live count.