
Ridgewood, Prairie Village KS Real Estate & Homes For Sale
4 homes in Ridgewood · Sorted by Newest Listed
No homes for sale in Ridgewood right now — showing recently sold & under contract.
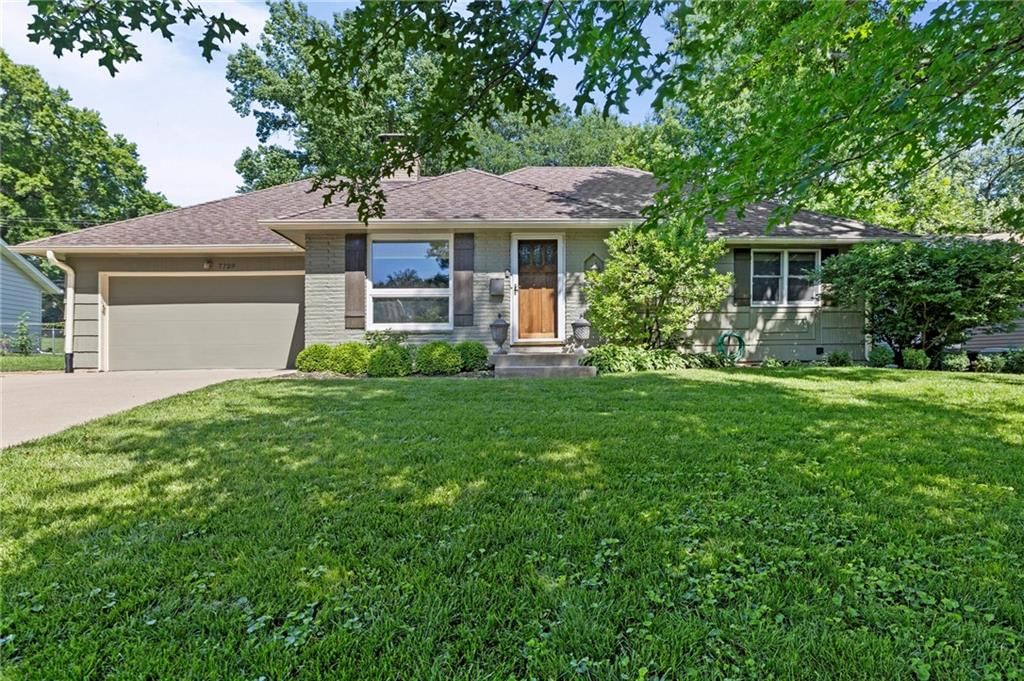
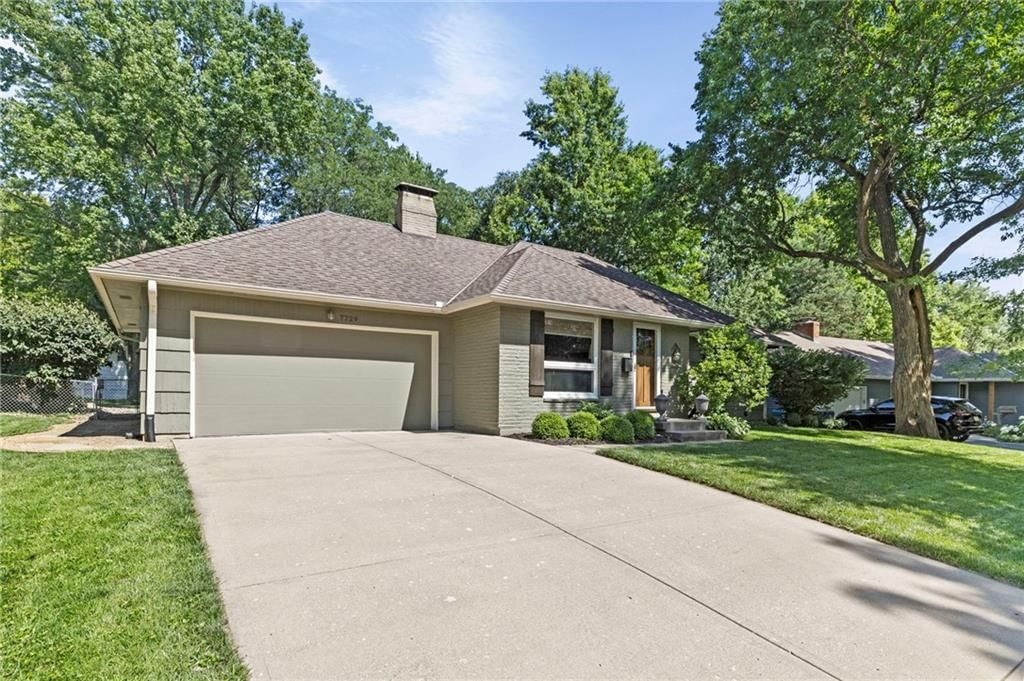
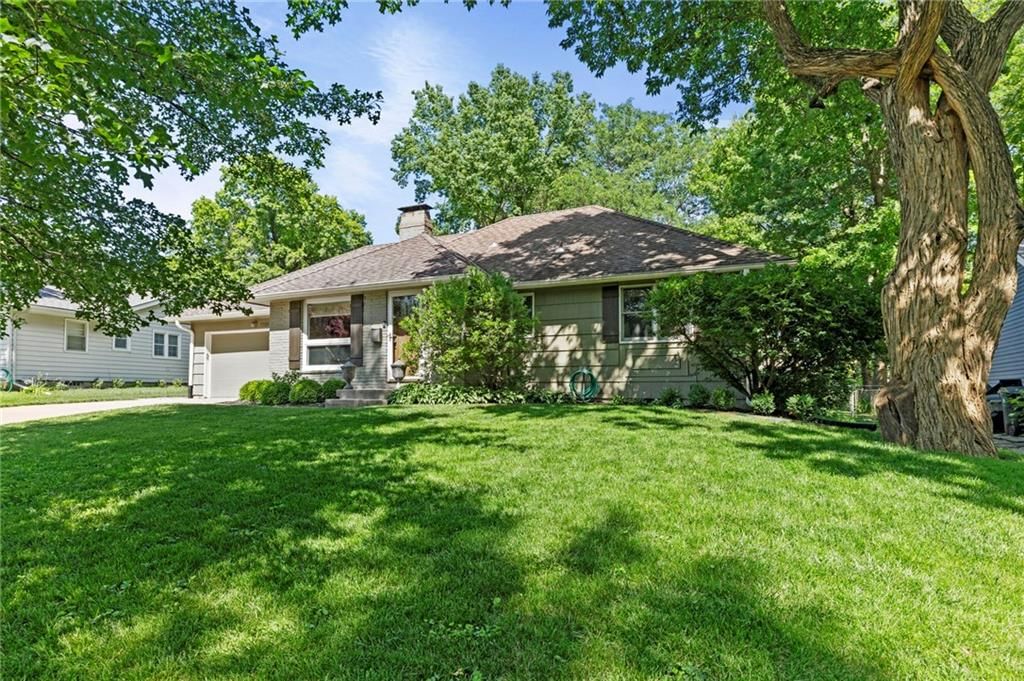
49 photos
Sold 8/28/26
$489,650
2beds|3.5baths|1,876sqft
7729 Windsor Street, Prairie Village, KS
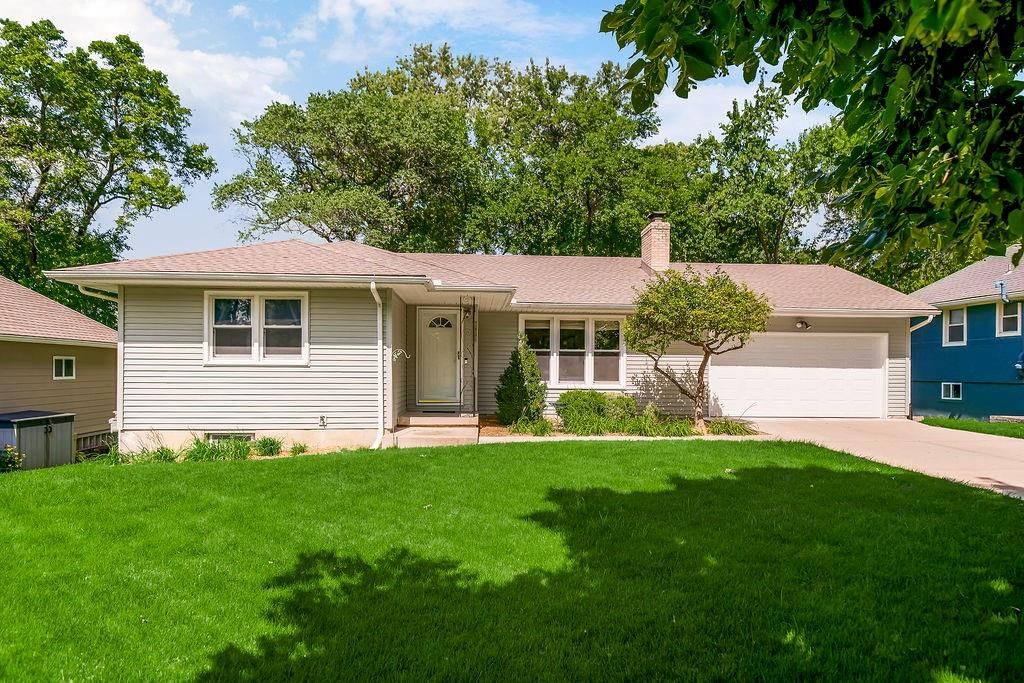
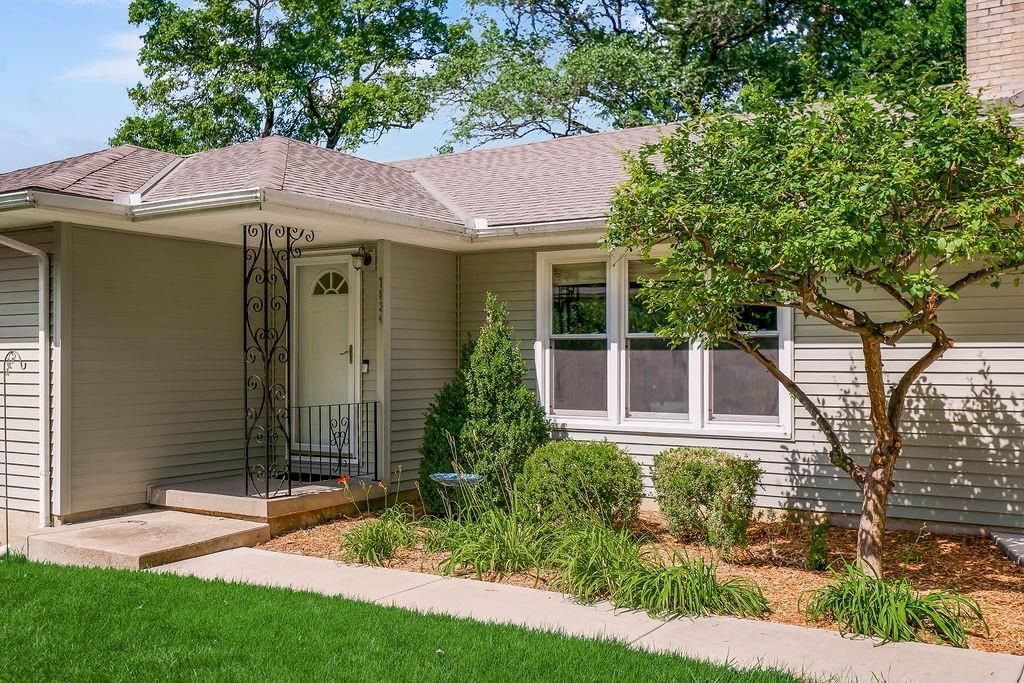
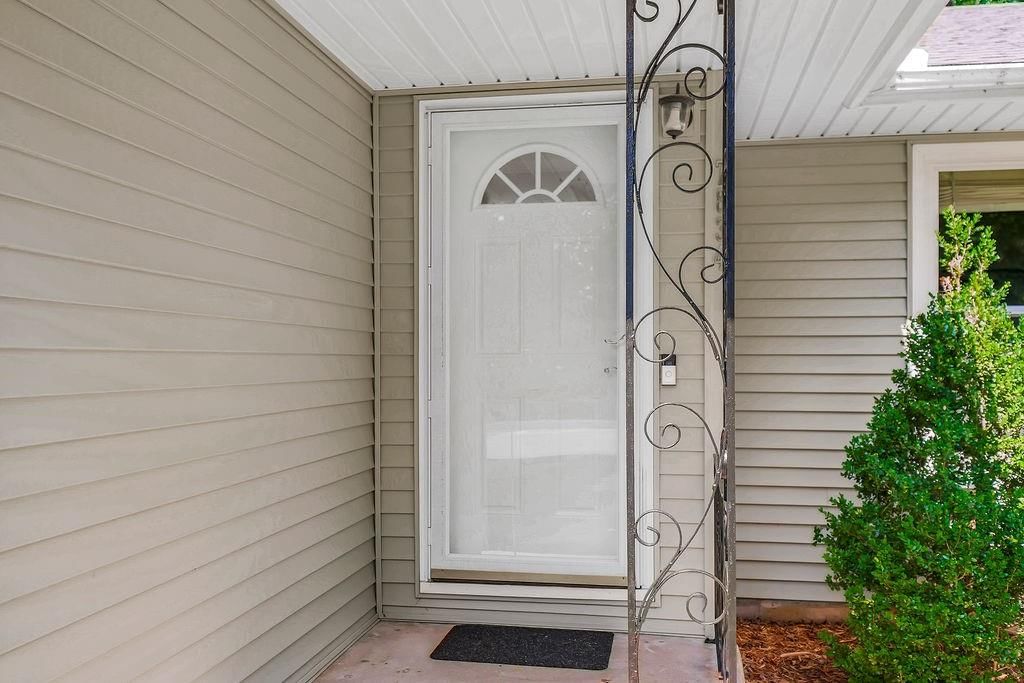
33 photos
Sold 8/25/26
$410,000
3beds|3.5baths|1,864sqft
7834 Windsor Street, Prairie Village, KS
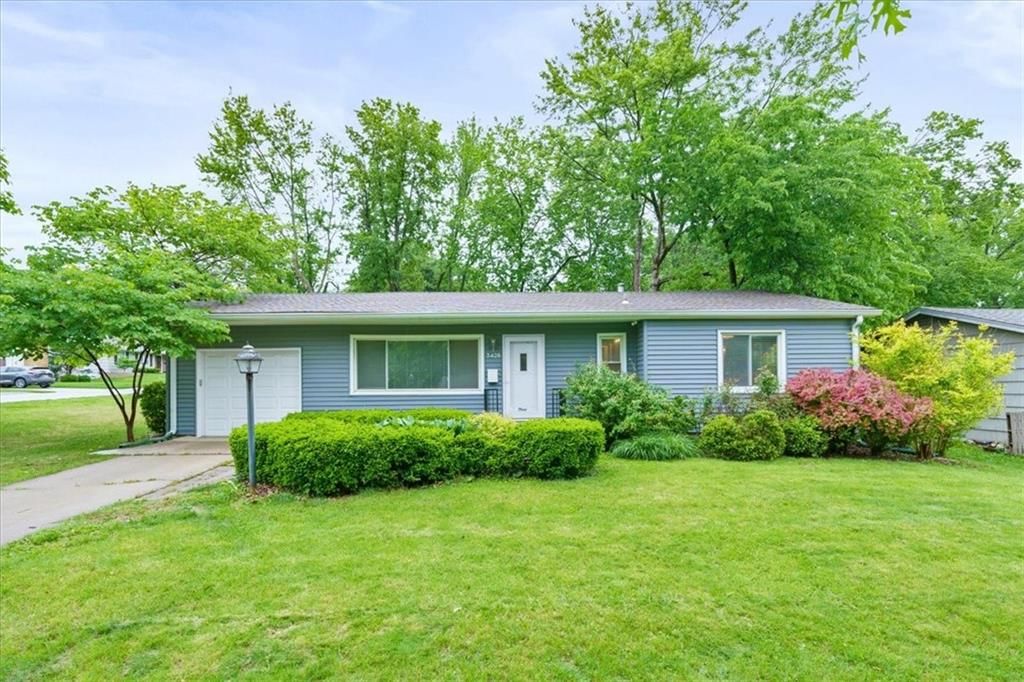
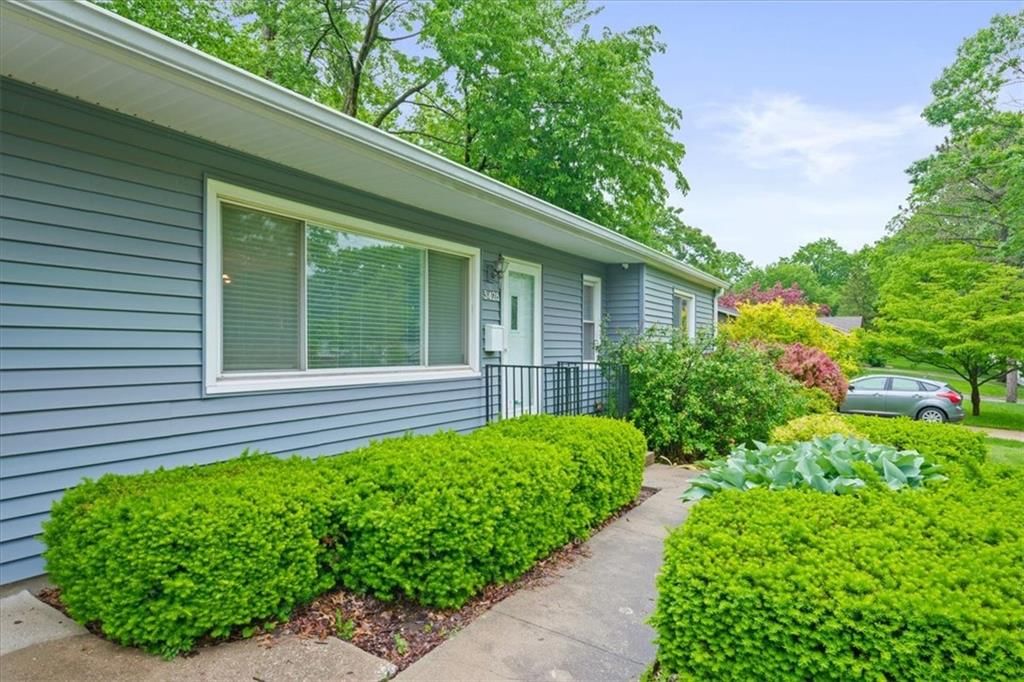
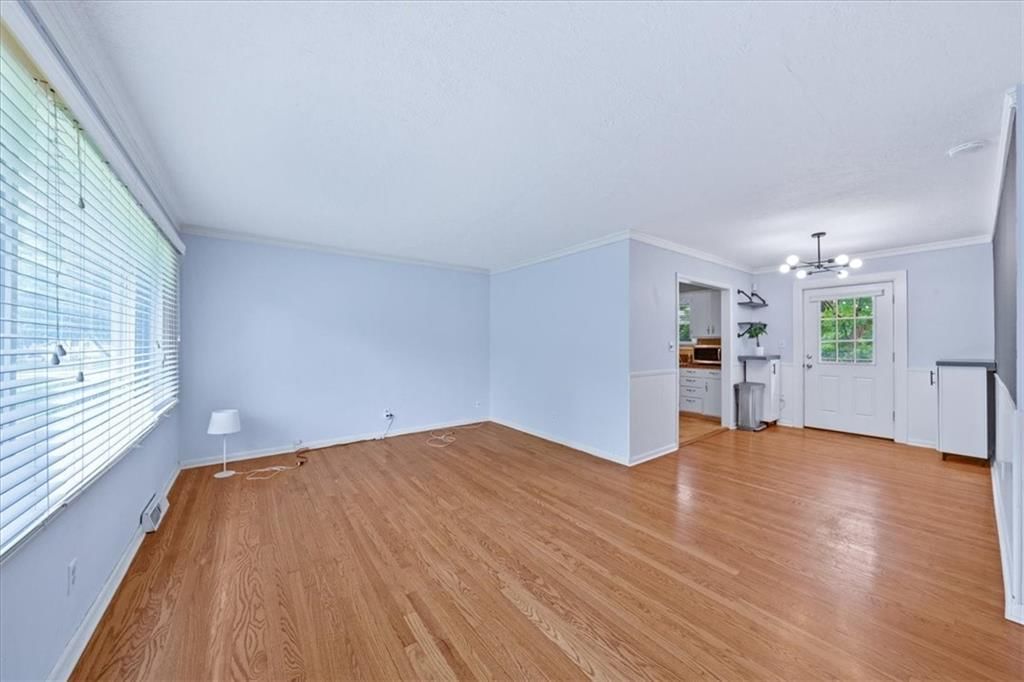
27 photos
Sold 6/5/26
$350,000
3beds|2baths|1,390sqft
3428 W 77th Terrace, Prairie Village, KS
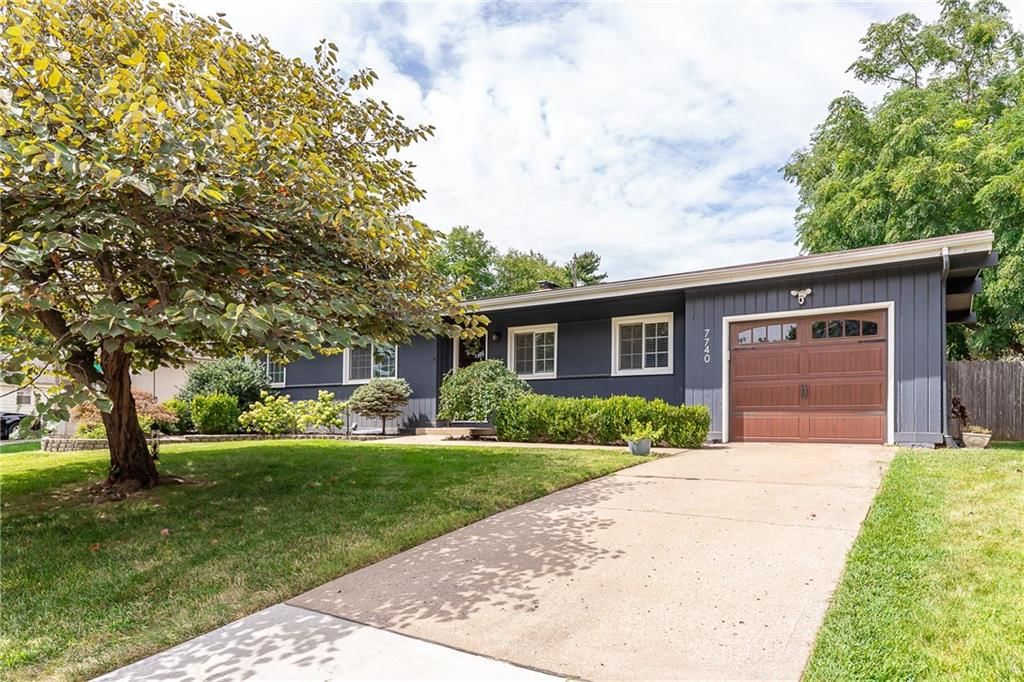
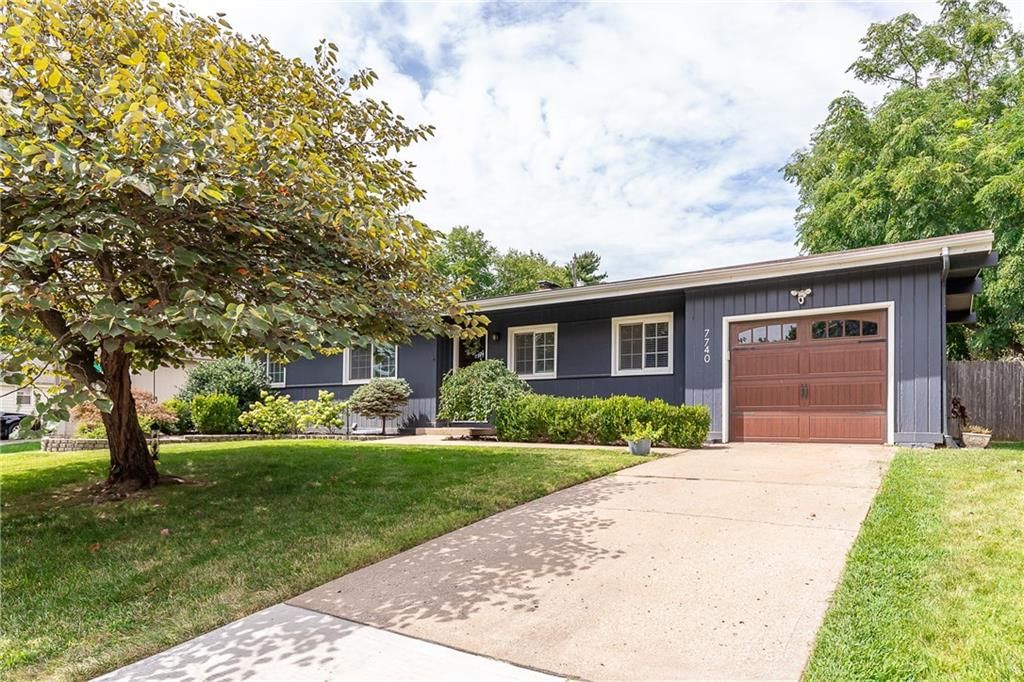

30 photos
Sold 2/2/26
$485,000
3beds|2baths|1,304sqft
7740 Chadwick Street, Prairie Village, KS
Start with the numbers that matter to you
Real estate in Ridgewood, Prairie Village, Kansas
Ridgewood, Prairie Village has 0 homes for sale right now.
Sources — listings, prices and days on market: Heartland MLS as distributed by MLS GRID, as of October 5, 2026 · analysis and home values: HouseLoop calculations
Housing market trends in Ridgewood, Prairie Village, Kansas
As of Oct 5, 2026, Ridgewood, Prairie Village: 0 homes for sale.
| Measure | Oct 2025 | Sep 2025 | Oct 2024 | Change |
|---|---|---|---|---|
| Homes sold | 4 | 5 | 4 | 0% |
| New listings | 5 | 5 | 6 | −16.7% |
| Went under contract | 5 | 5 | 3 | +66.7% |
Real estate FAQs about Ridgewood
How many homes are for sale in Ridgewood, Prairie Village?
How many homes have sold in Ridgewood, Prairie Village in the past year?
② Its neighborhoods — one step out
Nearby neighborhoods to Ridgewood
| Neighborhood | Market (Market type is set by months of supply — how long it would take to sell every home for sale at the current pace. Under ~4 months favors sellers (low inventory, faster sales, homes near or above asking); over ~6 favors buyers (more choice, more negotiating room). 4–6 is balanced.) | Months supply | For sale | Median sale | Sell-to-list | Days to contract | Coming soon | Under contract |
|---|---|---|---|---|---|---|---|---|
| Meadow Lake | Strong Seller's | 0.6 mo | 2 | $318,500 | 103% | 10d | 0 | 2 |
| Prairie Fields | Strong Seller's | 0.6 mo | 2 | $431,500 | 103% | 10d | 2 | 2 |
| Prairie Hills | Seller's | 3.4 mo | 7 | $540,000 | 101% | 9d | 1 | 6 |
| Prairie Ridge | Strong Seller's | 1.3 mo | 2 | $441,000 | 103% | 16d | 0 | 3 |
| Corinth Hills | Strong Seller's | 0.8 mo | 1 | $782,500 | 100% | 8d | 0 | 2 |
| Kenilworth | Seller's ▲ | 3 mo | 3 | $797,500 | 106% | 22d | 0 | 0 |
How we compute these
- Market.
- Market type is set by months of supply — how long it would take to sell every home for sale at the current pace. Under ~4 months favors sellers (low inventory, faster sales, homes near or above asking); over ~6 favors buyers (more choice, more negotiating room). 4–6 is balanced.
- Months supply.
- How many months it would take to sell every home now for sale at the pace of the last 90 days: homes for sale ÷ (closings in the last 90 days ÷ 3).
- For sale.
- Homes listed as active right now. A live count, not a monthly average.
- Days to contract.
- The middle number of days between a home being listed and going under contract, over the last 90 days of closings. It is not days-to-close, and it is not how long today's listings have been sitting. Newly built homes are excluded, because a build finishing is not a market moving.
- Coming soon.
- Homes announced but not yet accepting showings. A live count.
- Under contract.
- Homes with an accepted contract that have not closed yet. A live count.
③ Nearby cities — two steps out
Search homes nearby Ridgewood
| Place | Market (Market type is set by months of supply — how long it would take to sell every home for sale at the current pace. Under ~4 months favors sellers (low inventory, faster sales, homes near or above asking); over ~6 favors buyers (more choice, more negotiating room). 4–6 is balanced.) | Months supply | Median list | Sell-to-list | Days to contract | For sale | Coming soon | Under contract |
|---|---|---|---|---|---|---|---|---|
| Prairie Village | Strong Seller's | 1.7 mo | $864,950 | 101% | 2d | 57 | 15 | 43 |
| Overland Park | Seller's | 2.6 mo | $735,780 | 102% | 5d | 503 | 59 | 319 |
| Olathe | Seller's | 3.2 mo | $629,950 | 102% | 9d | 524 | 33 | 299 |
| Shawnee | Seller's | 2.8 mo | $567,000 | 101% | 5d | 179 | 23 | 102 |
| Lenexa | Seller's | 3.3 mo | $649,975 | 102% | 11d | 196 | 14 | 75 |
| Leawood | Seller's | 3.1 mo | $899,000 | 102% | 4d | 130 | 16 | 65 |
How we compute these
- Market.
- Market type is set by months of supply — how long it would take to sell every home for sale at the current pace. Under ~4 months favors sellers (low inventory, faster sales, homes near or above asking); over ~6 favors buyers (more choice, more negotiating room). 4–6 is balanced.
- Months supply.
- How many months it would take to sell every home now for sale at the pace of the last 90 days: homes for sale ÷ (closings in the last 90 days ÷ 3).
- Median list.
- The middle asking price among the homes for sale right now. Half are listed above it, half below.
- Days to contract.
- The middle number of days between a home being listed and going under contract, over the last 90 days of closings. It is not days-to-close, and it is not how long today's listings have been sitting. Newly built homes are excluded, because a build finishing is not a market moving.
- For sale.
- Homes listed as active right now. A live count, not a monthly average.
- Coming soon.
- Homes announced but not yet accepting showings. A live count.
- Under contract.
- Homes with an accepted contract that have not closed yet. A live count.
④ Zip codes, every city, then wider — widest
Nearby ZIP codes
| Place | Market (Market type is set by months of supply — how long it would take to sell every home for sale at the current pace. Under ~4 months favors sellers (low inventory, faster sales, homes near or above asking); over ~6 favors buyers (more choice, more negotiating room). 4–6 is balanced.) | Months supply | Median list | Sell-to-list | Days to contract | For sale | Coming soon | Under contract |
|---|---|---|---|---|---|---|---|---|
| 66208 | Strong Seller's | 1.7 mo | $1,417,500 | 102% | 3d | 53 | 13 | 40 |
How we compute these
- Market.
- Market type is set by months of supply — how long it would take to sell every home for sale at the current pace. Under ~4 months favors sellers (low inventory, faster sales, homes near or above asking); over ~6 favors buyers (more choice, more negotiating room). 4–6 is balanced.
- Months supply.
- How many months it would take to sell every home now for sale at the pace of the last 90 days: homes for sale ÷ (closings in the last 90 days ÷ 3).
- Median list.
- The middle asking price among the homes for sale right now. Half are listed above it, half below.
- Days to contract.
- The middle number of days between a home being listed and going under contract, over the last 90 days of closings. It is not days-to-close, and it is not how long today's listings have been sitting. Newly built homes are excluded, because a build finishing is not a market moving.
- For sale.
- Homes listed as active right now. A live count, not a monthly average.
- Coming soon.
- Homes announced but not yet accepting showings. A live count.
- Under contract.
- Homes with an accepted contract that have not closed yet. A live count.
Search homes for sale in every city we cover
| City | Market (Market type is set by months of supply — how long it would take to sell every home for sale at the current pace. Under ~4 months favors sellers (low inventory, faster sales, homes near or above asking); over ~6 favors buyers (more choice, more negotiating room). 4–6 is balanced.) | Months supply | Median list | Sell-to-list | Days to contract | For sale | Coming soon | Under contract |
|---|---|---|---|---|---|---|---|---|
| Archie | Seller's | 3.2 mo | $337,450 | 100% | 45d | 15 | 1 | 5 |
| Avondale | Strong Buyer's | 12 mo | Median— | 102% | 7d | 3 | 0 | 0 |
| Basehor | Balanced | 4.5 mo | $479,275 | 100% | 34d | 97 | 3 | 53 |
| Belton | Seller's | 2.5 mo | $364,950 | 101% | 18d | 75 | 7 | 36 |
| Birmingham | Strong Buyer's | 12 mo | Median— | 101% | 8d | 2 | 0 | 0 |
| Blue Springs | Seller's | 2.9 mo | $395,000 | 100% | 14d | 208 | 14 | 120 |
How we compute these
- Market.
- Market type is set by months of supply — how long it would take to sell every home for sale at the current pace. Under ~4 months favors sellers (low inventory, faster sales, homes near or above asking); over ~6 favors buyers (more choice, more negotiating room). 4–6 is balanced.
- Months supply.
- How many months it would take to sell every home now for sale at the pace of the last 90 days: homes for sale ÷ (closings in the last 90 days ÷ 3).
- Median list.
- The middle asking price among the homes for sale right now. Half are listed above it, half below.
- Days to contract.
- The middle number of days between a home being listed and going under contract, over the last 90 days of closings. It is not days-to-close, and it is not how long today's listings have been sitting. Newly built homes are excluded, because a build finishing is not a market moving.
- For sale.
- Homes listed as active right now. A live count, not a monthly average.
- Coming soon.
- Homes announced but not yet accepting showings. A live count.
- Under contract.
- Homes with an accepted contract that have not closed yet. A live count.
Show all 109 cities
- Archie
- Avondale
- Basehor
- Belton
- Birmingham
- Blue Springs
- Bonner Springs
- Buckner
- Bucyrus
- Camden Point
- Claycomo
- Cleveland
- Creighton
- De Soto
- Dearborn
- Drexel
- East Lynne
- Easton
- Edgerton
- Edgerton
- Edwardsville
- Eudora
- Excelsior Springs
- Fairway
- Farley
- Ferrelview
- Fontana
- Freeman
- Gallatin
- Garden City
- Gardner
- Gladstone
- Grain Valley
- Grandview
- Greenwood
- Harrisonville
- Holt
- Houston Lake
- Independence
- Kansas City, MO
- Kansas City
- Kearney
- Kingsville
- Lacygne
- Lake Lotawana
- Lake Quivira
- Lake Tapawingo
- Lake Waukomis
- Lake Winnebago
- Lane
- Lansing
- Lawrence
- Lawson
- Leavenworth
- Leawood
- Lee's Summit
- Lenexa
- Levasy
- Liberty
- Linwood
- Loch Lloyd
- Lone Jack
- Louisburg
- McLouth
- Merriam
- Mission
- Mission Hills
- Mission Woods
- Missouri City
- Napoleon
- North Kansas City
- Northmoor
- Oak Grove
- Oakview
- Olathe
- Osawatomie
- Overland Park
- Paola
- Parker
- Parkville
- Peculiar
- Platte City
- Platte Woods
- Pleasant Hill
- Pleasant Valley
- Prairie Village
- Prathersville
- Raymore
- Raytown
- Riverside
- Roeland Park
- Rushville
- Shawnee
- Sibley
- Smithville
- Spring Hill
- Stilwell
- Strasburg
- Sugar Creek
- Tonganoxie
- Tracy
- Trimble
- Village Of Loch Lloyd
- Village Of Oaks
- Weatherby Lake
- Wellsville
- Weston
- Westwood
- Westwood Hills
Search for homes in popular markets
| Market | For sale |
|---|---|
| Heritage Ranch | 29 |
| Canyon Lakes | 27 |
| Garrett Ranch | 25 |
| Seven Bridges | 25 |
| Falcon Lakes | 23 |
| Boulder Creek | 21 |
How we compute these
- Market.
- Market type is set by months of supply — how long it would take to sell every home for sale at the current pace. Under ~4 months favors sellers (low inventory, faster sales, homes near or above asking); over ~6 favors buyers (more choice, more negotiating room). 4–6 is balanced.
- For sale.
- Homes listed as active right now. A live count, not a monthly average.
Show all 53 popular markets
- Heritage Ranch
- Canyon Lakes
- Garrett Ranch
- Seven Bridges
- Falcon Lakes
- Boulder Creek
- Tomahawk Valley
- Southern Meadows
- Parkside Reserve
- Woodlawn Estates
- Prairie Farms
- Wild Horse
- Ruskin Heights
- Thousand Oaks
- Heritage Farms
- Stonebridge Pointe
- Tapp Farms
- Woodmyre
- WaterCrest Landing
- The View
- Creekmoor - Cunningham
- Marlborough Heights
- Riverstone Valley
- Woodland Hills
- Vista Village
- Chapel Hill
- The Meadows At Greenfield
- Arbor Lake
- Stonebridge Villas
- Ashton Farms
- Dayton Creek
- Prairie Trace
- Providence Pointe
- Bristol Highlands
- Piper Creek Estates
- Tuscany
- The Manhattan Condominiums
- East Village of Leawood
- Prairie Canyon
- Dwyer Farms
- Sundance Ridge- Archers Landing
- Lone Star Prairie
- Riverstone
- Canyon Creek Forest
- Far View Heights
- Wolf Run
- Terrybrook Farms
- Clay Creek Meadows
- Oaks of Edgewood
- Cliffs of Watercrest
- Lakeview Ridge
- Red Hawk Run
- Sanctuary
Or go wider still county, metro and state
| Place | Market (Market type is set by months of supply — how long it would take to sell every home for sale at the current pace. Under ~4 months favors sellers (low inventory, faster sales, homes near or above asking); over ~6 favors buyers (more choice, more negotiating room). 4–6 is balanced.) | Months supply | Median list | Sell-to-list | Days to contract | For sale | Coming soon | Under contract |
|---|---|---|---|---|---|---|---|---|
| Jackson County, MO | Seller's | 3.8 mo | $274,900 | 99% | 19d | 2,920 | 141 | 1,123 |
| Clay County, MO | Seller's | 2.9 mo | $389,900 | 100% | 15d | 879 | 59 | 441 |
| Cass County, MO | Balanced | 4.6 mo | $369,450 | 99% | 27d | 656 | 28 | 250 |
| Platte County, MO | Seller's | 3.8 mo | $499,000 | 101% | 20d | 459 | 23 | 212 |
| Johnson County, KS | Seller's | 2.8 mo | $615,000 | 101% | 7d | 1,909 | 178 | 1,110 |
| Wyandotte County, KS | Seller's | 3.9 mo | $249,000 | 100% | 20d | 512 | 26 | 199 |
| Leavenworth County, KS | Balanced | 5 mo | $295,000 | 99% | 26d | 471 | 19 | 144 |
| Miami County, KS | Balanced | 5.2 mo | $325,000 | 99% | 35d | 249 | 8 | 86 |
| Kansas City metro | — | — | Median— | — | — | 7,632 | — | — |
How we compute these
- Market.
- Market type is set by months of supply — how long it would take to sell every home for sale at the current pace. Under ~4 months favors sellers (low inventory, faster sales, homes near or above asking); over ~6 favors buyers (more choice, more negotiating room). 4–6 is balanced.
- Months supply.
- How many months it would take to sell every home now for sale at the pace of the last 90 days: homes for sale ÷ (closings in the last 90 days ÷ 3).
- Median list.
- The middle asking price among the homes for sale right now. Half are listed above it, half below.
- Days to contract.
- The middle number of days between a home being listed and going under contract, over the last 90 days of closings. It is not days-to-close, and it is not how long today's listings have been sitting. Newly built homes are excluded, because a build finishing is not a market moving.
- For sale.
- Homes listed as active right now. A live count, not a monthly average.
- Coming soon.
- Homes announced but not yet accepting showings. A live count.
- Under contract.
- Homes with an accepted contract that have not closed yet. A live count.