
Homes with a Fireplace for Sale in Lake Lotawana, MO
11 homes fit this search · Sorted by Newest Listed


28 M Street, Lake Lotawana, MO
New · 1d ago


28 TLA Lake Shore Drive, Lake Lotawana, MO


33 T Street, Lake Lotawana, MO
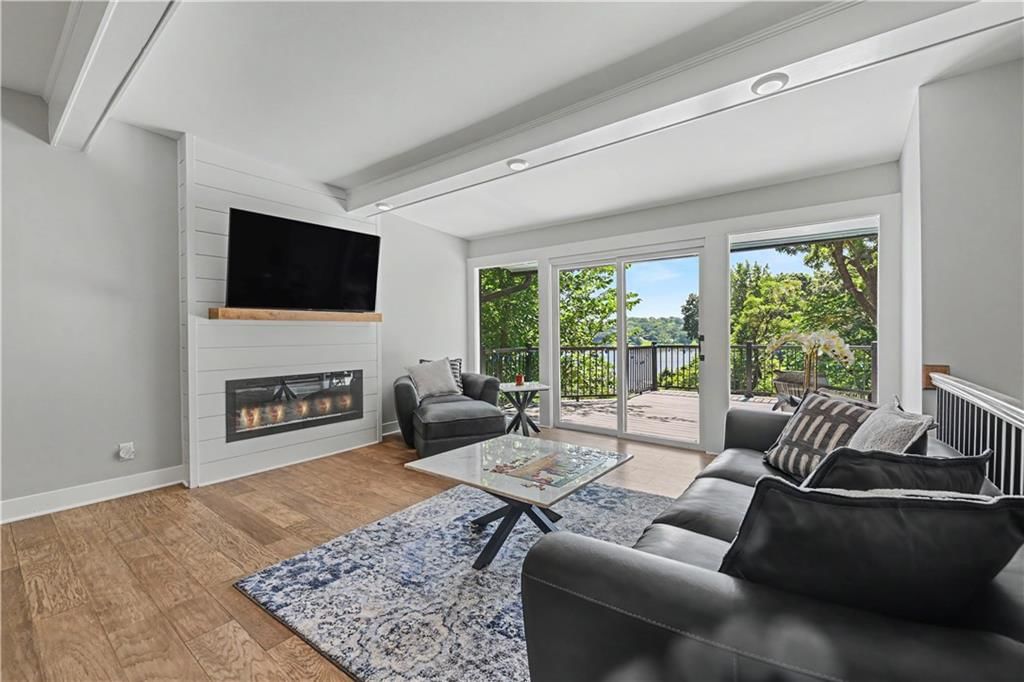


16 M Street, Lake Lotawana, MO
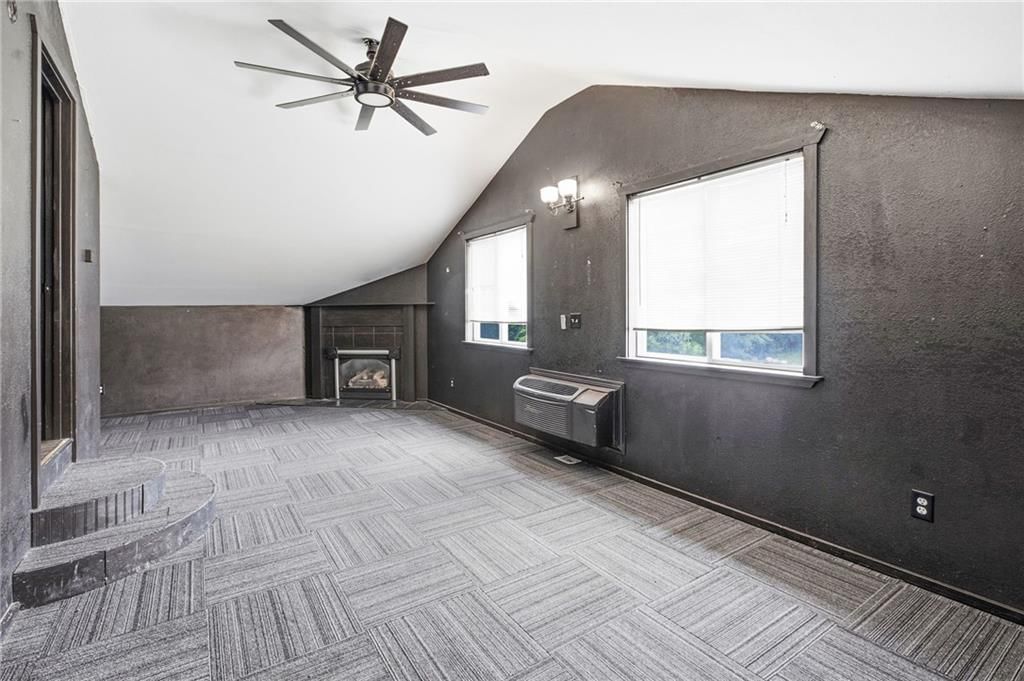
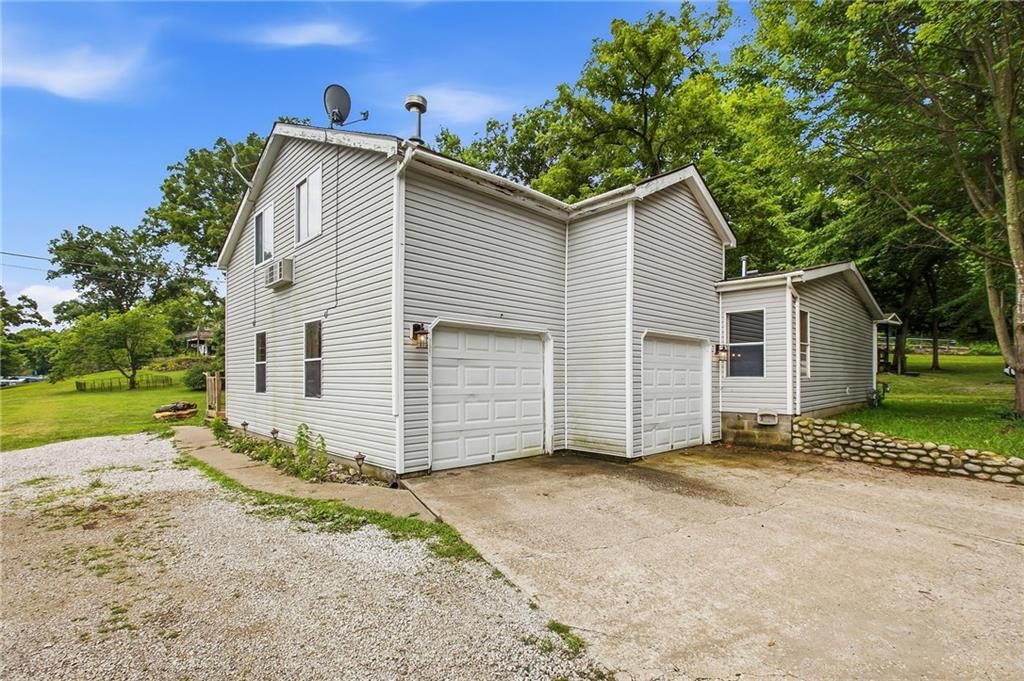

159 & 160 T Street, Lake Lotawana, MO


13 P Lake Shore Drive, Lake Lotawana, MO


61 H Street, Lake Lotawana, MO


31 H Street, Lake Lotawana, MO


95 M Street, Lake Lotawana, MO


70 M Street, Lake Lotawana, MO


57 Y Street, Lake Lotawana, MO
About Homes with Fireplace in Lake Lotawana, MO
Lake Lotawana, MO has 11 homes with fireplace for sale right now, with a median list price of $490,600 as of Sep 19 These homes with fireplace were built between 1935 and 1989, ranging from 957 to 5,012 square feet.
Homes with Fireplace market trends Lake Lotawana, MO
Lake Lotawana, MO: 23 homes for sale · median asking $486,200 · 10 price reductions · a median of 18 days to contract. 6 homes closed in the last 30 days, at a median of $580,000. At the pace of the last 90 days that is 4.31 months of supply.
| Measure | Aug 2026 |
|---|---|
| Median sale price | $675,000 |
| Median price per sq ft | $281 |
| Homes sold | 5 |
| New listings | 4 |
| Went under contract | 5 |
Homes with Fireplace FAQs Lake Lotawana, MO
How many homes with fireplace are for sale in Lake Lotawana, MO?
What is the median list price of homes with fireplace in Lake Lotawana, MO?
Schools serving Lake Lotawana
| School | Median list | |
|---|---|---|
| School districts | ||
| Lee's Summit School District | $490,600 | |
| High schools | ||
| Lee's Summit North | Median— | |
| Lee's Summit | Median— | |
| Middle schools | ||
| Bernard Campbell | Median— | |
| East Trails | Median— | |
| Elementary schools | ||
| Woodland | Median— | |
| Mason Lee's Summit | Median— | |
| Mason | Median— | |
How we compute these
- Median list.
- The middle asking price among the homes for sale right now. Half are listed above it, half below.
- For sale.
- Homes listed as active right now. A live count, not a monthly average.
Recently went under contract in Lake Lotawana, MO
| Address | List price |
|---|---|
| 20 H Street | List price$2,500,000 |
| 13904 Crawford Creek Circle | List price$162,100 |
| 13908 Crawford Creek Circle | List price$215,000 |
| 161 T Street | List price$225,000 |
How we compute these
- Under contract.
- Homes with an accepted contract that have not closed yet. A live count.
- Days to contract.
- The middle number of days between a home being listed and going under contract, over the last 90 days of closings. It is not days-to-close, and it is not how long today's listings have been sitting. Newly built homes are excluded, because a build finishing is not a market moving.
Popular home searches in Lake Lotawana
| Search | For sale |
|---|---|
| Luxury homes | For sale3 |
| Just listed homes | For sale1 |
| Price-reduced homes | 10 |
| Coming soon homes | For sale1 |
| Homes under contract | For sale4 |
How we compute these
- For sale.
- Homes listed as active right now. A live count, not a monthly average.
Homes by price in Lake Lotawana
| Price range | For sale |
|---|---|
| Under $200,000 | For sale3 |
| Under $300,000 | For sale7 |
| Under $400,000 | For sale7 |
| Under $500,000 | 14 |
| Under $600,000 | 17 |
| Under $750,000 | 19 |
| Under $1,000,000 | 21 |
| $400,000 – $500,000 | For sale7 |
| $500,000 – $600,000 | For sale3 |
| $600,000 – $750,000 | For sale2 |
| $1M and above | For sale3 |
How we compute these
- For sale.
- Homes listed as active right now. A live count, not a monthly average.
Homes by feature in Lake Lotawana
| Feature | For sale |
|---|---|
| HOA under $300/mo | 22 |
| Two or more stories | For sale18 |
| 2+ full bathrooms | For sale15 |
| Homes with public water | For sale15 |
| Homes with 2+ full bathrooms | For sale15 |
| Homes with a public sewer | For sale14 |
| Homes with a fireplace | 11 |
| Homes on large lots | 11 |
| HOA under $150/mo | 10 |
| Homes with acreage | For sale10 |
| Homes with a septic tank | For sale10 |
| Homes with acreage | 10 |
How we compute these
- For sale.
- Homes listed as active right now. A live count, not a monthly average.
Search by property type in Lake Lotawana
| Property type | Median sale |
|---|---|
| Single Family | Median— |
| Lots / Land | $190,000 |
How we compute these
- Market.
- Market type is set by months of supply — how long it would take to sell every home for sale at the current pace. Under ~4 months favors sellers (low inventory, faster sales, homes near or above asking); over ~6 favors buyers (more choice, more negotiating room). 4–6 is balanced.
- Months supply.
- How many months it would take to sell every home now for sale at the pace of the last 90 days: homes for sale ÷ (closings in the last 90 days ÷ 3).
- For sale.
- Homes listed as active right now. A live count, not a monthly average.
- Days to contract.
- The middle number of days between a home being listed and going under contract, over the last 90 days of closings. It is not days-to-close, and it is not how long today's listings have been sitting. Newly built homes are excluded, because a build finishing is not a market moving.
- Coming soon.
- Homes announced but not yet accepting showings. A live count.
- Under contract.
- Homes with an accepted contract that have not closed yet. A live count.
Nearby neighborhoods to Lake Lotawana
| Neighborhood | Median sale |
|---|---|
| Woodlawn Estates | $390,000 |
| Lone Summit Estates | $230,000 |
How we compute these
- Market.
- Market type is set by months of supply — how long it would take to sell every home for sale at the current pace. Under ~4 months favors sellers (low inventory, faster sales, homes near or above asking); over ~6 favors buyers (more choice, more negotiating room). 4–6 is balanced.
- Months supply.
- How many months it would take to sell every home now for sale at the pace of the last 90 days: homes for sale ÷ (closings in the last 90 days ÷ 3).
- For sale.
- Homes listed as active right now. A live count, not a monthly average.
- Days to contract.
- The middle number of days between a home being listed and going under contract, over the last 90 days of closings. It is not days-to-close, and it is not how long today's listings have been sitting. Newly built homes are excluded, because a build finishing is not a market moving.
- Coming soon.
- Homes announced but not yet accepting showings. A live count.
- Under contract.
- Homes with an accepted contract that have not closed yet. A live count.
Search homes nearby Lake Lotawana
| Place | Median list |
|---|---|
| Lake Lotawana | $490,600 |
| Kansas City | $267,500 |
| Independence | $224,950 |
| Lee's Summit | $530,000 |
| Blue Springs | $396,864 |
| Raytown | $237,500 |
How we compute these
- Market.
- Market type is set by months of supply — how long it would take to sell every home for sale at the current pace. Under ~4 months favors sellers (low inventory, faster sales, homes near or above asking); over ~6 favors buyers (more choice, more negotiating room). 4–6 is balanced.
- Months supply.
- How many months it would take to sell every home now for sale at the pace of the last 90 days: homes for sale ÷ (closings in the last 90 days ÷ 3).
- Median list.
- The middle asking price among the homes for sale right now. Half are listed above it, half below.
- Days to contract.
- The middle number of days between a home being listed and going under contract, over the last 90 days of closings. It is not days-to-close, and it is not how long today's listings have been sitting. Newly built homes are excluded, because a build finishing is not a market moving.
- For sale.
- Homes listed as active right now. A live count, not a monthly average.
- Coming soon.
- Homes announced but not yet accepting showings. A live count.
- Under contract.
- Homes with an accepted contract that have not closed yet. A live count.
Search homes for sale in every city we cover
How we compute these
- Market.
- Market type is set by months of supply — how long it would take to sell every home for sale at the current pace. Under ~4 months favors sellers (low inventory, faster sales, homes near or above asking); over ~6 favors buyers (more choice, more negotiating room). 4–6 is balanced.
- Months supply.
- How many months it would take to sell every home now for sale at the pace of the last 90 days: homes for sale ÷ (closings in the last 90 days ÷ 3).
- Median list.
- The middle asking price among the homes for sale right now. Half are listed above it, half below.
- Days to contract.
- The middle number of days between a home being listed and going under contract, over the last 90 days of closings. It is not days-to-close, and it is not how long today's listings have been sitting. Newly built homes are excluded, because a build finishing is not a market moving.
- For sale.
- Homes listed as active right now. A live count, not a monthly average.
- Coming soon.
- Homes announced but not yet accepting showings. A live count.
- Under contract.
- Homes with an accepted contract that have not closed yet. A live count.
Search for homes in popular markets
| Market | For sale |
|---|---|
| Heritage Ranch | 29 |
| Canyon Lakes | 25 |
| Ruskin Heights | 25 |
| Garrett Ranch | 24 |
| Seven Bridges | 23 |
| Tomahawk Valley | 23 |
How we compute these
- Market.
- Market type is set by months of supply — how long it would take to sell every home for sale at the current pace. Under ~4 months favors sellers (low inventory, faster sales, homes near or above asking); over ~6 favors buyers (more choice, more negotiating room). 4–6 is balanced.
- For sale.
- Homes listed as active right now. A live count, not a monthly average.
Or go wider still county, metro and state
How we compute these
- Market.
- Market type is set by months of supply — how long it would take to sell every home for sale at the current pace. Under ~4 months favors sellers (low inventory, faster sales, homes near or above asking); over ~6 favors buyers (more choice, more negotiating room). 4–6 is balanced.
- Months supply.
- How many months it would take to sell every home now for sale at the pace of the last 90 days: homes for sale ÷ (closings in the last 90 days ÷ 3).
- Median list.
- The middle asking price among the homes for sale right now. Half are listed above it, half below.
- Days to contract.
- The middle number of days between a home being listed and going under contract, over the last 90 days of closings. It is not days-to-close, and it is not how long today's listings have been sitting. Newly built homes are excluded, because a build finishing is not a market moving.
- For sale.
- Homes listed as active right now. A live count, not a monthly average.
- Coming soon.
- Homes announced but not yet accepting showings. A live count.
- Under contract.
- Homes with an accepted contract that have not closed yet. A live count.