
Price-Reduced Homes in Liberty, MO
24 homes for sale in Liberty · Sorted by Newest Listed


20207 NE 102nd Street, Liberty, MO


1788 Homestead Drive, Liberty, MO


519 Holt Drive, Liberty, MO


1058 Maple Woods Terrace, Liberty, MO


423 N Missouri Street, Liberty, MO


15 Brooks Court, Liberty, MO
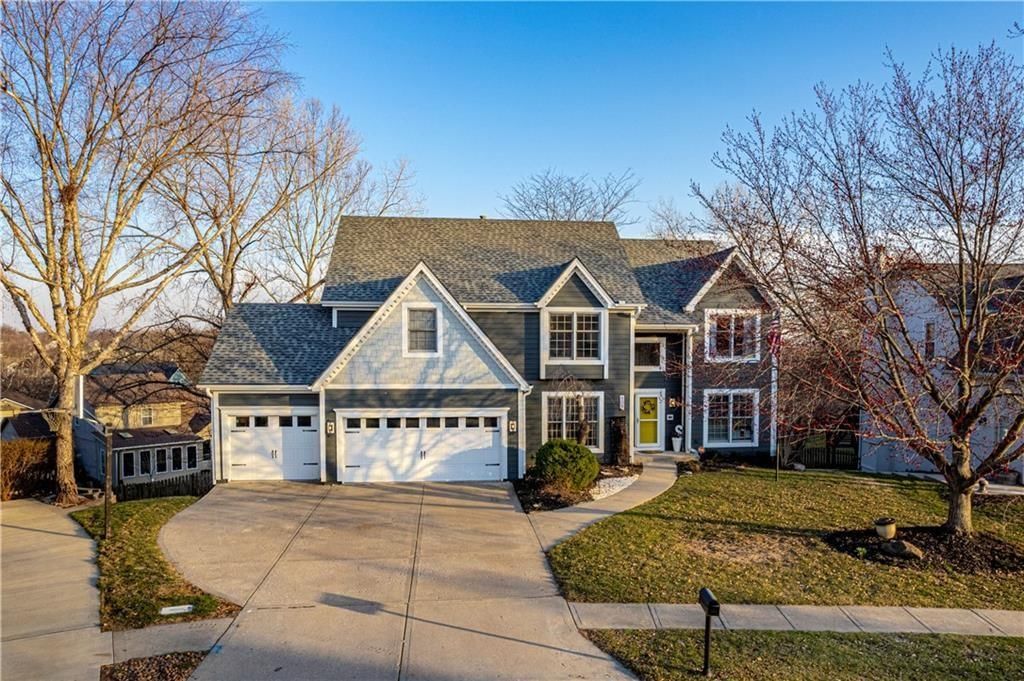


809 Cottonwood Place, Liberty, MO


1437 Coventry Lane, Liberty, MO


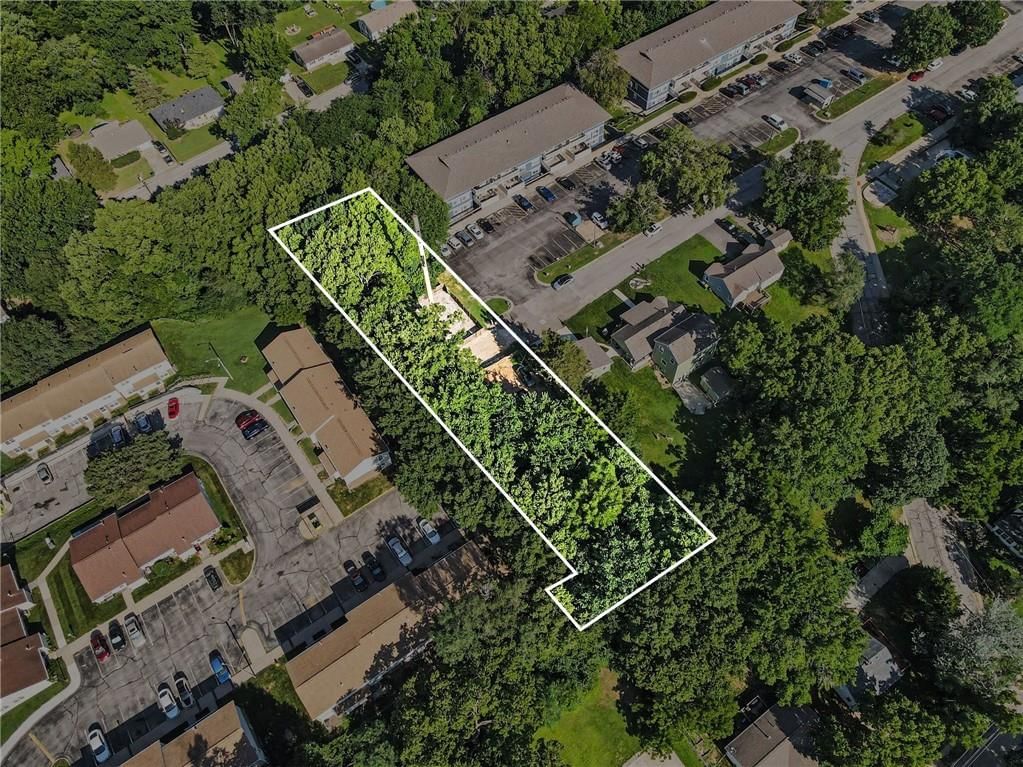
401 N Skyline Drive, Liberty, MO


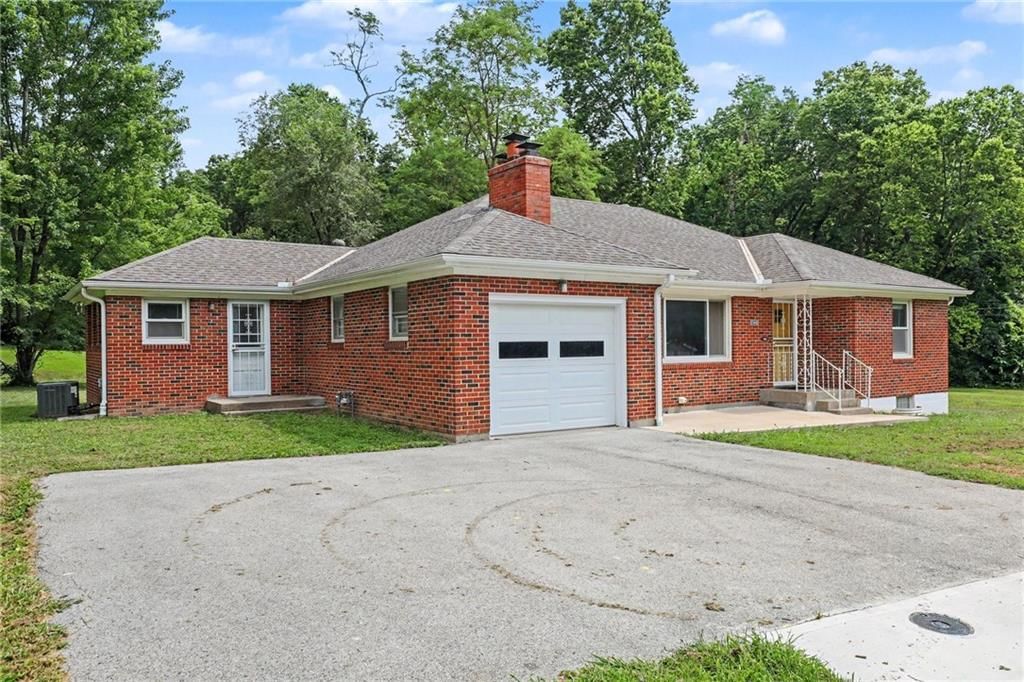
506 W Mississippi Street, Liberty, MO
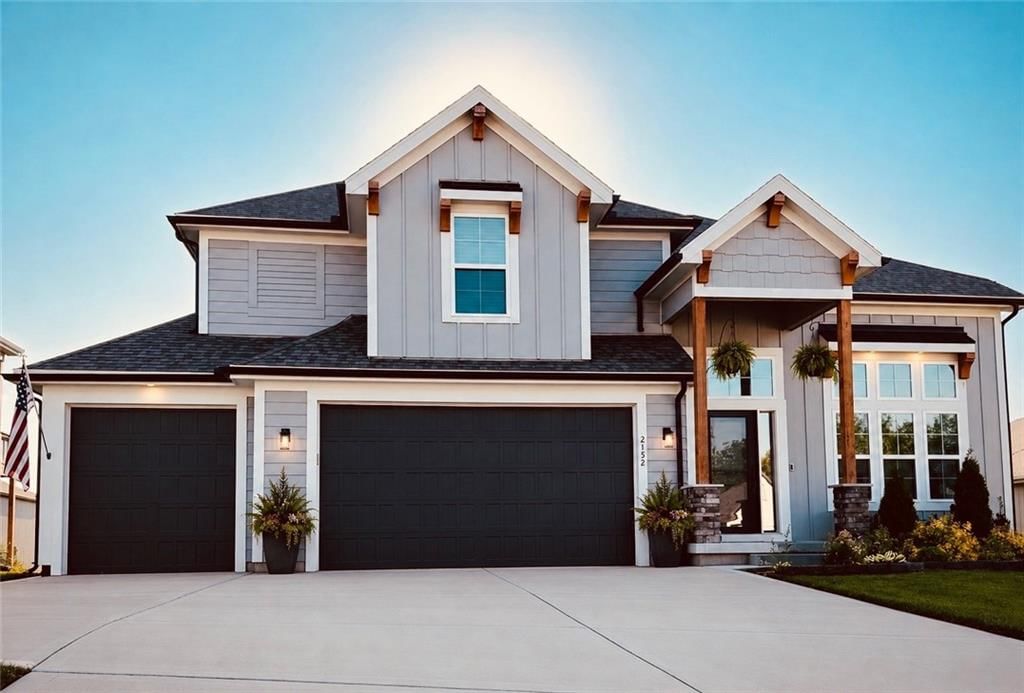


2152 Hay Market Court, Liberty, MO

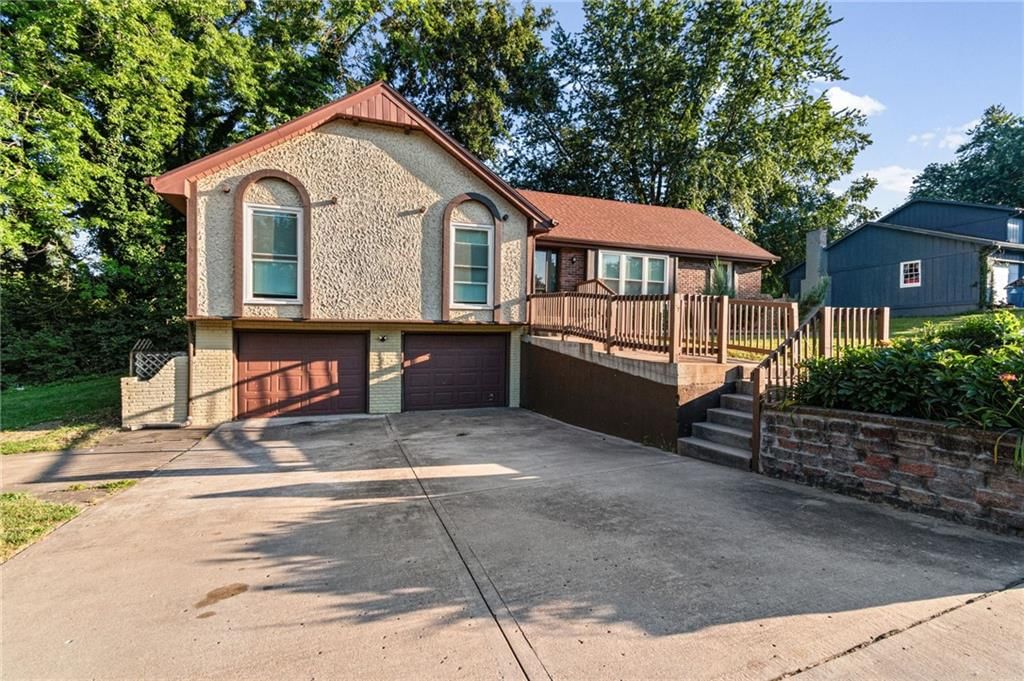
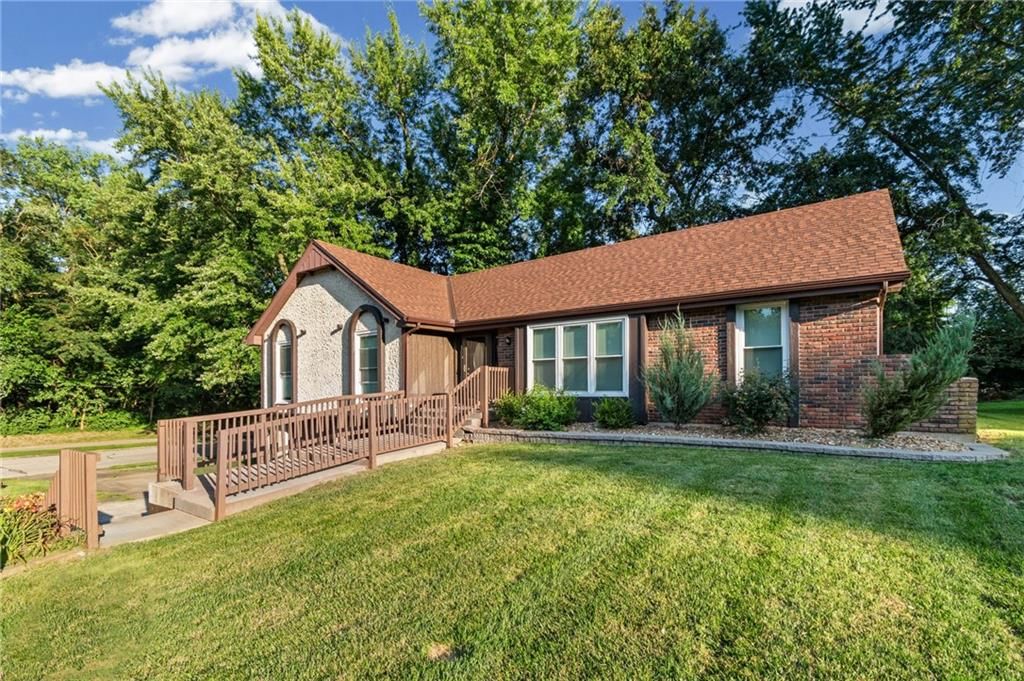
403 Kingsley Avenue, Liberty, MO
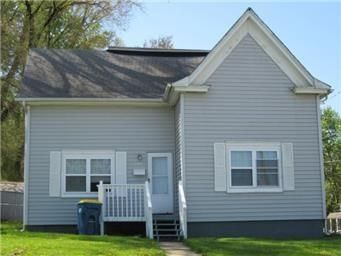

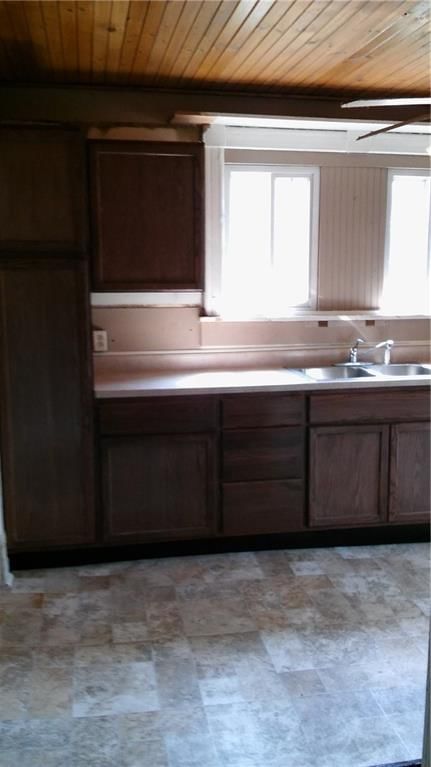
203 E Pine Street, Liberty, MO
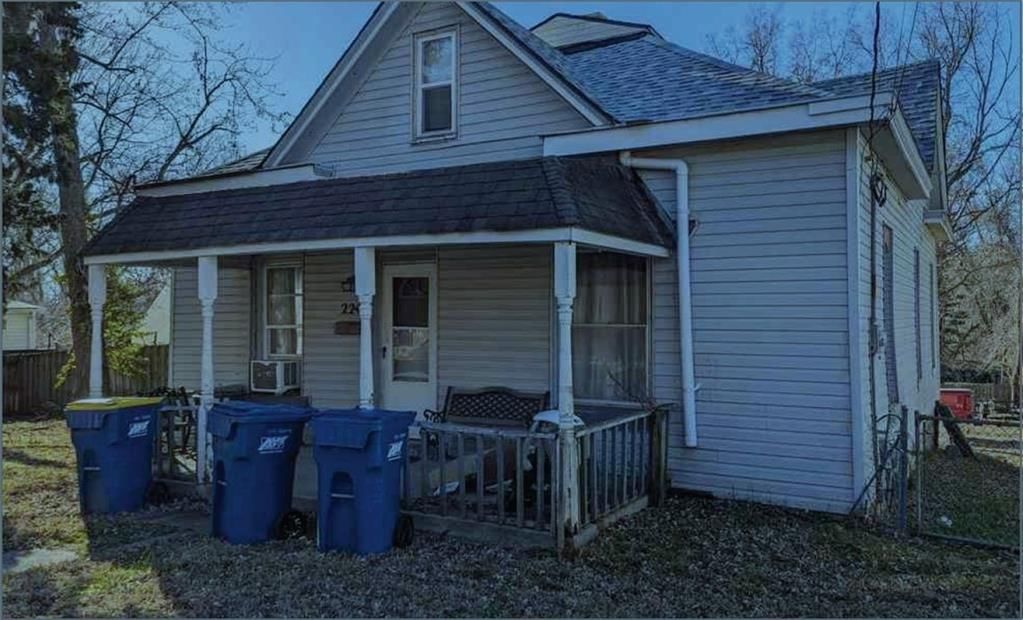


224 S Missouri Street, Liberty, MO


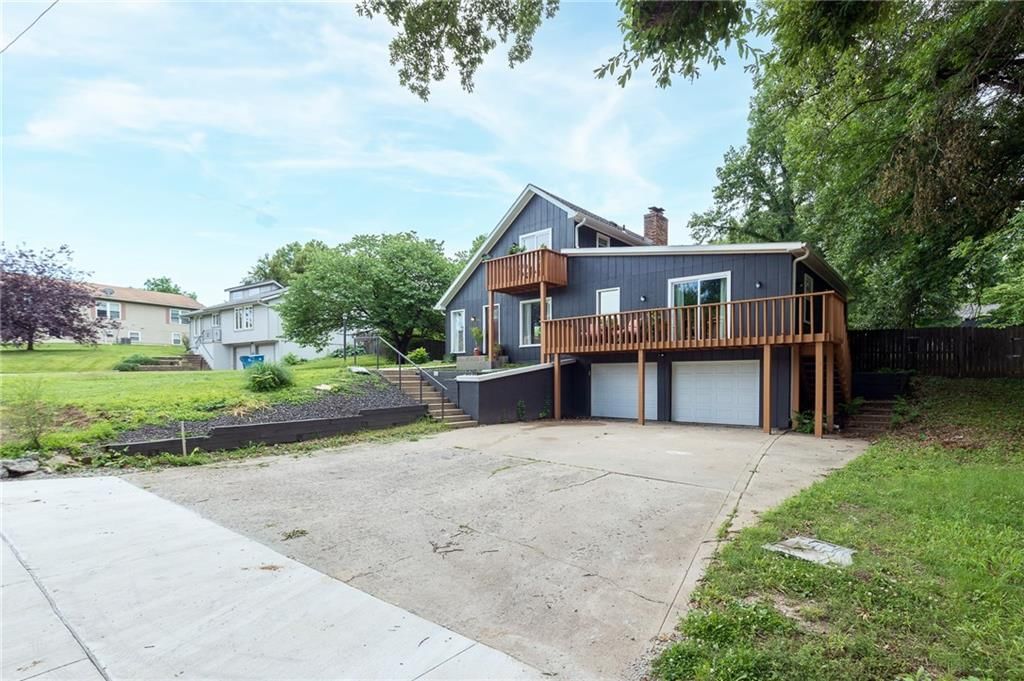
124 Johnson Road, Liberty, MO
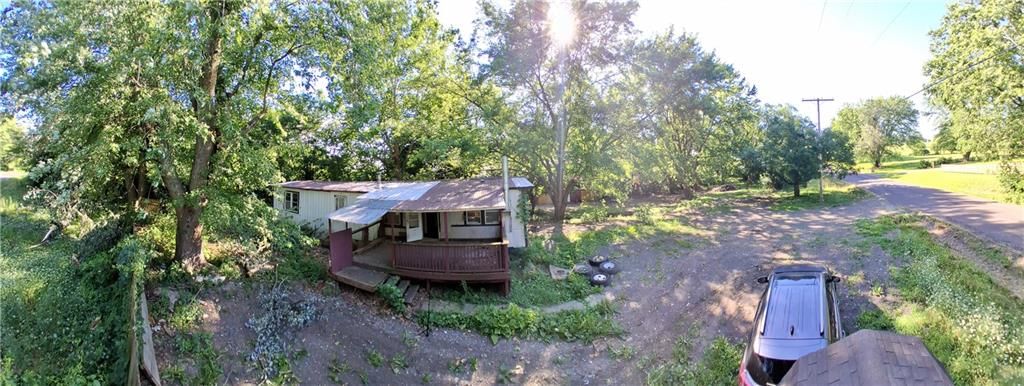


9404 Stillhouse Road, Liberty, MO


760 Spring Circle, Liberty, MO


504 Skyview Lane, Liberty, MO


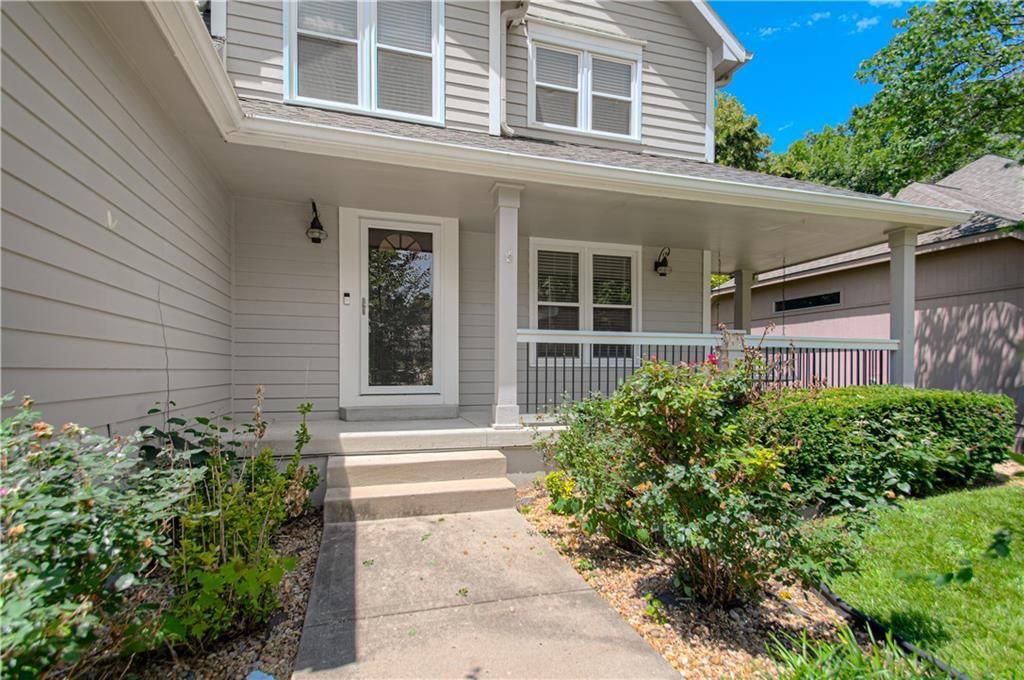
1500 Amesbury Avenue, Liberty, MO


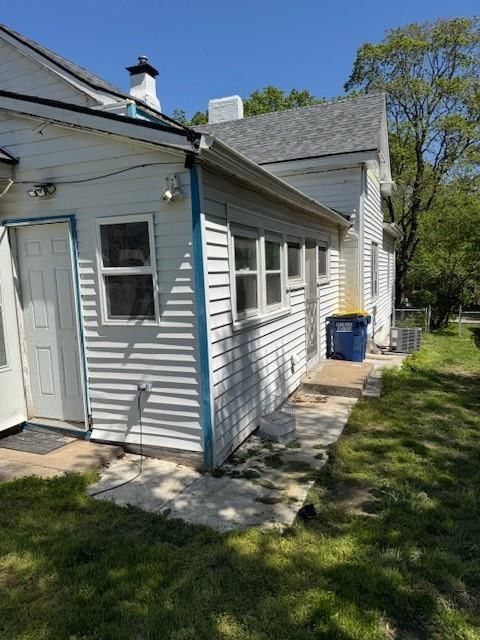
138 S Terrace Avenue, Liberty, MO


225 Groom Street, Liberty, MO


9901 Stockdale Road, Liberty, MO


9619 Stockdale Road, Liberty, MO
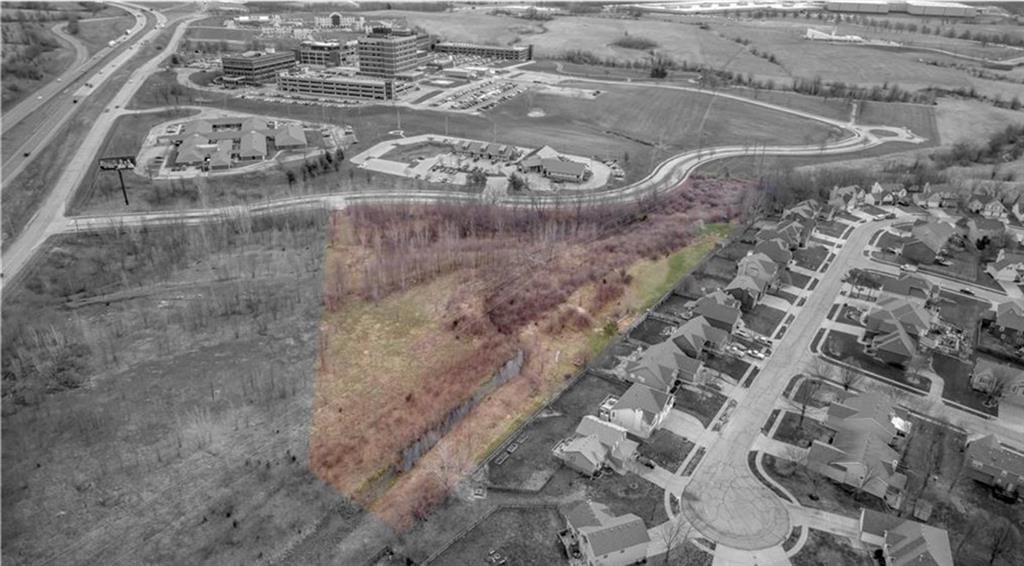
Rush Creek Parkway, Liberty, MO
About Price-Reduced Homes inLiberty, MO
Liberty, MO has 24 price-reduced homes for sale right now, with a median list price of $399,900 as of Sep 12 These price-reduced homes were built between 1875 and 2026, ranging from 984 to 5,256 square feet.
Price-Reduced Homes market trendsLiberty, MO
Liberty, MO: 87 homes for sale · 19 new in the last 7 days · median asking $424,950 · 24 price reductions · a median of 18 days to contract. 31 homes closed in the last 30 days, at a median of $385,000. At the pace of the last 90 days that is 1.91 months of supply.
| Measure | Aug 2026 |
|---|---|
| Median sale price | $375,000 |
| Median price per sq ft | $182 |
| Median days to contract | 14 |
| Sell-to-list ratio | 100% |
| Homes sold | 39 |
| New listings | 46 |
| Went under contract | 32 |
Price-Reduced Homes FAQsLiberty, MO
How many price-reduced homes are for sale in Liberty, MO?
What is the median list price of price-reduced homes in Liberty, MO?
Schoolsserving Liberty
| School | Median list | |
|---|---|---|
| School districts | ||
| Liberty School District | $424,950 | |
| Kearney School District | Median— | |
| High schools | ||
| Liberty | $442,450 | |
| Liberty North | Median— | |
| Middle schools | ||
| Liberty | $459,900 | |
| Heritage | Median— | |
| Discovery | Median— | |
| Elementary schools | ||
| Alexander Doniphan | Median— | |
| Manor Hill | Median— | |
| Schumacher | Median— | |
| Franklin | Median— | |
| Ridgeview | Median— | |
How we compute these
- Median list.
- The middle asking price among the homes for sale right now. Half are listed above it, half below.
- For sale.
- Homes listed as active right now. A live count, not a monthly average.
Newly listedin Liberty, MO
| Address | Price |
|---|---|
| 1435 Buckeye Court | Price$459,900 |
| 601 Taylor Drive | Price$424,950 |
| 14016 N Zachary Drive | Price$275,000 |
| 1500 Ridgeview Road | Price$535,000 |
| 14014 Zachery Drive | Price$749,000 |
| 1974 Harvest Road | Price$470,000 |
| 1970 Harvest Road | Price$505,000 |
| 2044 Brooke Street | Price$535,000 |
| 2208 Deerfield Terrace | Price$535,000 |
| 519 N Morse Avenue | Price$200,000 |
| 1117 Meadowlark Lane | Price$365,000 |
| 836-38 Walker Court | Price$489,000 |
Recently went under contractin Liberty, MO
| Address | List price |
|---|---|
| 225 Winner Street | List price$142,500 |
| 1849 Arbor Trail | List price$600,000 |
| 1366 Wildbriar Drive | List price$435,000 |
| 724 Plum Rose Drive | List price$430,000 |
| 110 Groom Street | List price$275,000 |
| 16807 NE 116th Street | List price$512,000 |
| 604 Hawthorne Place | List price$375,000 |
| 708 Melrose Street | List price$280,000 |
| 1524 Oxford Court | List price$345,000 |
| 1972 Longview Drive | List price$548,900 |
| 2153 Black Walnut Drive | List price$499,950 |
| 1018 Jasmine Drive | List price$454,000 |
How we compute these
- Under contract.
- Homes with an accepted contract that have not closed yet. A live count.
- Days to contract.
- The middle number of days between a home being listed and going under contract, over the last 90 days of closings. It is not days-to-close, and it is not how long today's listings have been sitting. Newly built homes are excluded, because a build finishing is not a market moving.
Popular home searchesin Liberty
| Search | For sale |
|---|---|
| Open houses | 6 |
| Luxury homes | For sale2 |
| Just listed homes | 19 |
| Price-reduced homes | 24 |
| Coming soon homes | 8 |
| Homes under contract | 40 |
How we compute these
- For sale.
- Homes listed as active right now. A live count, not a monthly average.
Homes by pricein Liberty
| Price range | For sale |
|---|---|
| Under $200,000 | 12 |
| Under $300,000 | 26 |
| Under $400,000 | 44 |
| Under $500,000 | 63 |
| Under $600,000 | 79 |
| Under $750,000 | 85 |
| Under $1,000,000 | 90 |
| $300,000 – $400,000 | 18 |
| $400,000 – $500,000 | 19 |
| $500,000 – $600,000 | 16 |
| $600,000 – $750,000 | For sale6 |
| $1M and above | For sale2 |
How we compute these
- For sale.
- Homes listed as active right now. A live count, not a monthly average.
Homes by featurein Liberty
| Feature | For sale |
|---|---|
| Homes with public water | 81 |
| Homes with a public sewer | 77 |
| Homes with 2+ full bathrooms | 73 |
| Homes with an attached garage | 62 |
| Two or more stories | For sale61 |
| 2-car garage homes | 61 |
| Homes with 3+ full bathrooms | 54 |
| Homes with no HOA | 53 |
| Homes with carpet floors | 53 |
| Homes with a fireplace | 51 |
| Basement: Finished | For sale50 |
| Homes with a finished basement | 50 |
How we compute these
- For sale.
- Homes listed as active right now. A live count, not a monthly average.
Search by property typein Liberty
| Property type | Median sale |
|---|---|
| Single Family | $376,000 |
| Villa | Median— |
| Half Duplex | Median— |
| Duplex | Median— |
| Lots / Land | $220,000 |
How we compute these
- Market.
- Market type is set by months of supply — how long it would take to sell every home for sale at the current pace. Under ~4 months favors sellers (low inventory, faster sales, homes near or above asking); over ~6 favors buyers (more choice, more negotiating room). 4–6 is balanced.
- Months supply.
- How many months it would take to sell every home now for sale at the pace of the last 90 days: homes for sale ÷ (closings in the last 90 days ÷ 3).
- For sale.
- Homes listed as active right now. A live count, not a monthly average.
- Days to contract.
- The middle number of days between a home being listed and going under contract, over the last 90 days of closings. It is not days-to-close, and it is not how long today's listings have been sitting. Newly built homes are excluded, because a build finishing is not a market moving.
- Coming soon.
- Homes announced but not yet accepting showings. A live count.
- Under contract.
- Homes with an accepted contract that have not closed yet. A live count.
Nearby neighborhoodsto Liberty
| Neighborhood | Median sale |
|---|---|
| Clay Meadows | $437,250 |
| Claywoods | $399,500 |
| Ella's Crossing | $405,800 |
| Canterbury | $361,001 |
| Liberty Manor | $252,500 |
| Homestead Hills | $540,000 |
How we compute these
- Market.
- Market type is set by months of supply — how long it would take to sell every home for sale at the current pace. Under ~4 months favors sellers (low inventory, faster sales, homes near or above asking); over ~6 favors buyers (more choice, more negotiating room). 4–6 is balanced.
- Months supply.
- How many months it would take to sell every home now for sale at the pace of the last 90 days: homes for sale ÷ (closings in the last 90 days ÷ 3).
- For sale.
- Homes listed as active right now. A live count, not a monthly average.
- Days to contract.
- The middle number of days between a home being listed and going under contract, over the last 90 days of closings. It is not days-to-close, and it is not how long today's listings have been sitting. Newly built homes are excluded, because a build finishing is not a market moving.
- Coming soon.
- Homes announced but not yet accepting showings. A live count.
- Under contract.
- Homes with an accepted contract that have not closed yet. A live count.
Search homesnearby Liberty
| Place | Median list |
|---|---|
| Liberty | $399,900 |
| Kansas City | $265,000 |
| Gladstone | $221,950 |
| Kearney | $530,000 |
| Smithville | $324,900 |
| Excelsior Springs | $322,000 |
How we compute these
- Market.
- Market type is set by months of supply — how long it would take to sell every home for sale at the current pace. Under ~4 months favors sellers (low inventory, faster sales, homes near or above asking); over ~6 favors buyers (more choice, more negotiating room). 4–6 is balanced.
- Months supply.
- How many months it would take to sell every home now for sale at the pace of the last 90 days: homes for sale ÷ (closings in the last 90 days ÷ 3).
- Median list.
- The middle asking price among the homes for sale right now. Half are listed above it, half below.
- Days to contract.
- The middle number of days between a home being listed and going under contract, over the last 90 days of closings. It is not days-to-close, and it is not how long today's listings have been sitting. Newly built homes are excluded, because a build finishing is not a market moving.
- For sale.
- Homes listed as active right now. A live count, not a monthly average.
- Coming soon.
- Homes announced but not yet accepting showings. A live count.
- Under contract.
- Homes with an accepted contract that have not closed yet. A live count.
NearbyZIP codes
| Place | Median list |
|---|---|
| 64068 | $399,450 |
How we compute these
- Market.
- Market type is set by months of supply — how long it would take to sell every home for sale at the current pace. Under ~4 months favors sellers (low inventory, faster sales, homes near or above asking); over ~6 favors buyers (more choice, more negotiating room). 4–6 is balanced.
- Months supply.
- How many months it would take to sell every home now for sale at the pace of the last 90 days: homes for sale ÷ (closings in the last 90 days ÷ 3).
- Median list.
- The middle asking price among the homes for sale right now. Half are listed above it, half below.
- Days to contract.
- The middle number of days between a home being listed and going under contract, over the last 90 days of closings. It is not days-to-close, and it is not how long today's listings have been sitting. Newly built homes are excluded, because a build finishing is not a market moving.
- For sale.
- Homes listed as active right now. A live count, not a monthly average.
- Coming soon.
- Homes announced but not yet accepting showings. A live count.
- Under contract.
- Homes with an accepted contract that have not closed yet. A live count.
Search homes for salein every city we cover
How we compute these
- Market.
- Market type is set by months of supply — how long it would take to sell every home for sale at the current pace. Under ~4 months favors sellers (low inventory, faster sales, homes near or above asking); over ~6 favors buyers (more choice, more negotiating room). 4–6 is balanced.
- Months supply.
- How many months it would take to sell every home now for sale at the pace of the last 90 days: homes for sale ÷ (closings in the last 90 days ÷ 3).
- Median list.
- The middle asking price among the homes for sale right now. Half are listed above it, half below.
- Days to contract.
- The middle number of days between a home being listed and going under contract, over the last 90 days of closings. It is not days-to-close, and it is not how long today's listings have been sitting. Newly built homes are excluded, because a build finishing is not a market moving.
- For sale.
- Homes listed as active right now. A live count, not a monthly average.
- Coming soon.
- Homes announced but not yet accepting showings. A live count.
- Under contract.
- Homes with an accepted contract that have not closed yet. A live count.
Search for homesin popular markets
| Market | For sale |
|---|---|
| Heritage Ranch | 30 |
| Canyon Lakes | 25 |
| Seven Bridges | 24 |
| Garrett Ranch | 24 |
| Ruskin Heights | 24 |
| Tomahawk Valley | 23 |
How we compute these
- Market.
- Market type is set by months of supply — how long it would take to sell every home for sale at the current pace. Under ~4 months favors sellers (low inventory, faster sales, homes near or above asking); over ~6 favors buyers (more choice, more negotiating room). 4–6 is balanced.
- For sale.
- Homes listed as active right now. A live count, not a monthly average.
Or go wider stillcounty, metro and state
How we compute these
- Market.
- Market type is set by months of supply — how long it would take to sell every home for sale at the current pace. Under ~4 months favors sellers (low inventory, faster sales, homes near or above asking); over ~6 favors buyers (more choice, more negotiating room). 4–6 is balanced.
- Months supply.
- How many months it would take to sell every home now for sale at the pace of the last 90 days: homes for sale ÷ (closings in the last 90 days ÷ 3).
- Median list.
- The middle asking price among the homes for sale right now. Half are listed above it, half below.
- Days to contract.
- The middle number of days between a home being listed and going under contract, over the last 90 days of closings. It is not days-to-close, and it is not how long today's listings have been sitting. Newly built homes are excluded, because a build finishing is not a market moving.
- For sale.
- Homes listed as active right now. A live count, not a monthly average.
- Coming soon.
- Homes announced but not yet accepting showings. A live count.
- Under contract.
- Homes with an accepted contract that have not closed yet. A live count.