
Homes with a Detached Garage for Sale in Clay County, MO
30 homes for sale in Clay County · Sorted by Newest Listed


519 N Morse Avenue, Liberty, MO
New · 1d ago


4216 NE 44TH Street, Kansas City, MO
New · 1d ago


7510 Oak Street, Pleasant Valley, MO
New · 4d ago

410 Wildwood Street, Excelsior Springs, MO
New · 6d ago

800 Marilynn Avenue, Liberty, MO
New · 7d ago


1300 Kearney Road, Excelsior Springs, MO


8204 NE 53rd Street, Kansas City, MO


1207 Saint Paul Avenue, Excelsior Springs, MO


500 S Commercial Avenue, Smithville, MO


225 Winner Street, Liberty, MO


2401 NE 58th Terrace, Kansas City, MO


3006 NE Parvin Road, Kansas City, MO


20009 Clinton County Line Road, Holt, MO


17504 State Route 33 Highway, Holt, MO
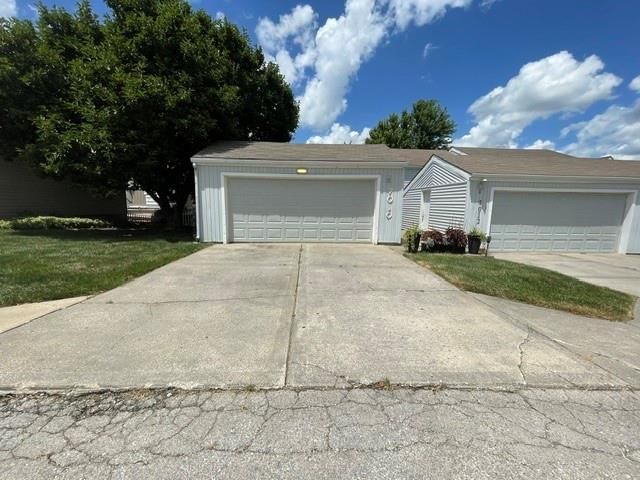

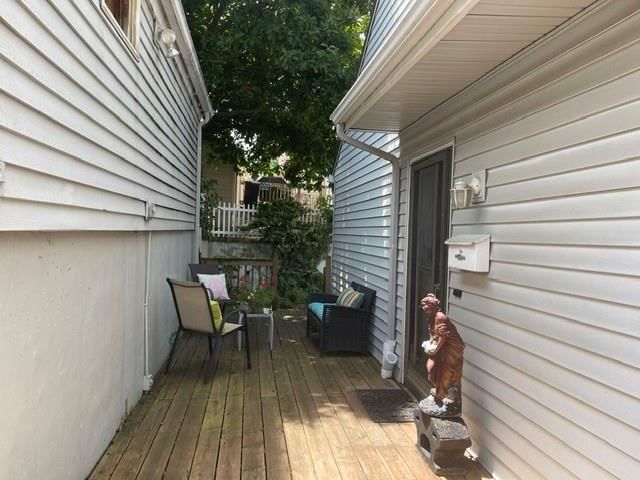
7010 N Askew Avenue, Gladstone, MO
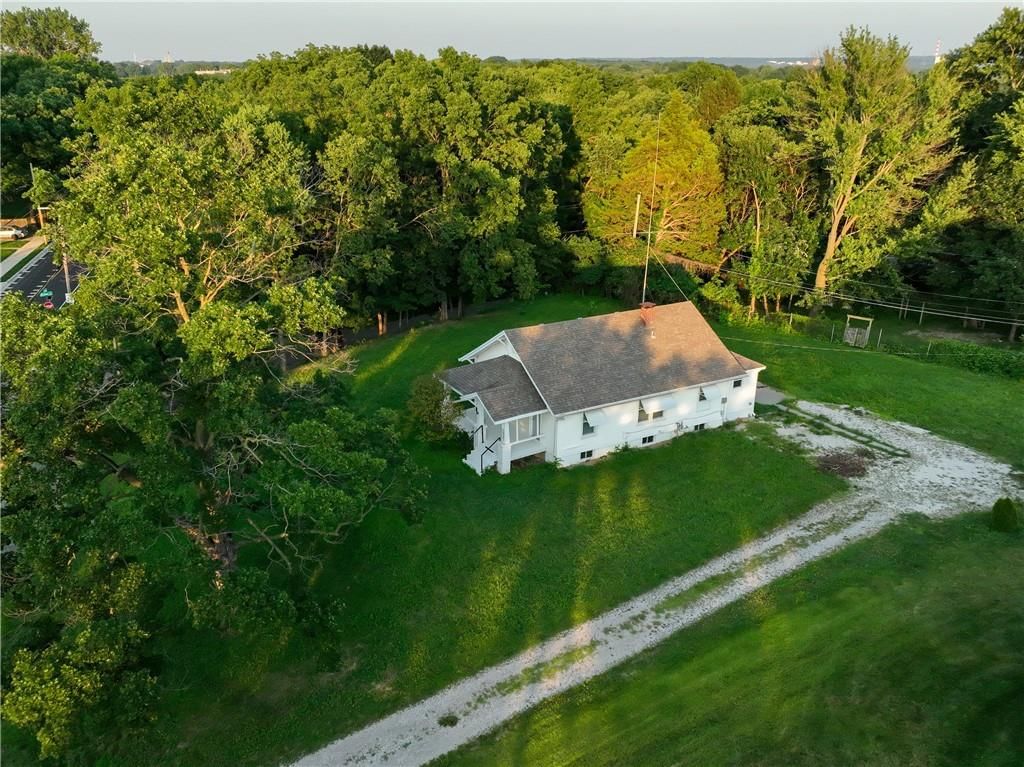
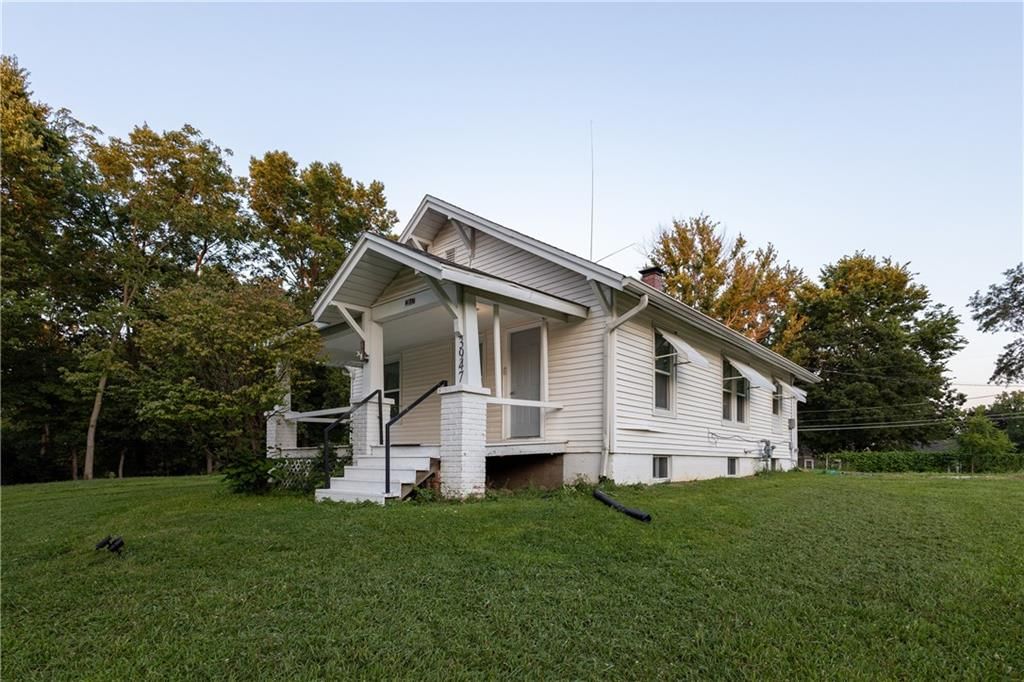

3947 N Bales Avenue, Kansas City, MO


724 Hazel Street, Excelsior Springs, MO


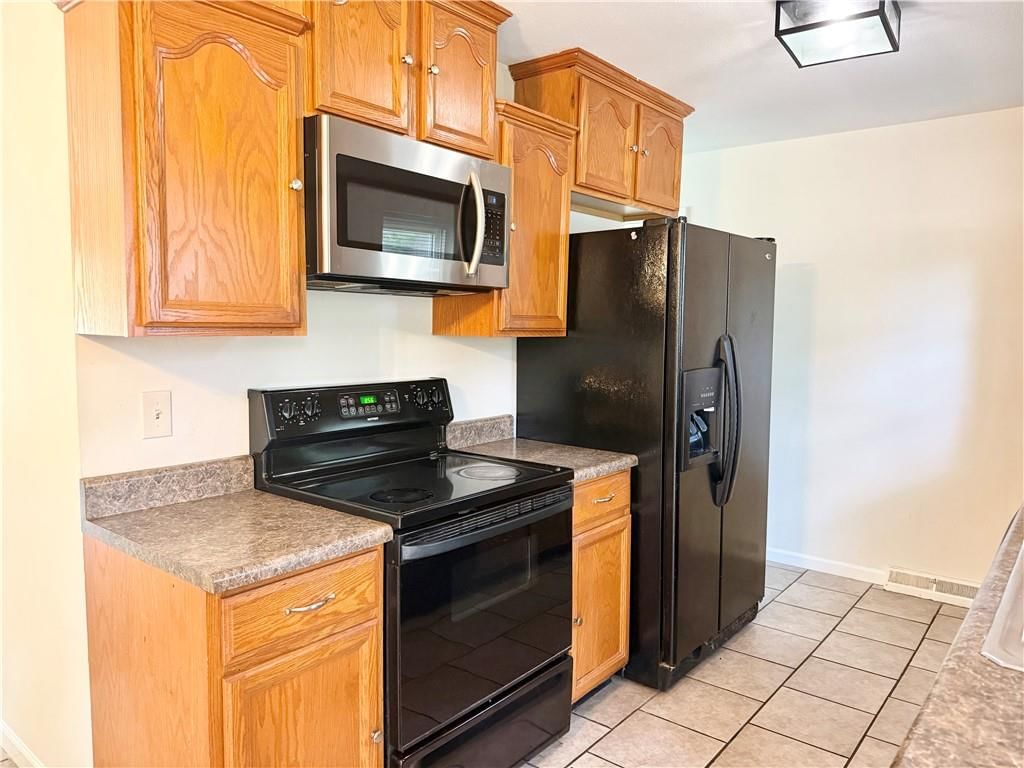
4621 NE 42nd Street, Kansas City, MO
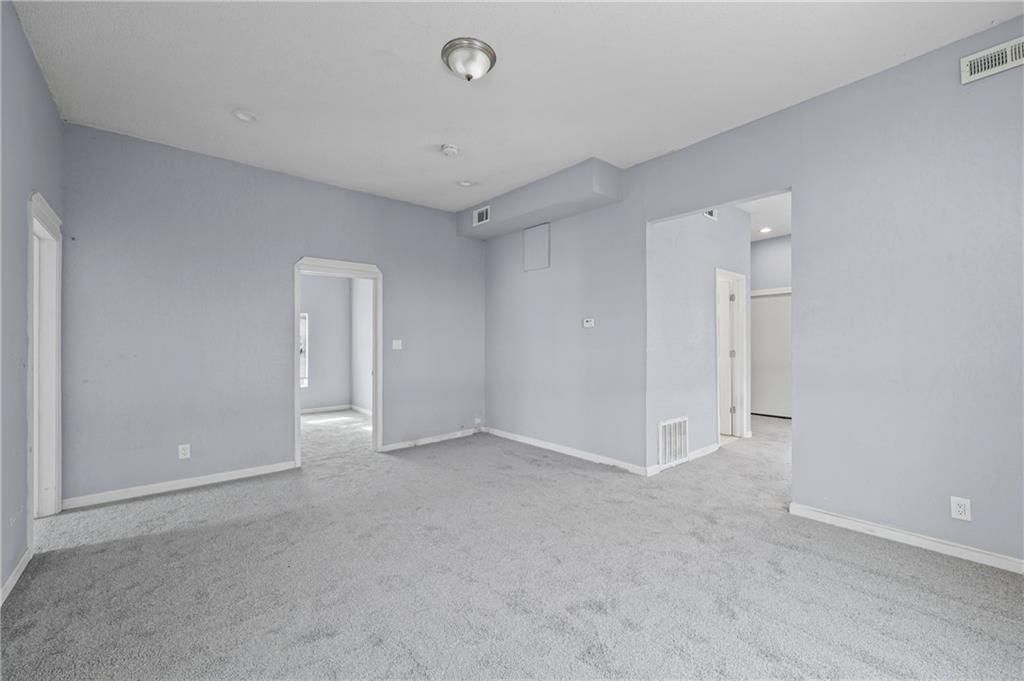


610 ST LOUIS Avenue, Excelsior Springs, MO
502 NE 74th Street Street, Gladstone, MO

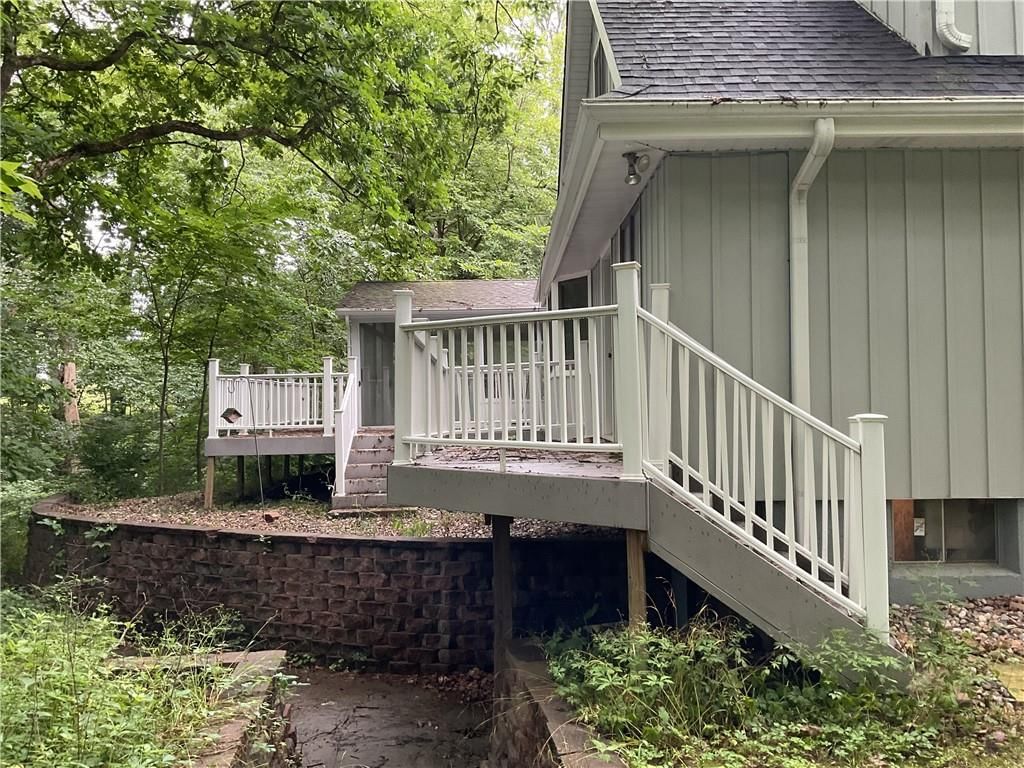

17601 River Drive, Kearney, MO


22 NW 101ST Place, Kansas City, MO


17308 Endicott Road, Kearney, MO


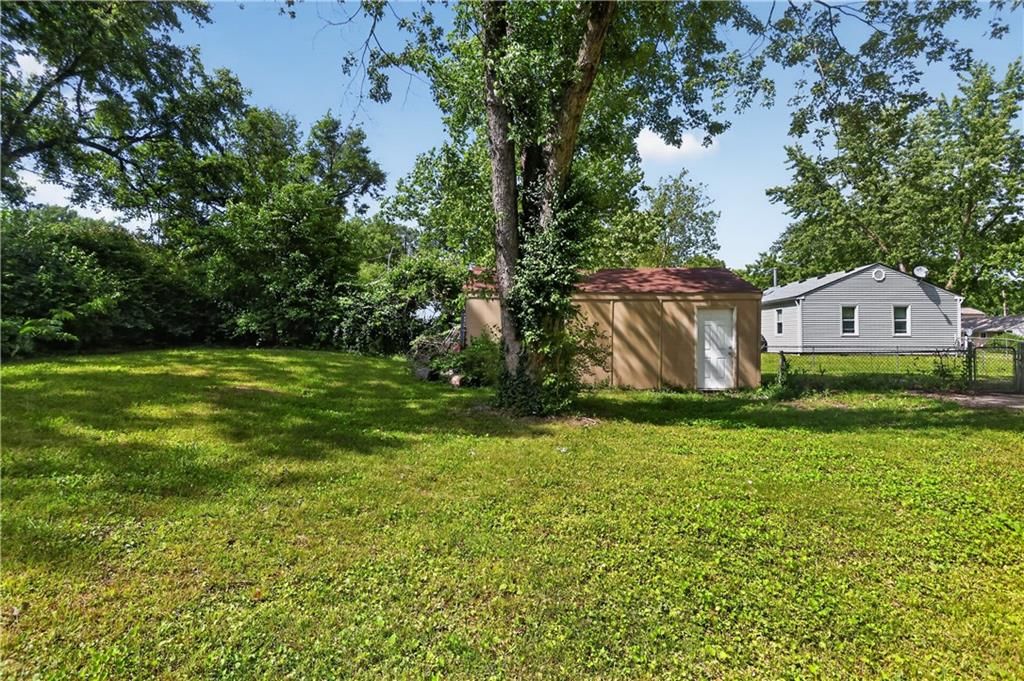
5318 N Garfield Avenue, Kansas City, MO
Start withthe numbers that matter to you
Clay County offers Kansas City's best mix of suburban polish and small-town charm, with 862 homes listed around $399K and a buyer-friendly 83-day average market time.
Real estate inClay County, Missouri
Clay County is home to roughly 255,566 residents spread across 101,008 households, with a median age of 37.6 as of the 2023 American Community Survey. The county skews toward ownership: 69% of housing units are owner-occupied, and the median home value sits at $256,400 per the same survey. For renters, the median gross rent is $1,220 monthly. The typical household income is $86,150, and about 36% of residents hold a bachelor's degree or higher, suggesting a mix of education levels across the population.
Getting around is fairly quick—the mean commute time clocks in at 23.2 minutes per the 2023 ACS, keeping most workers within a reasonable drive of their jobs. The housing market has been active recently: 338 homes sold in the last 30 days at a median price of $352,500, spending a median of 15 days on the market. Year-to-date, 2,594 homes have closed at a median price of $341,000. Those figures point to steady demand and minimal time between list and sale.
New construction remains modest. As of July 2026, the county issued 19 single-family building permits and 23 total building permits over the survey period. That modest supply of new builds, paired with the active sales market, reflects a county where inventory moves briskly and price appreciation has been gradual rather than dramatic.
Sources — demographics: U.S. Census Bureau, American Community Survey 5-year estimates (2023) · listings, prices and days on market: Heartland MLS, as of September 11, 2026 · analysis and home values: HouseLoop
Housing market trendsin Clay County, Missouri
Clay County, MO: 807 homes for sale · 72 new in the last 7 days · median asking $379,950 · 287 price reductions · a median of 15 days to contract. 335 homes closed in the last 30 days, at a median of $345,000. At the pace of the last 90 days that is 2.23 months of supply.
| Measure | Aug 2026 |
|---|---|
| Median sale price | $350,000 |
| Median price per sq ft | $181 |
| Median days to contract | 16 |
| Sell-to-list ratio | 100% |
| Homes sold | 357 |
| New listings | 445 |
| Went under contract | 368 |
Real estateFAQs about Clay County
How many homes are for sale in Clay County?
How much does a home in Clay County cost?
What is the price per square foot in Clay County?
How fast do homes sell in Clay County?
How many homes have sold in Clay County in the past year?
When were the homes in Clay County built?
What are the newest homes for sale in Clay County?
Are there older homes for sale in Clay County?
How big are the homes for sale in Clay County?
How big are the lots in Clay County?
How many bedrooms do homes in Clay County have?
Do homes in Clay County have HOA fees?
Are there single-story homes for sale in Clay County?
Are there homes with a pool in Clay County?
What kind of garages do homes in Clay County have?
What schools serve Clay County?
Schoolsserving Clay County
| School | Median list | |
|---|---|---|
| School districts | ||
| North Kansas City School District | $317,450 | |
| Liberty School District | $474,900 | |
| Kearney School District | $530,000 | |
| Smithville School District | $329,450 | |
| Excelsior Springs School District | $349,950 | |
| Lawson School District | Median— | |
| Platte County R-III School District | Median— | |
| High schools | ||
| Staley | $462,295 | |
| Liberty | $497,000 | |
| Liberty North | $462,450 | |
| Oak Park | $292,500 | |
| Kearney | $499,900 | |
How we compute these
- Median list.
- The middle asking price among the homes for sale right now. Half are listed above it, half below.
- For sale.
- Homes listed as active right now. A live count, not a monthly average.
Newly listedin Clay County, MO
| Address | Price |
|---|---|
| 4413 N Bellefontaine Avenue | Price$249,900 |
| 14014 Zachery Drive | Price$749,000 |
| 1974 Harvest Road | Price$470,000 |
| 1970 Harvest Road | Price$505,000 |
| 2044 Brooke Street | Price$535,000 |
| 107 NE 103rd Street | Price$377,900 |
| 4521 NE 45th Street | Price$235,000 |
| 10728 N Walnut Street | Price$300,000 |
| 1203 NE 122nd Street | Price$692,900 |
| 1108 E 18th Street | Price$370,000 |
| 8509 N Eastern Avenue | Price$499,900 |
| 4306 NE 51st Street | Price$320,000 |
Recently went under contractin Clay County, MO
| Address | List price |
|---|---|
| 8927 N Poplar Avenue | List price$589,500 |
| 2317 Foxtail Drive | List price$635,000 |
| 111 Dogwood Lane | List price$714,664 |
| 10507 N Central Street N | List price$259,000 |
| 7418 N PROSPECT Avenue | List price$380,000 |
| 602 Woodson Street | List price$312,000 |
| 4 HIGHLAND Circle | List price$429,900 |
| 9747 N Lewis Avenue | List price$260,000 |
| 411 Shannon Avenue | List price$360,000 |
| 9638 N Wayne Avenue | List price$439,000 |
| 1204 Wornall Road | List price$180,000 |
| 1211 NE 67th Place | List price$237,500 |
How we compute these
- Under contract.
- Homes with an accepted contract that have not closed yet. A live count.
- Days to contract.
- The middle number of days between a home being listed and going under contract, over the last 90 days of closings. It is not days-to-close, and it is not how long today's listings have been sitting. Newly built homes are excluded, because a build finishing is not a market moving.
Popular home searchesin Clay County
| Search | For sale |
|---|---|
| Open houses | 83 |
| Luxury homes | 36 |
| Just listed homes | 66 |
| Price-reduced homes | 284 |
| Coming soon homes | 81 |
| Homes under contract | 472 |
How we compute these
- For sale.
- Homes listed as active right now. A live count, not a monthly average.
Homes by pricein Clay County
How we compute these
- For sale.
- Homes listed as active right now. A live count, not a monthly average.
Homes by featurein Clay County
How we compute these
- For sale.
- Homes listed as active right now. A live count, not a monthly average.
Search by property typein Clay County
| Property type | Median sale |
|---|---|
| Single Family | $345,000 |
| Townhouse | $240,000 |
| Villa | Median— |
| Condo / Loft | Median— |
| Half Duplex | Median— |
| Duplex | Median— |
| Lots / Land | $220,000 |
How we compute these
- Market.
- Market type is set by months of supply — how long it would take to sell every home for sale at the current pace. Under ~4 months favors sellers (low inventory, faster sales, homes near or above asking); over ~6 favors buyers (more choice, more negotiating room). 4–6 is balanced.
- Months supply.
- How many months it would take to sell every home now for sale at the pace of the last 90 days: homes for sale ÷ (closings in the last 90 days ÷ 3).
- For sale.
- Homes listed as active right now. A live count, not a monthly average.
- Days to contract.
- The middle number of days between a home being listed and going under contract, over the last 90 days of closings. It is not days-to-close, and it is not how long today's listings have been sitting. Newly built homes are excluded, because a build finishing is not a market moving.
- Coming soon.
- Homes announced but not yet accepting showings. A live count.
- Under contract.
- Homes with an accepted contract that have not closed yet. A live count.
Search homesin Clay County
| City | Median list |
|---|---|
| Kansas City | $260,000 |
| Liberty | $399,450 |
| Gladstone | $234,500 |
| Kearney | $482,450 |
| Smithville | $322,450 |
| Excelsior Springs | $319,000 |
How we compute these
- Market.
- Market type is set by months of supply — how long it would take to sell every home for sale at the current pace. Under ~4 months favors sellers (low inventory, faster sales, homes near or above asking); over ~6 favors buyers (more choice, more negotiating room). 4–6 is balanced.
- Months supply.
- How many months it would take to sell every home now for sale at the pace of the last 90 days: homes for sale ÷ (closings in the last 90 days ÷ 3).
- Median list.
- The middle asking price among the homes for sale right now. Half are listed above it, half below.
- Days to contract.
- The middle number of days between a home being listed and going under contract, over the last 90 days of closings. It is not days-to-close, and it is not how long today's listings have been sitting. Newly built homes are excluded, because a build finishing is not a market moving.
- For sale.
- Homes listed as active right now. A live count, not a monthly average.
- Coming soon.
- Homes announced but not yet accepting showings. A live count.
- Under contract.
- Homes with an accepted contract that have not closed yet. A live count.
ZIP codesin Clay County
How we compute these
- Market.
- Market type is set by months of supply — how long it would take to sell every home for sale at the current pace. Under ~4 months favors sellers (low inventory, faster sales, homes near or above asking); over ~6 favors buyers (more choice, more negotiating room). 4–6 is balanced.
- Months supply.
- How many months it would take to sell every home now for sale at the pace of the last 90 days: homes for sale ÷ (closings in the last 90 days ÷ 3).
- Median list.
- The middle asking price among the homes for sale right now. Half are listed above it, half below.
- Days to contract.
- The middle number of days between a home being listed and going under contract, over the last 90 days of closings. It is not days-to-close, and it is not how long today's listings have been sitting. Newly built homes are excluded, because a build finishing is not a market moving.
- For sale.
- Homes listed as active right now. A live count, not a monthly average.
- Coming soon.
- Homes announced but not yet accepting showings. A live count.
- Under contract.
- Homes with an accepted contract that have not closed yet. A live count.
Search homes for salein every city we cover
How we compute these
- Market.
- Market type is set by months of supply — how long it would take to sell every home for sale at the current pace. Under ~4 months favors sellers (low inventory, faster sales, homes near or above asking); over ~6 favors buyers (more choice, more negotiating room). 4–6 is balanced.
- Months supply.
- How many months it would take to sell every home now for sale at the pace of the last 90 days: homes for sale ÷ (closings in the last 90 days ÷ 3).
- Median list.
- The middle asking price among the homes for sale right now. Half are listed above it, half below.
- Days to contract.
- The middle number of days between a home being listed and going under contract, over the last 90 days of closings. It is not days-to-close, and it is not how long today's listings have been sitting. Newly built homes are excluded, because a build finishing is not a market moving.
- For sale.
- Homes listed as active right now. A live count, not a monthly average.
- Coming soon.
- Homes announced but not yet accepting showings. A live count.
- Under contract.
- Homes with an accepted contract that have not closed yet. A live count.
Search for homesin popular markets
| Market | For sale |
|---|---|
| Heritage Ranch | 28 |
| Canyon Lakes | 25 |
| Ruskin Heights | 24 |
| Garrett Ranch | 24 |
| Seven Bridges | 24 |
| Tomahawk Valley | 23 |
How we compute these
- Market.
- Market type is set by months of supply — how long it would take to sell every home for sale at the current pace. Under ~4 months favors sellers (low inventory, faster sales, homes near or above asking); over ~6 favors buyers (more choice, more negotiating room). 4–6 is balanced.
- For sale.
- Homes listed as active right now. A live count, not a monthly average.
Or go wider stillcounty, metro and state
How we compute these
- Market.
- Market type is set by months of supply — how long it would take to sell every home for sale at the current pace. Under ~4 months favors sellers (low inventory, faster sales, homes near or above asking); over ~6 favors buyers (more choice, more negotiating room). 4–6 is balanced.
- Months supply.
- How many months it would take to sell every home now for sale at the pace of the last 90 days: homes for sale ÷ (closings in the last 90 days ÷ 3).
- Median list.
- The middle asking price among the homes for sale right now. Half are listed above it, half below.
- Days to contract.
- The middle number of days between a home being listed and going under contract, over the last 90 days of closings. It is not days-to-close, and it is not how long today's listings have been sitting. Newly built homes are excluded, because a build finishing is not a market moving.
- For sale.
- Homes listed as active right now. A live count, not a monthly average.
- Coming soon.
- Homes announced but not yet accepting showings. A live count.
- Under contract.
- Homes with an accepted contract that have not closed yet. A live count.