
Houses for Sale in Pleasant Hill, MO
· 48 homes fit this search48 homes fit this search · Sorted by Newest Listed
About Single Family Residence Homes in Pleasant Hill, MO
Pleasant Hill, MO has 48 single family residence homes for sale right now, with a median list price of $375,000. These single family residence homes were built between 1900 and 2026. Most are between 984 and 3,543 square feet.
Housing market trends in Pleasant Hill, MO (all homes)
81
Homes for sale in Pleasant Hill · 4 coming soon
$269,900
Median list price
21 days
Median days to contract
3.61 mo
Months of supply
| Measure | Oct 2026 | Sep 2026 | Oct 2025 |
|---|---|---|---|
| Median sale price | $379,900 | $423,000 | $345,000 |
| Median price per sq ft | $189 | $208 | $213 |
| Median days to contract | 11 | 22 | 32 |
| Sell-to-list ratio | 100% | 100% | 100% |
| Homes sold | 21 | 24 | 17 |
| New listings | 19 | 25 | 20 |
| Went under contract | 18 | 18 | 9 |
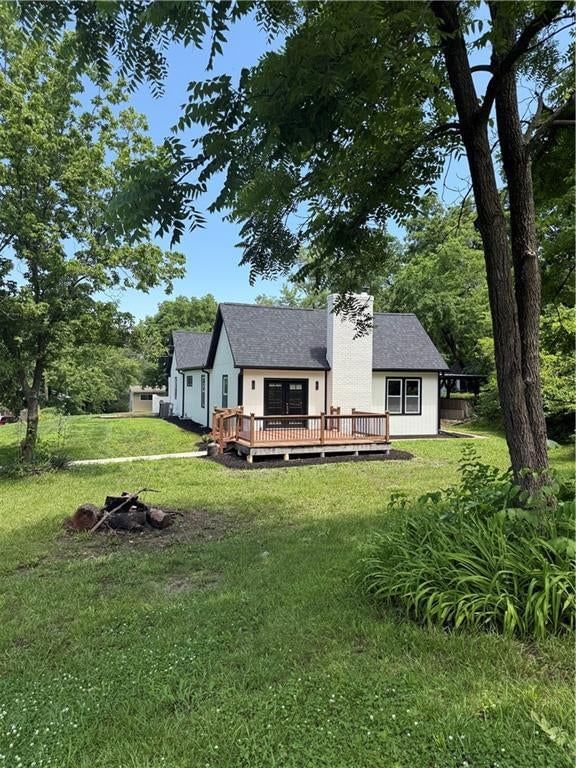
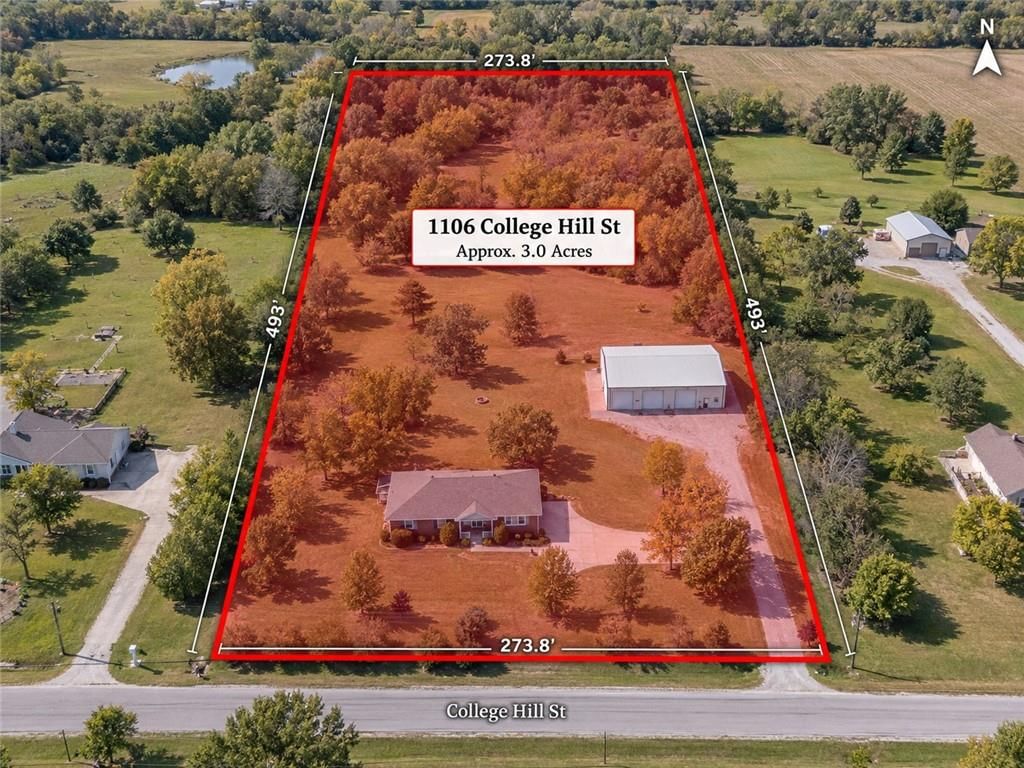
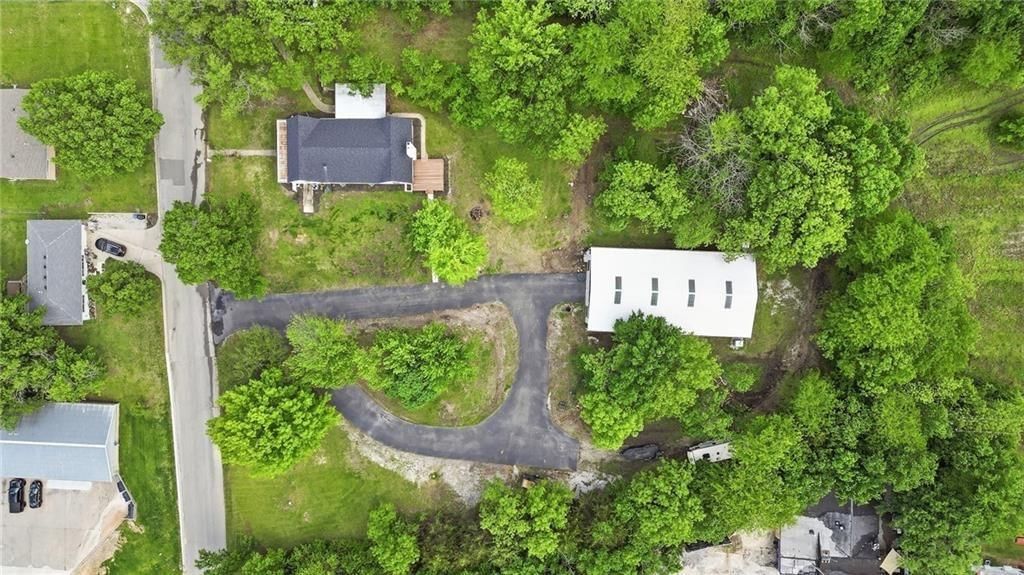
24 photos
Price Cut · $36K
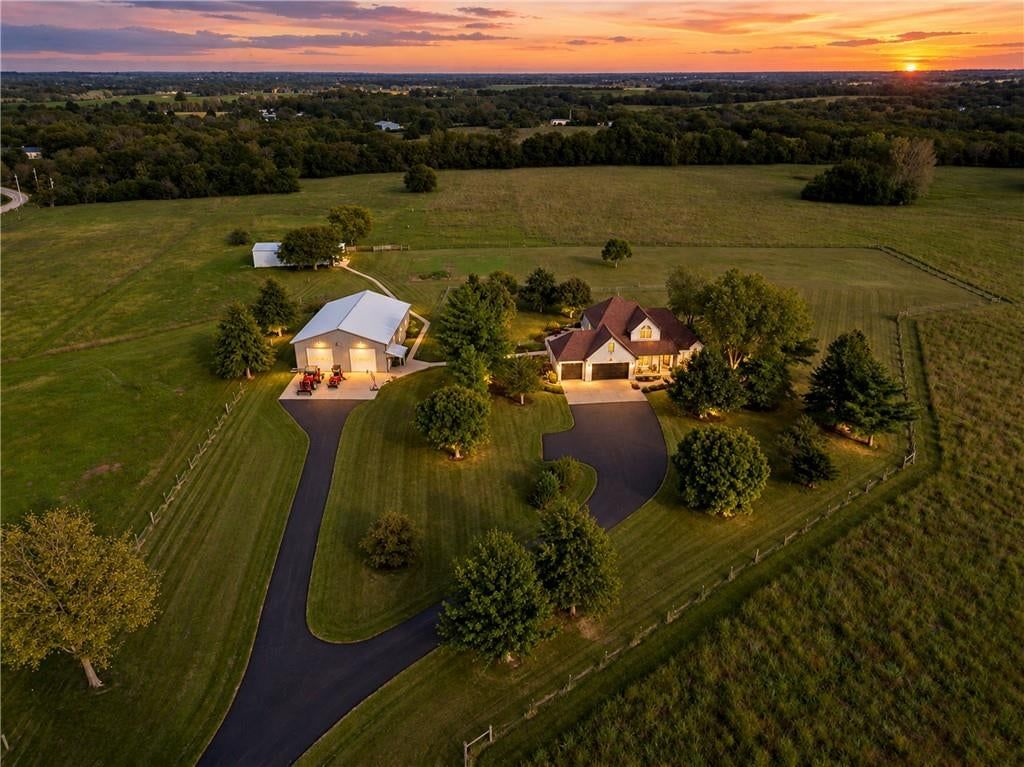
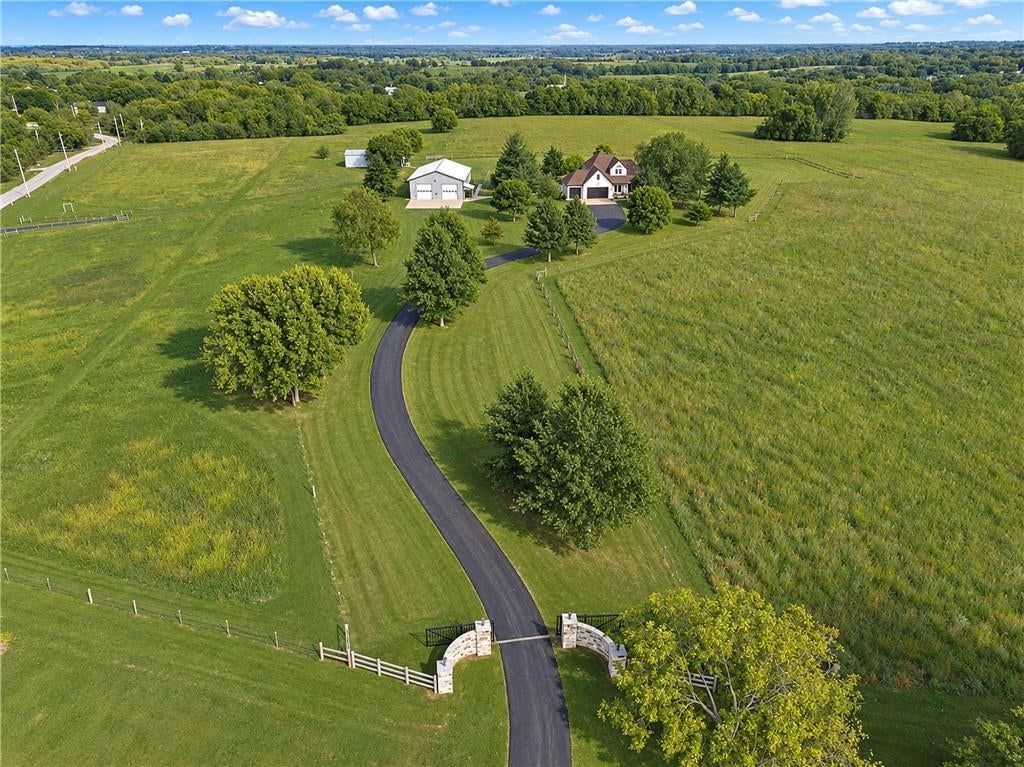
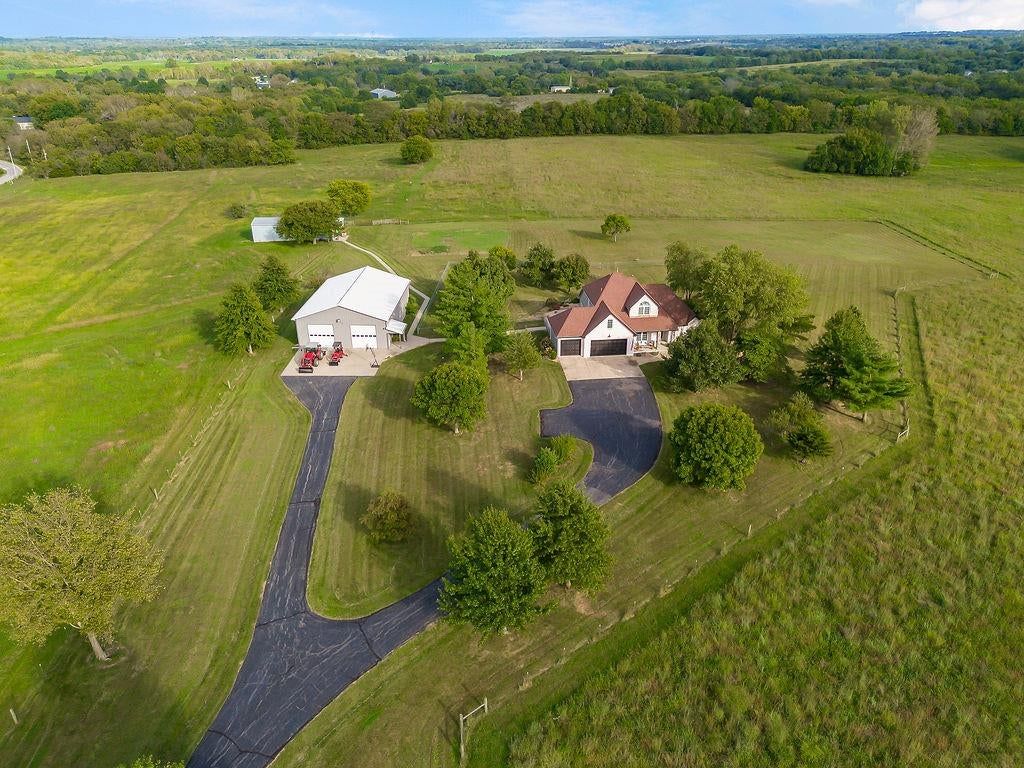
67 photos
5+ acre lot
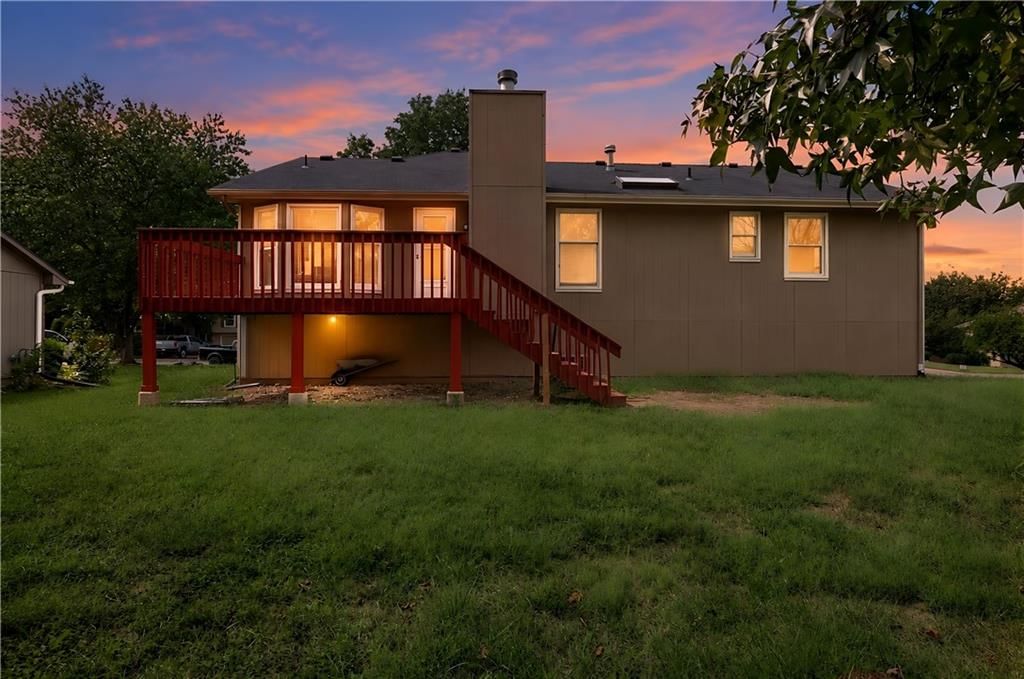
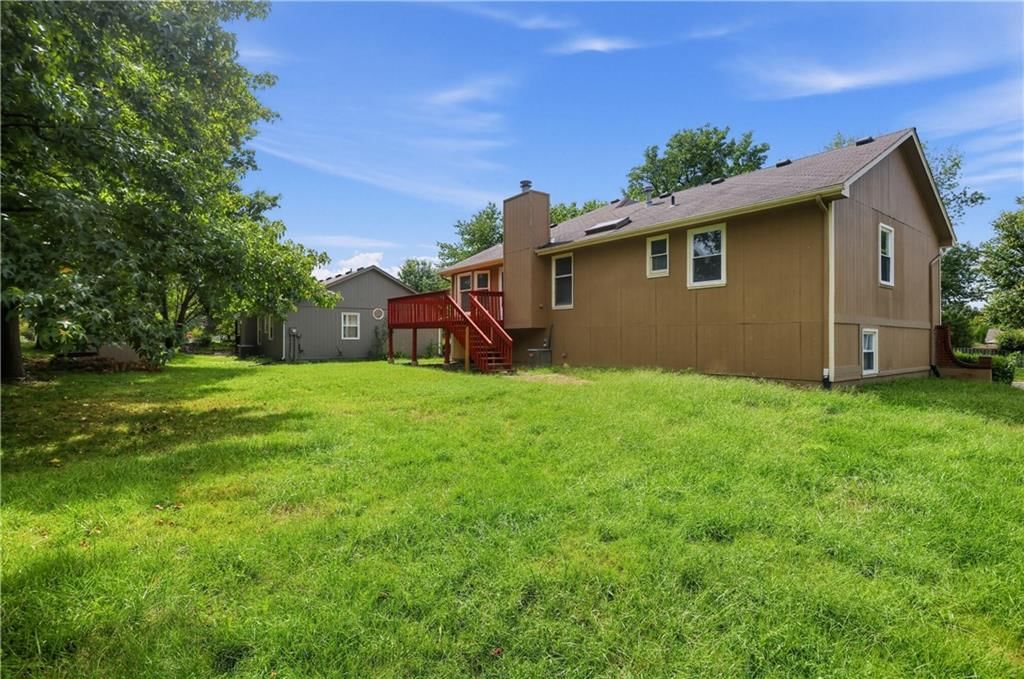
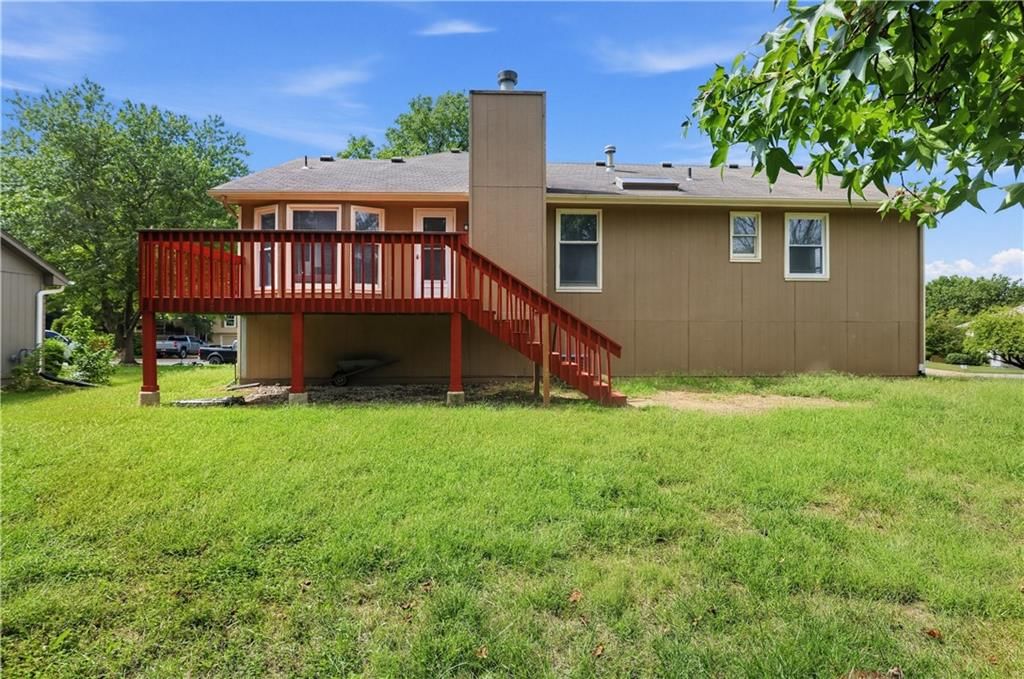
30 photos
Price Cut · $15K
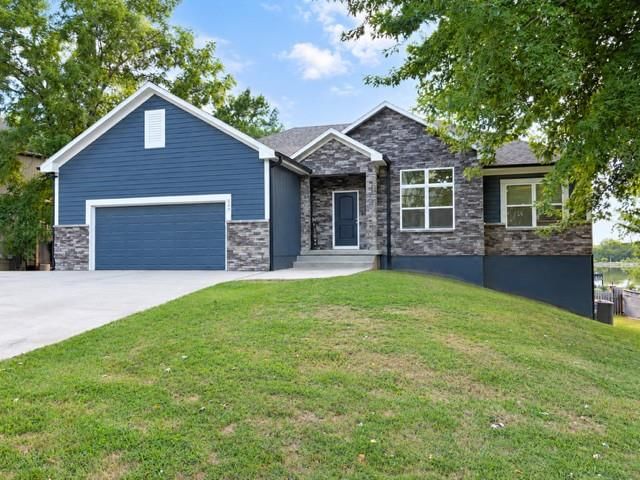
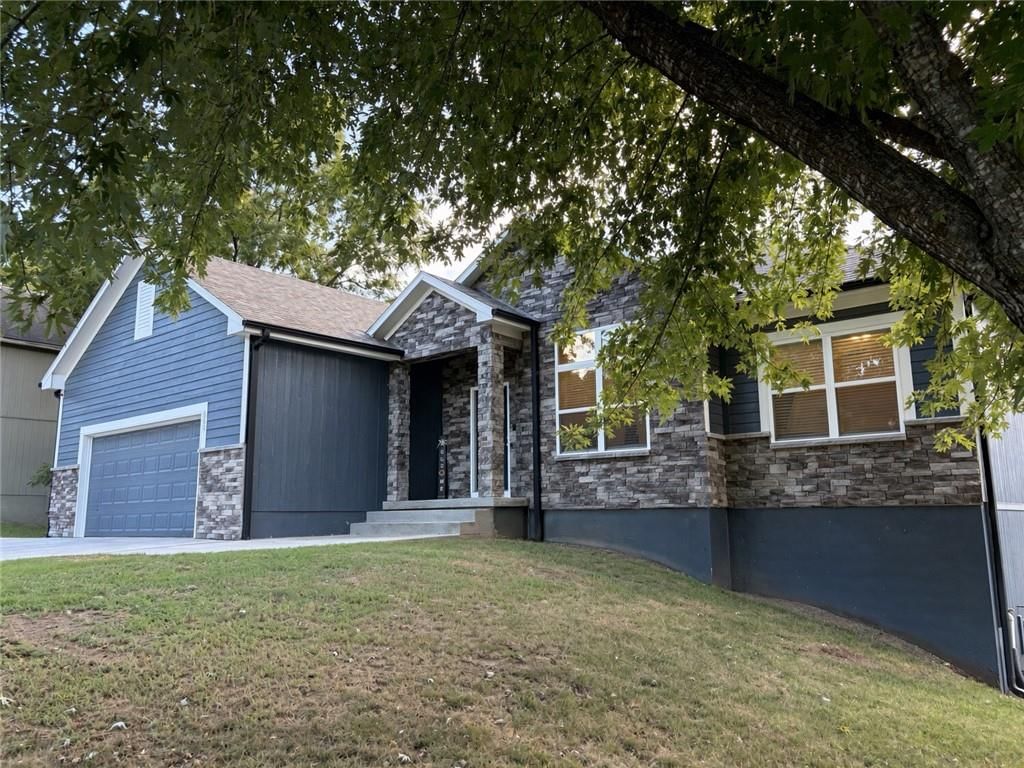
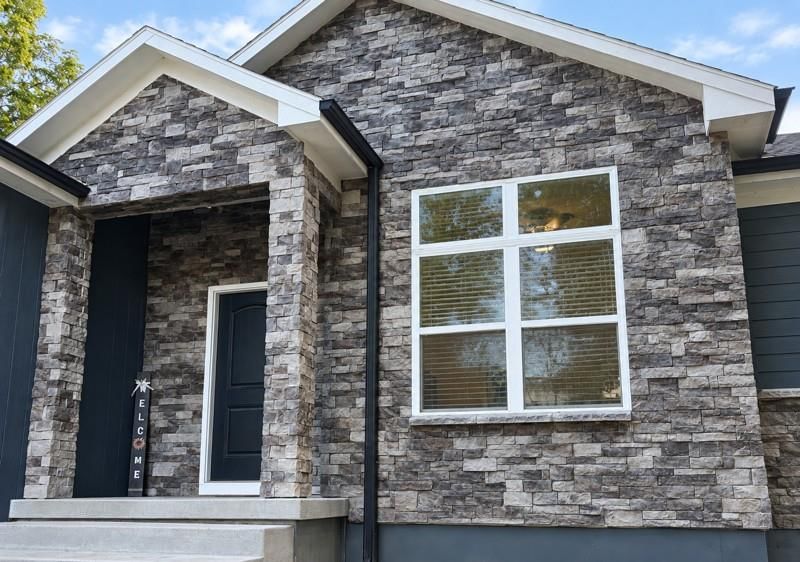
60 photos
Price Cut · $35K
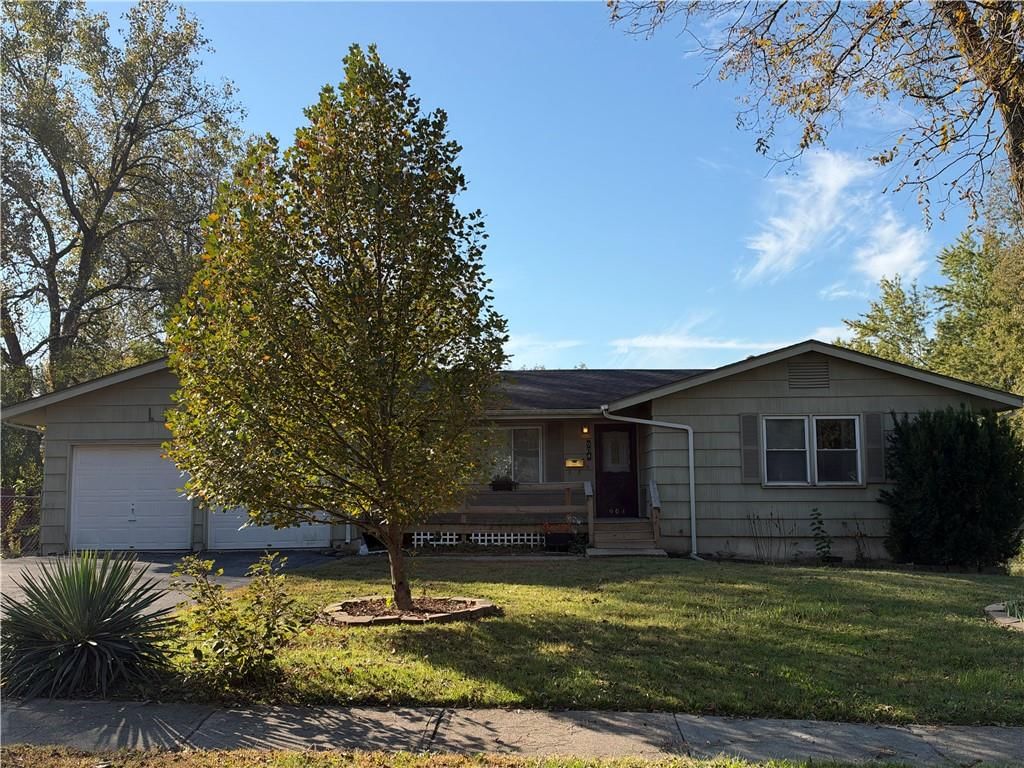
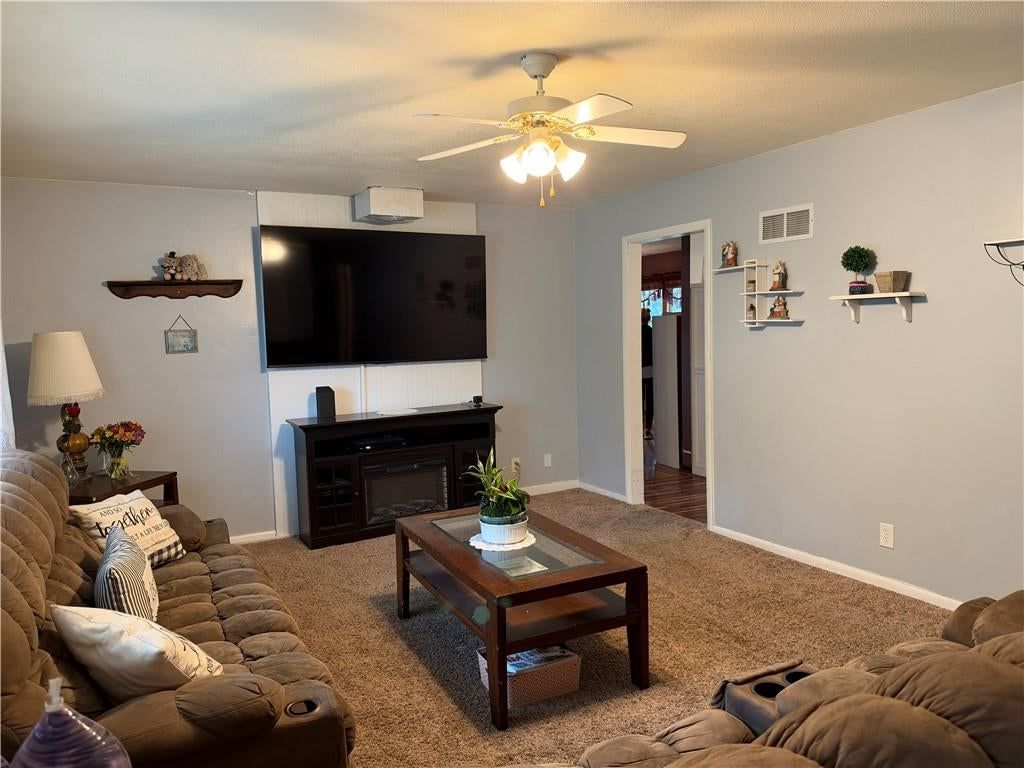
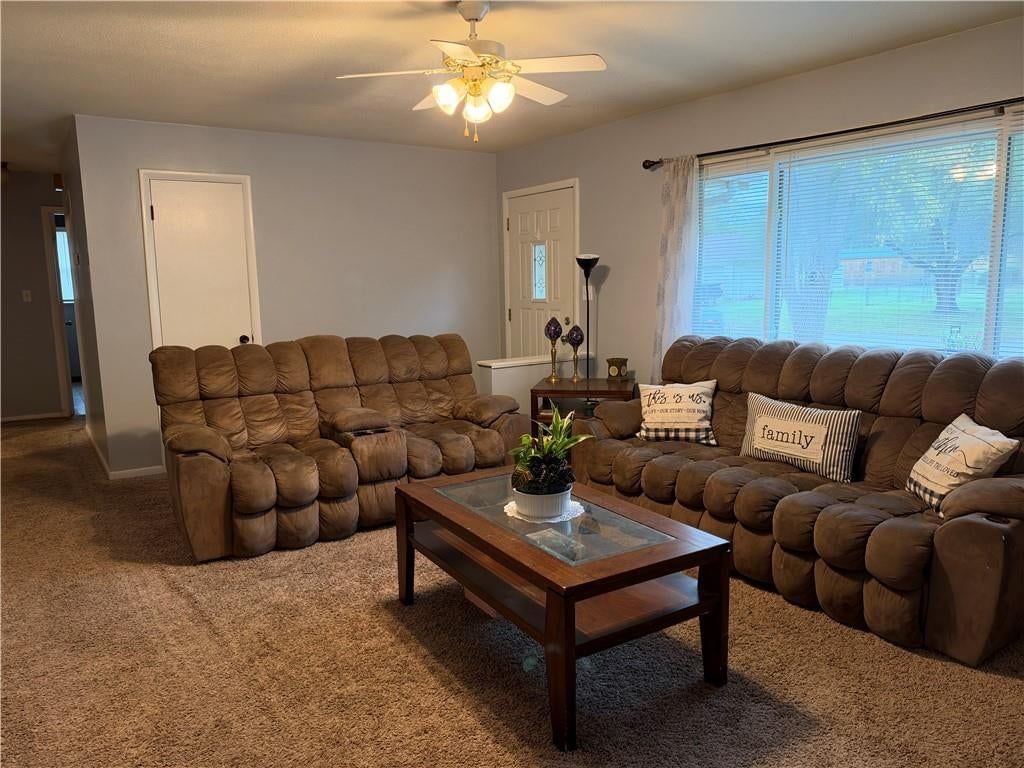
15 photos
Single-story
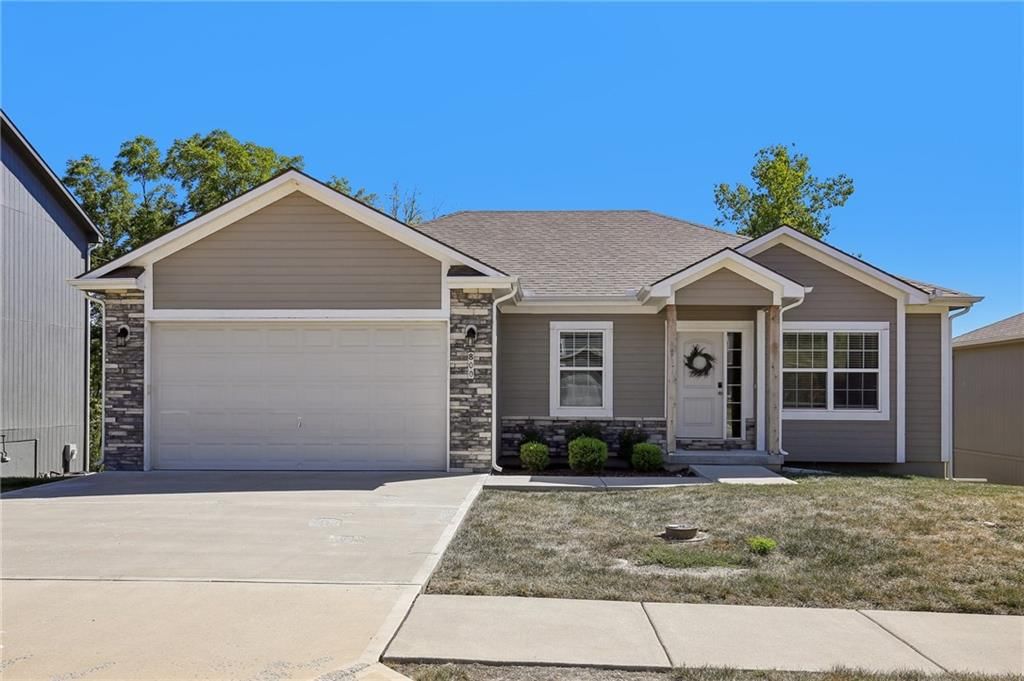
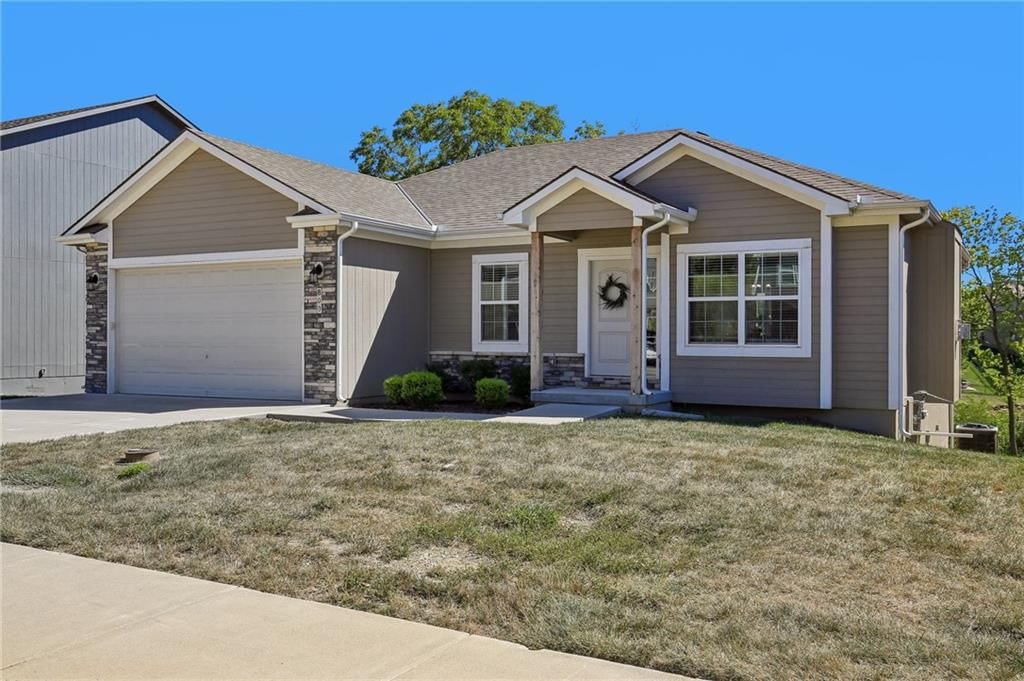
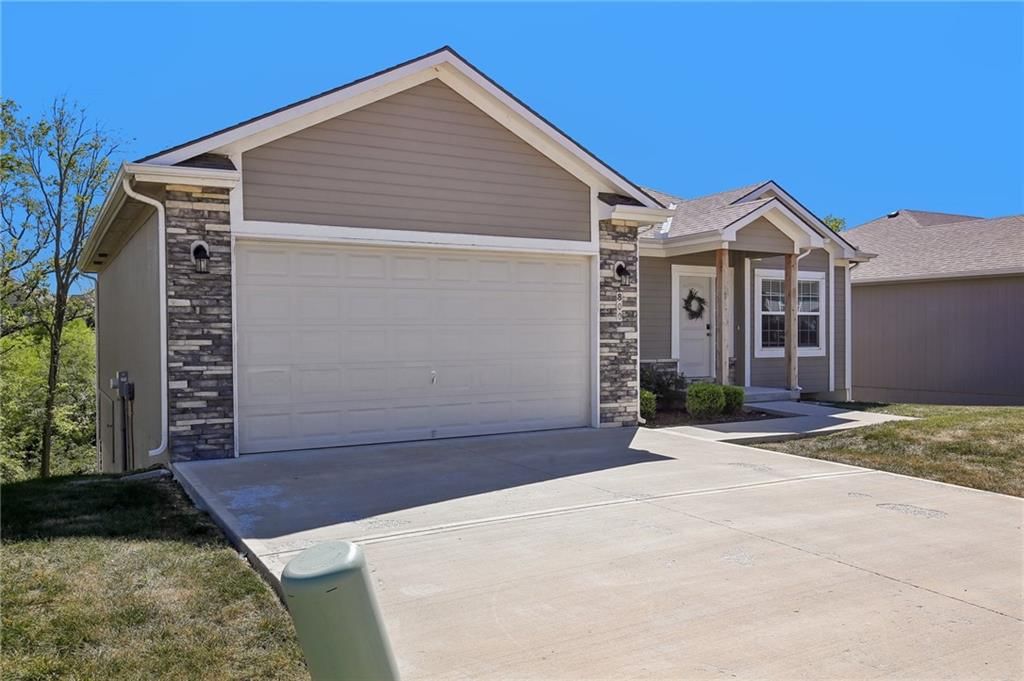
42 photos
Price Cut · $5K
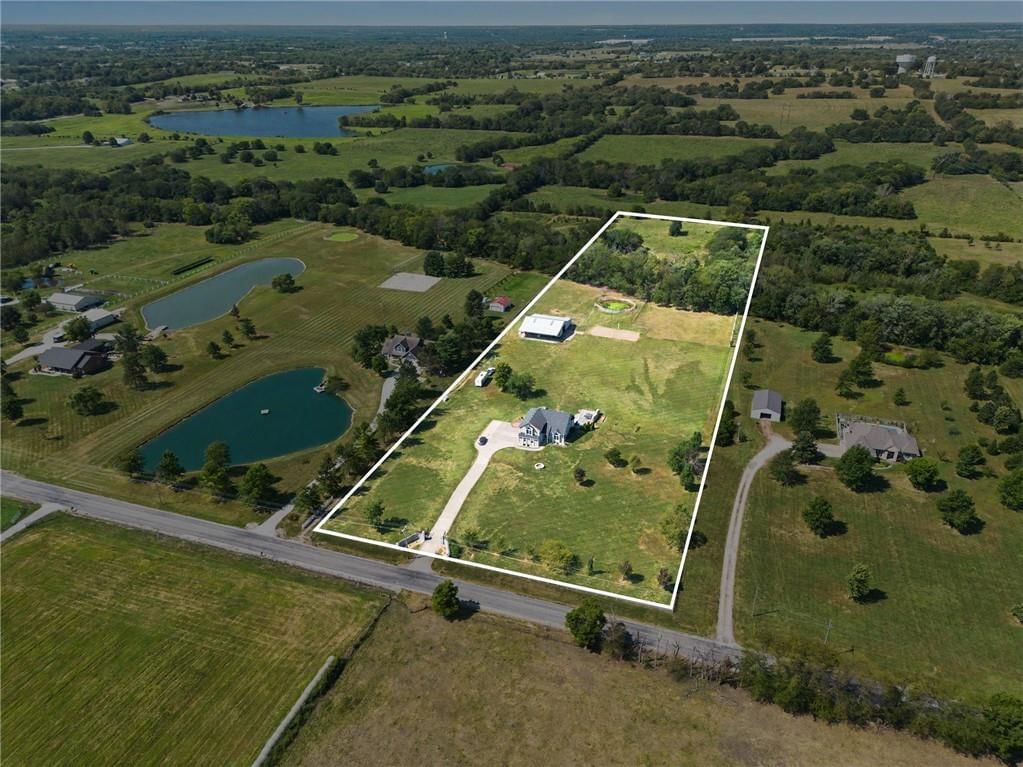
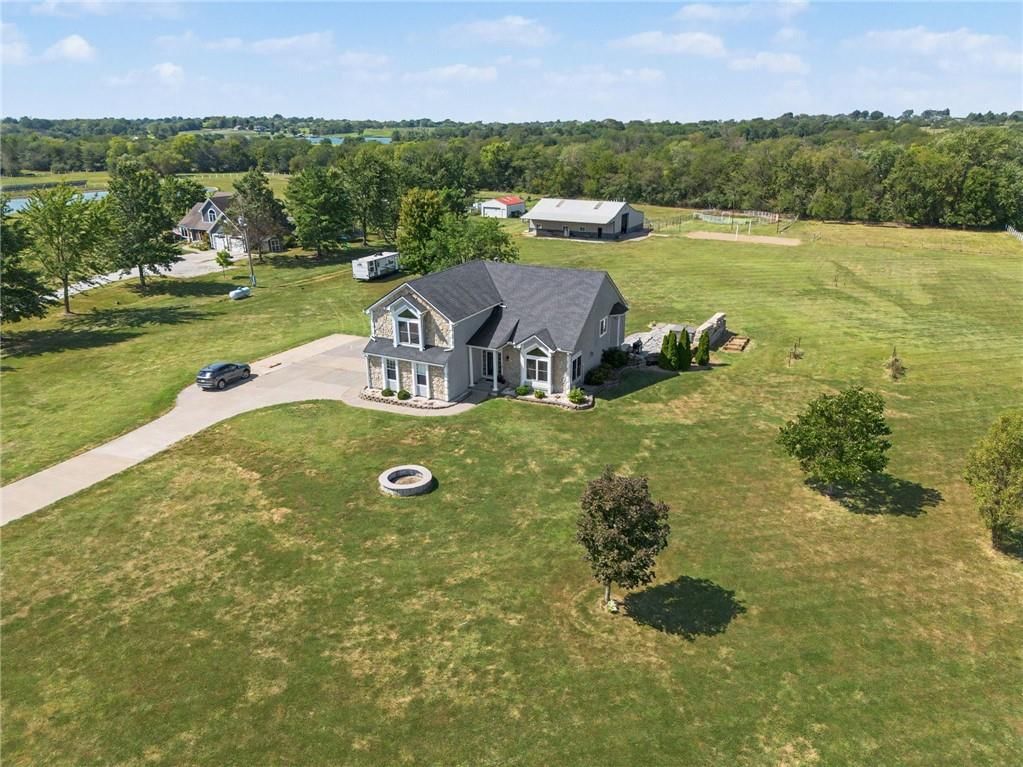
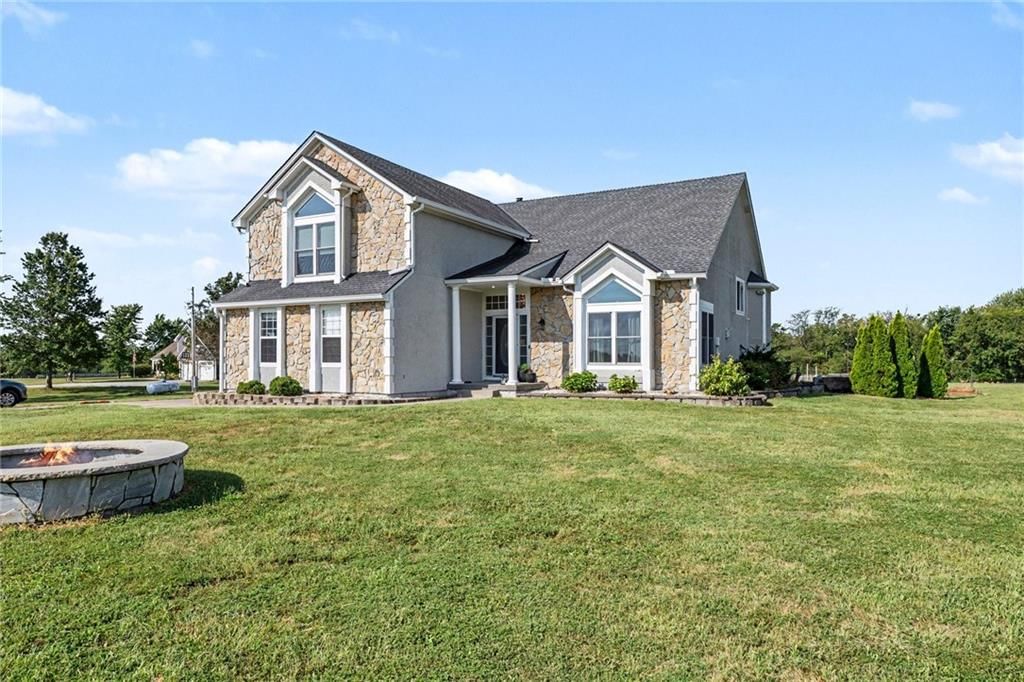
45 photos
Price Cut · $151K
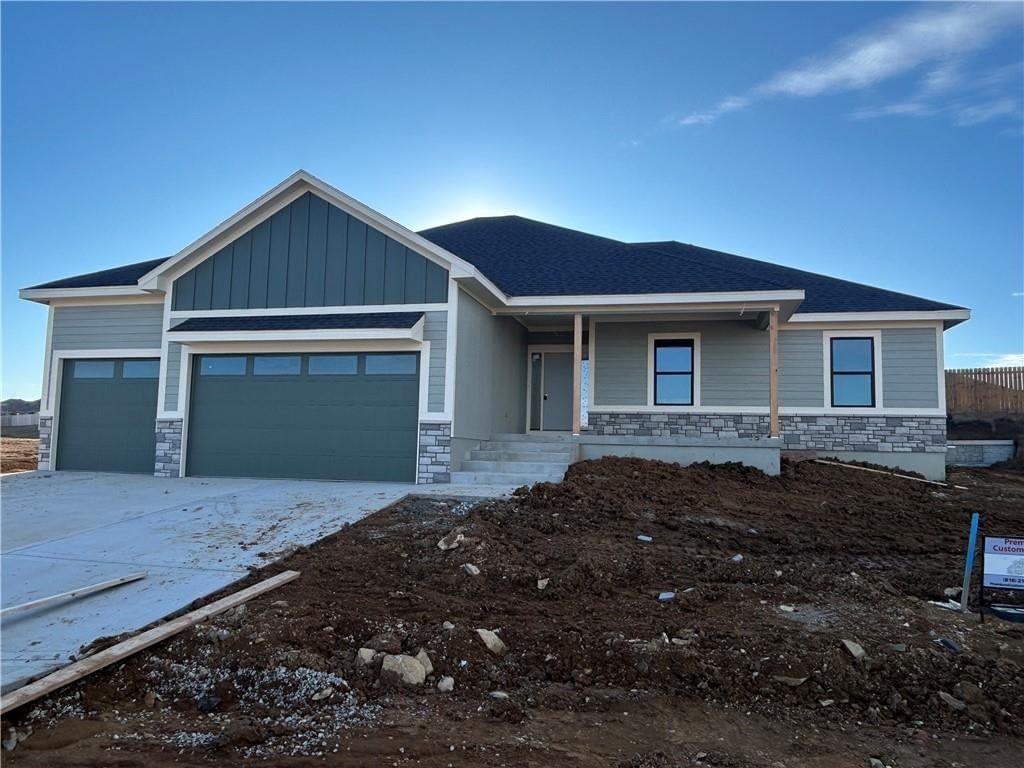
Open Sat 11 AM to 1 PM
① Pleasant Hill itself — the place you are on
Popular home searches in Pleasant Hill
| Search | For sale |
|---|---|
| Open houses | For sale7 |
| Luxury homes | For sale7 |
| Just listed homes | For sale4 |
| Price-reduced homes | For sale34 |
| Coming soon homes | For sale4 |
| Homes under contract | For sale17 |
How we compute these
- For sale.
- Homes listed as active right now. A live count, not a monthly average.
Homes by price in Pleasant Hill
| Price range | For sale |
|---|---|
| Under $200,000 | For sale22 |
| Under $300,000 | For sale45 |
| Under $400,000 | For sale57 |
| Under $500,000 | For sale64 |
How we compute these
- For sale.
- Homes listed as active right now. A live count, not a monthly average.
② Its neighborhoods — one step out
Nearby neighborhoods to Pleasant Hill
| Neighborhood | Market (Market type is set by months of supply — how long it would take to sell every home for sale at the current pace. Under ~4 months favors sellers (low inventory, faster sales, homes near or above asking); over ~6 favors buyers (more choice, more negotiating room). 4–6 is balanced.) | Months supply | For sale | Median sale | Sell-to-list | Days to contract | Coming soon | Under contract |
|---|---|---|---|---|---|---|---|---|
| Hunters Ridge | Strong Seller's | 1.2 mo | 1 | Median$416,500 | 99% | 35d | 0 | 1 |
| Sugarland Estates | Seller's | 4 mo | 2 | Median$382,500 | — | 38d | 0 | 1 |
| Ridge Tree | Balanced | 4.5 mo | 3 | Median$486,400 | — | 20d | 0 | 0 |
| Hickory Hills | Buyer's | 6.5 mo | 6 | Median$470,000 | 99% | 18d | 0 | 0 |
| Stone Creek | Balanced | 6 mo | 3 | Median$282,500 | — | 4d | 0 | 0 |
How we compute these
- Market.
- Market type is set by months of supply — how long it would take to sell every home for sale at the current pace. Under ~4 months favors sellers (low inventory, faster sales, homes near or above asking); over ~6 favors buyers (more choice, more negotiating room). 4–6 is balanced.
- Months supply.
- How many months it would take to sell every home now for sale at the pace of the last 90 days: homes for sale ÷ (closings in the last 90 days ÷ 3).
- For sale.
- Homes listed as active right now. A live count, not a monthly average.
- Days to contract.
- The middle number of days between a home being listed and going under contract, over the last 90 days of closings. It is not days-to-close, and it is not how long today's listings have been sitting. Newly built homes are excluded, because a build finishing is not a market moving.
- Coming soon.
- Homes announced but not yet accepting showings. A live count.
- Under contract.
- Homes with an accepted contract that have not closed yet. A live count.
③ Nearby cities — two steps out
Search homes nearby Pleasant Hill
| Place | Market (Market type is set by months of supply — how long it would take to sell every home for sale at the current pace. Under ~4 months favors sellers (low inventory, faster sales, homes near or above asking); over ~6 favors buyers (more choice, more negotiating room). 4–6 is balanced.) | Months supply | Median list | Sell-to-list | Days to contract | For sale | Coming soon | Under contract |
|---|---|---|---|---|---|---|---|---|
| Pleasant Hill | Balanced | 4.5 mo | Median$269,900 | 96% | 24d | 85 | 4 | 17 |
| Raymore | Balanced | 4.5 mo | Median$379,900 | 96% | 27d | 190 | 9 | 99 |
| Belton | Seller's | 2.7 mo | Median$349,500 | 100% | 23d | 80 | 3 | 43 |
| Harrisonville | Balanced | 5 mo | Median$320,000 | 94% | 29d | 87 | 1 | 16 |
| Peculiar | Balanced | 4.6 mo | Median$360,000 | 95% | 30d | 78 | 3 | 30 |
How we compute these
- Market.
- Market type is set by months of supply — how long it would take to sell every home for sale at the current pace. Under ~4 months favors sellers (low inventory, faster sales, homes near or above asking); over ~6 favors buyers (more choice, more negotiating room). 4–6 is balanced.
- Months supply.
- How many months it would take to sell every home now for sale at the pace of the last 90 days: homes for sale ÷ (closings in the last 90 days ÷ 3).
- Median list.
- The middle asking price among the homes for sale right now. Half are listed above it, half below.
- Days to contract.
- The middle number of days between a home being listed and going under contract, over the last 90 days of closings. It is not days-to-close, and it is not how long today's listings have been sitting. Newly built homes are excluded, because a build finishing is not a market moving.
- For sale.
- Homes listed as active right now. A live count, not a monthly average.
- Coming soon.
- Homes announced but not yet accepting showings. A live count.
- Under contract.
- Homes with an accepted contract that have not closed yet. A live count.