
Independence 64052 Single-Story Homes for Sale
30 homes for sale in 64052 · Sorted by Newest Listed
3609 Blue Ridge Boulevard, Independence, MO
New · 6h ago


10821 E 19th Street, Independence, MO
New · 6h ago


3028 S Hedges Avenue, Independence, MO
New · 2d ago


9336 E 25th Terrace South, Independence, MO
New · 2d ago


1535 S Cedar Avenue, Independence, MO
New · 2d ago


10417 E 27TH Street, Independence, MO
New · 2d ago


3706 S Sterling Avenue, Independence, MO
New · 5d ago


1222 W 26th Street S, Independence, MO


2309 S Crescent Avenue, Independence, MO


9612 E 31st Street, Independence, MO


10015 E 31st Street, Independence, MO


3017 S Hall Road, Independence, MO


11111 E 36th Street, Independence, MO


10214 E Sheley Road, Independence, MO


12107 Newbury Lane, Independence, MO


9723 E 13th Street S, Independence, MO


1431 S Hardy Avenue, Independence, MO


3605 S Norwood Avenue, Independence, MO


2315 S Maywood Avenue, Independence, MO


3313 Vermont Avenue, Independence, MO


3320 Blue Ridge Boulevard, Independence, MO


1208 W 25TH Terrace, Independence, MO


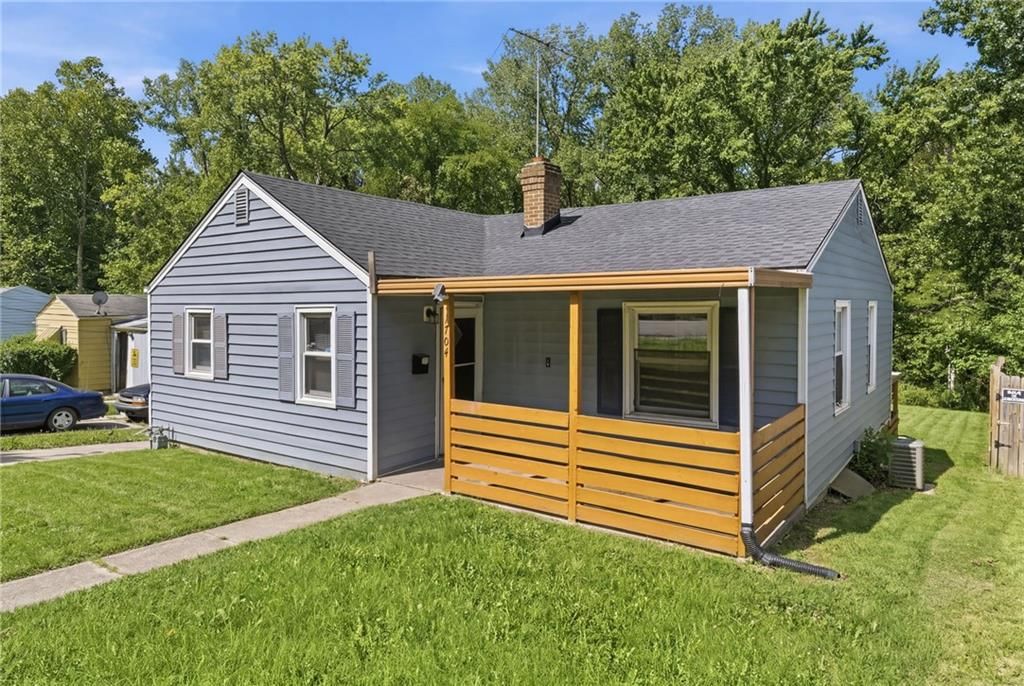
1704 S Brookside Avenue, Independence, MO
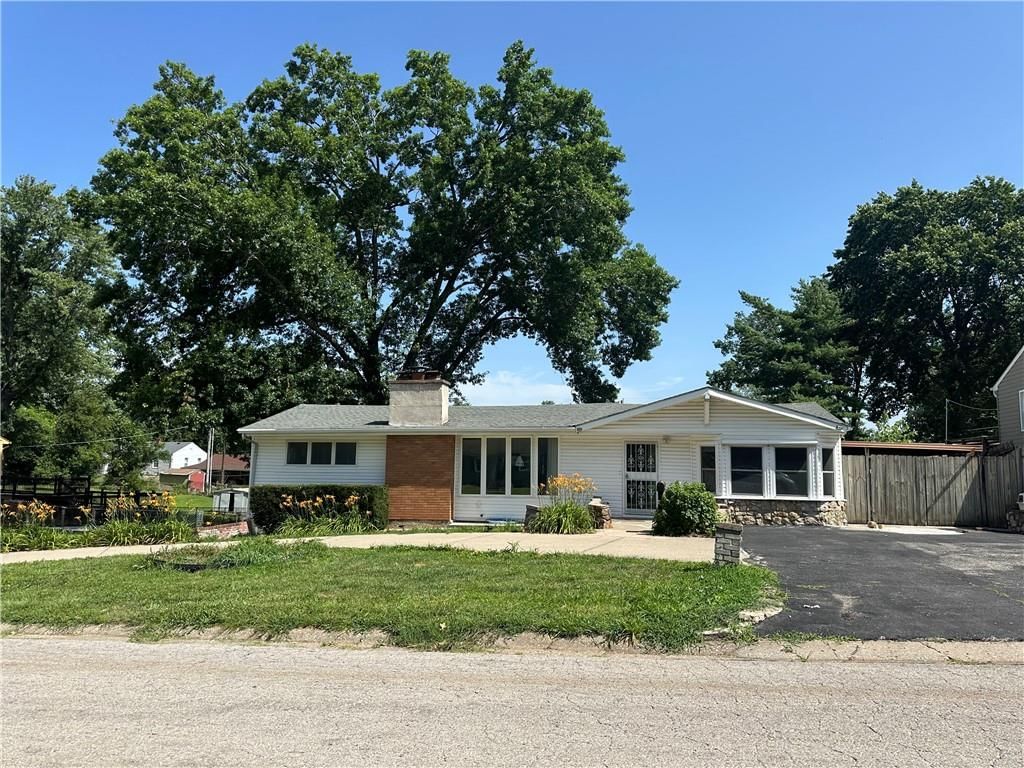

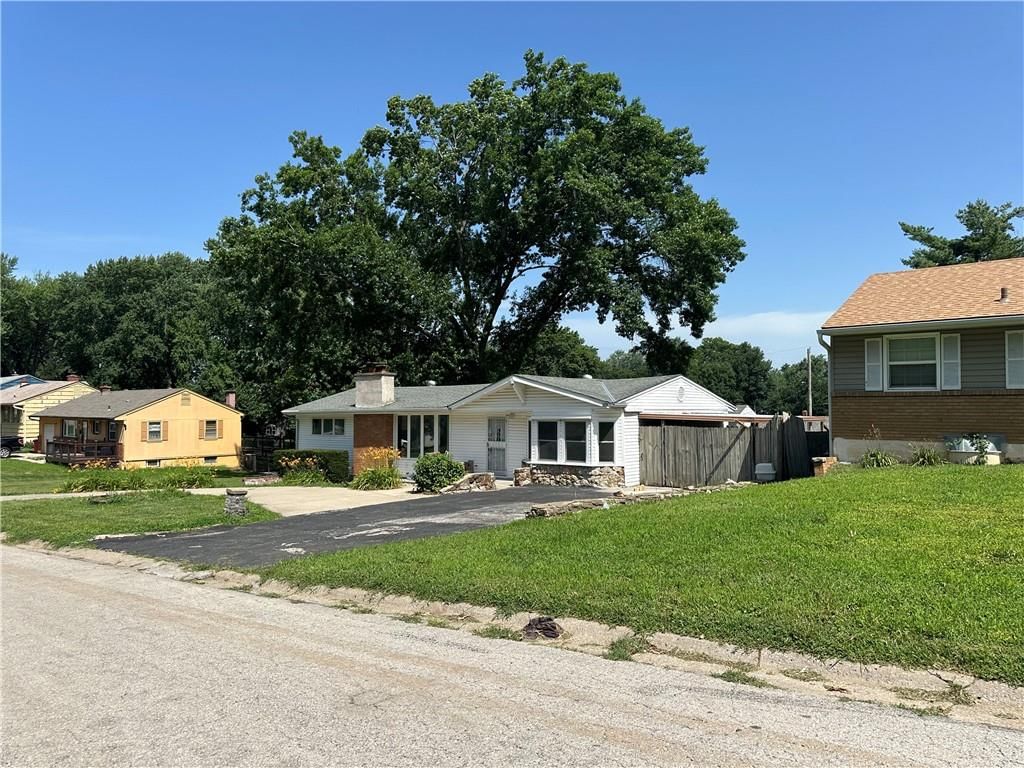
10520 E 28TH Terrace S, Independence, MO
About Single-Story Homes in Independence 64052
Independence 64052 has 30 single-story homes for sale right now, with a median list price of $199,900 as of Sep 27 These single-story homes were built between 1920 and 1968, ranging from 556 to 3,286 square feet.
Single-Story Homes market trends Independence 64052
Independence 64052: 57 homes for sale · 4 new in the last 7 days · median asking $199,000 · 25 price reductions · a median of 16 days to contract. 28 homes closed in the last 30 days, at a median of $180,000. At the pace of the last 90 days that is 2.06 months of supply.
Single-Story Homes FAQs Independence 64052
How many single-story homes are for sale in Independence 64052?
What is the median list price of single-story homes in Independence 64052?
Schools serving 64052
| School | Median list | |
|---|---|---|
| School districts | ||
| Independence School District | Median— | |
| Kansas City MO School District | Median— | |
| High schools | ||
| Van Horn | Median— | |
| Truman | Median— | |
| Middle schools | ||
| Nowlin | Median— | |
| Elementary schools | ||
| Three Trails | Median— | |
| Cassell Park | Median— | |
| Korte | Median— | |
How we compute these
- Median list.
- The middle asking price among the homes for sale right now. Half are listed above it, half below.
- For sale.
- Homes listed as active right now. A live count, not a monthly average.
Newly listed in 64052
| Address | Price |
|---|---|
| 10821 E 19th Street | Price$129,900 |
| 3028 S Hedges Avenue | Price$195,000 |
| 9336 E 25th Terrace South | Price$175,000 |
| 3706 S Sterling Avenue | Price$199,000 |
Recently went under contract in 64052
| Address | List price |
|---|---|
| 1500 S Maywood Avenue | List price$177,500 |
| 9622 Linwood Boulevard | List price$210,000 |
| 2614 S Northern Boulevard | List price$169,000 |
| 3511 S Northern Avenue | List price$145,000 |
| 3714 Blue Ridge Boulevard | List price$284,000 |
| 10305 E 35th Street | List price$165,000 |
| 701 W Jones Street | List price$134,900 |
| 2801 Englewood Terrace | List price$290,000 |
| 2915 S Sterling Avenue | List price$160,000 |
| 3603 S Claremont Avenue | List price$215,000 |
| 3321 Blue Ridge Boulevard | List price$185,000 |
| 1712 S Brookside Avenue | List price$135,000 |
How we compute these
- Under contract.
- Homes with an accepted contract that have not closed yet. A live count.
- Days to contract.
- The middle number of days between a home being listed and going under contract, over the last 90 days of closings. It is not days-to-close, and it is not how long today's listings have been sitting. Newly built homes are excluded, because a build finishing is not a market moving.
Homes by feature in 64052
| Feature | For sale |
|---|---|
| No HOA | 60 |
| Homes with public water | For sale56 |
| Homes with a public sewer | For sale54 |
| Under 1/4 acre | 39 |
| Built before 1960 | 36 |
| Under 1,500 sq ft | 33 |
| Two or more stories | For sale33 |
| Single story | 30 |
| 2+ full bathrooms | 29 |
| Homes with wood floors | For sale29 |
| 3 bedrooms | 26 |
| Homes with an attached garage | For sale24 |
How we compute these
- For sale.
- Homes listed as active right now. A live count, not a monthly average.
Nearby neighborhoods to Independence
| Neighborhood | Median sale |
|---|---|
| Far View Heights | $202,500 |
| Glendale Gardens | $240,000 |
| Sycamore Hills | $231,000 |
| Kentucky Hills | $188,000 |
| Fairmount | $125,000 |
| Blue Mills | $233,400 |
How we compute these
- Market.
- Market type is set by months of supply — how long it would take to sell every home for sale at the current pace. Under ~4 months favors sellers (low inventory, faster sales, homes near or above asking); over ~6 favors buyers (more choice, more negotiating room). 4–6 is balanced.
- Months supply.
- How many months it would take to sell every home now for sale at the pace of the last 90 days: homes for sale ÷ (closings in the last 90 days ÷ 3).
- For sale.
- Homes listed as active right now. A live count, not a monthly average.
- Days to contract.
- The middle number of days between a home being listed and going under contract, over the last 90 days of closings. It is not days-to-close, and it is not how long today's listings have been sitting. Newly built homes are excluded, because a build finishing is not a market moving.
- Coming soon.
- Homes announced but not yet accepting showings. A live count.
- Under contract.
- Homes with an accepted contract that have not closed yet. A live count.
Search homes nearby 64052
| Place | Median list |
|---|---|
| Independence | $228,900 |
| Kansas City | $260,000 |
| Lee's Summit | $521,812 |
| Blue Springs | $397,450 |
| Raytown | $236,000 |
| Grandview | $249,500 |
How we compute these
- Market.
- Market type is set by months of supply — how long it would take to sell every home for sale at the current pace. Under ~4 months favors sellers (low inventory, faster sales, homes near or above asking); over ~6 favors buyers (more choice, more negotiating room). 4–6 is balanced.
- Months supply.
- How many months it would take to sell every home now for sale at the pace of the last 90 days: homes for sale ÷ (closings in the last 90 days ÷ 3).
- Median list.
- The middle asking price among the homes for sale right now. Half are listed above it, half below.
- Days to contract.
- The middle number of days between a home being listed and going under contract, over the last 90 days of closings. It is not days-to-close, and it is not how long today's listings have been sitting. Newly built homes are excluded, because a build finishing is not a market moving.
- For sale.
- Homes listed as active right now. A live count, not a monthly average.
- Coming soon.
- Homes announced but not yet accepting showings. A live count.
- Under contract.
- Homes with an accepted contract that have not closed yet. A live count.
Nearby ZIP codes
| Place | Median list |
|---|---|
| 64055 | $235,000 |
| 64056 | $349,000 |
| 64057 | $339,900 |
| 64058 | $227,250 |
| 64050 | $200,000 |
| 64053 | $135,000 |
How we compute these
- Market.
- Market type is set by months of supply — how long it would take to sell every home for sale at the current pace. Under ~4 months favors sellers (low inventory, faster sales, homes near or above asking); over ~6 favors buyers (more choice, more negotiating room). 4–6 is balanced.
- Months supply.
- How many months it would take to sell every home now for sale at the pace of the last 90 days: homes for sale ÷ (closings in the last 90 days ÷ 3).
- Median list.
- The middle asking price among the homes for sale right now. Half are listed above it, half below.
- Days to contract.
- The middle number of days between a home being listed and going under contract, over the last 90 days of closings. It is not days-to-close, and it is not how long today's listings have been sitting. Newly built homes are excluded, because a build finishing is not a market moving.
- For sale.
- Homes listed as active right now. A live count, not a monthly average.
- Coming soon.
- Homes announced but not yet accepting showings. A live count.
- Under contract.
- Homes with an accepted contract that have not closed yet. A live count.
Search homes for sale in every city we cover
How we compute these
- Market.
- Market type is set by months of supply — how long it would take to sell every home for sale at the current pace. Under ~4 months favors sellers (low inventory, faster sales, homes near or above asking); over ~6 favors buyers (more choice, more negotiating room). 4–6 is balanced.
- Months supply.
- How many months it would take to sell every home now for sale at the pace of the last 90 days: homes for sale ÷ (closings in the last 90 days ÷ 3).
- Median list.
- The middle asking price among the homes for sale right now. Half are listed above it, half below.
- Days to contract.
- The middle number of days between a home being listed and going under contract, over the last 90 days of closings. It is not days-to-close, and it is not how long today's listings have been sitting. Newly built homes are excluded, because a build finishing is not a market moving.
- For sale.
- Homes listed as active right now. A live count, not a monthly average.
- Coming soon.
- Homes announced but not yet accepting showings. A live count.
- Under contract.
- Homes with an accepted contract that have not closed yet. A live count.
Search for homes in popular markets
| Market | For sale |
|---|---|
| Heritage Ranch | 29 |
| Canyon Lakes | 27 |
| Garrett Ranch | 24 |
| Ruskin Heights | 23 |
| Seven Bridges | 23 |
| Tomahawk Valley | 22 |
How we compute these
- Market.
- Market type is set by months of supply — how long it would take to sell every home for sale at the current pace. Under ~4 months favors sellers (low inventory, faster sales, homes near or above asking); over ~6 favors buyers (more choice, more negotiating room). 4–6 is balanced.
- For sale.
- Homes listed as active right now. A live count, not a monthly average.
Or go wider still county, metro and state
How we compute these
- Market.
- Market type is set by months of supply — how long it would take to sell every home for sale at the current pace. Under ~4 months favors sellers (low inventory, faster sales, homes near or above asking); over ~6 favors buyers (more choice, more negotiating room). 4–6 is balanced.
- Months supply.
- How many months it would take to sell every home now for sale at the pace of the last 90 days: homes for sale ÷ (closings in the last 90 days ÷ 3).
- Median list.
- The middle asking price among the homes for sale right now. Half are listed above it, half below.
- Days to contract.
- The middle number of days between a home being listed and going under contract, over the last 90 days of closings. It is not days-to-close, and it is not how long today's listings have been sitting. Newly built homes are excluded, because a build finishing is not a market moving.
- For sale.
- Homes listed as active right now. A live count, not a monthly average.
- Coming soon.
- Homes announced but not yet accepting showings. A live count.
- Under contract.
- Homes with an accepted contract that have not closed yet. A live count.