
Riverside 64050 Single-Story Homes for Sale
45 homes for sale in 64050 · Sorted by Newest Listed


15928 E Cogan Lane, Independence, MO


817 W White Oak Street, Independence, MO


15309 E Mayes Road, Independence, MO


2015 S Lees Summit Road, Independence, MO


225 W Moore Street, Independence, MO


1604 N Emery Street, Independence, MO


431 N Eubank Street, Independence, MO


1125 S DODGION Avenue, Independence, MO


810 N Grand Avenue, Independence, MO


521 N Osage Street, Independence, MO


12720 E Silver Lane, Sugar Creek, MO

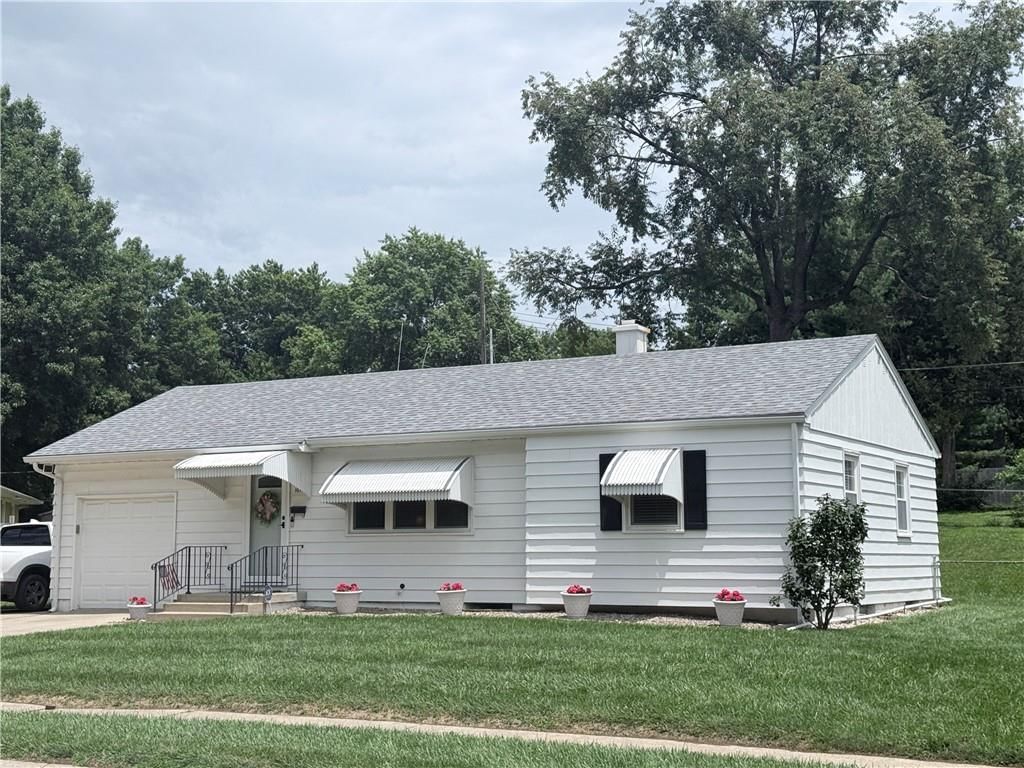
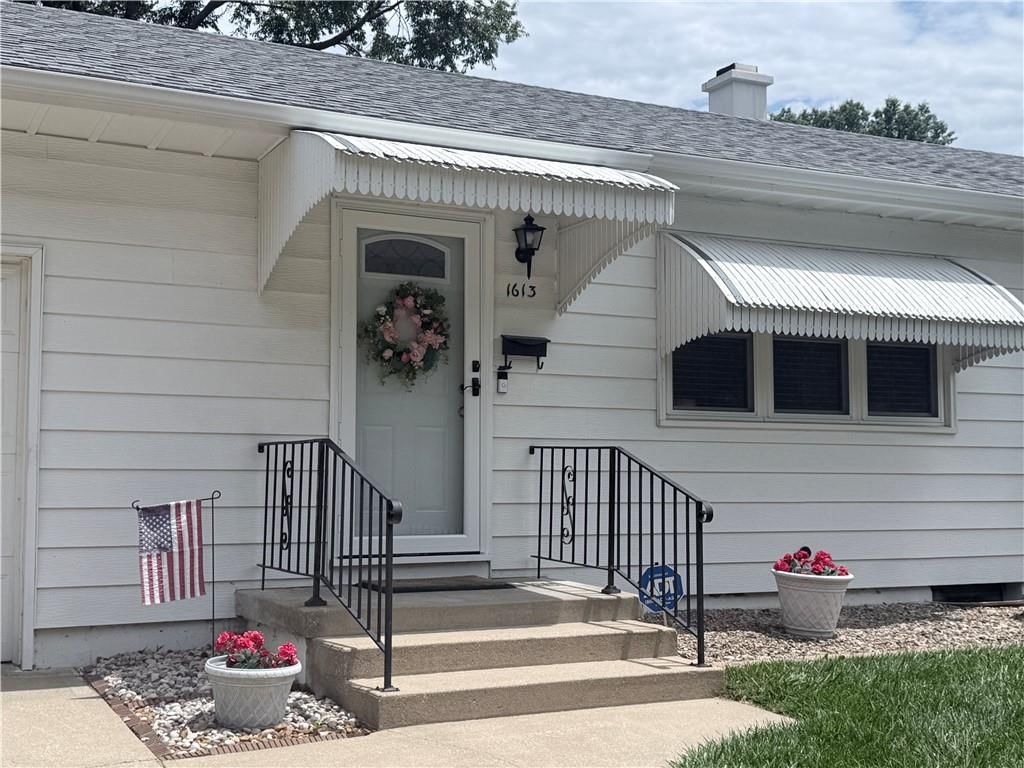
1613 N Mccoy Street, Independence, MO

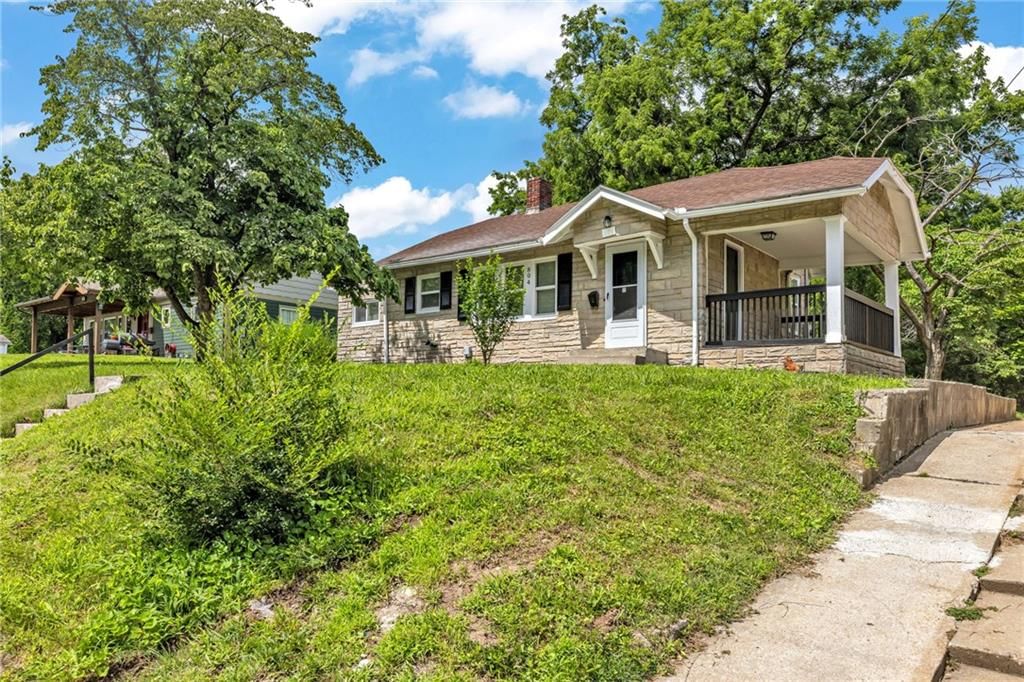
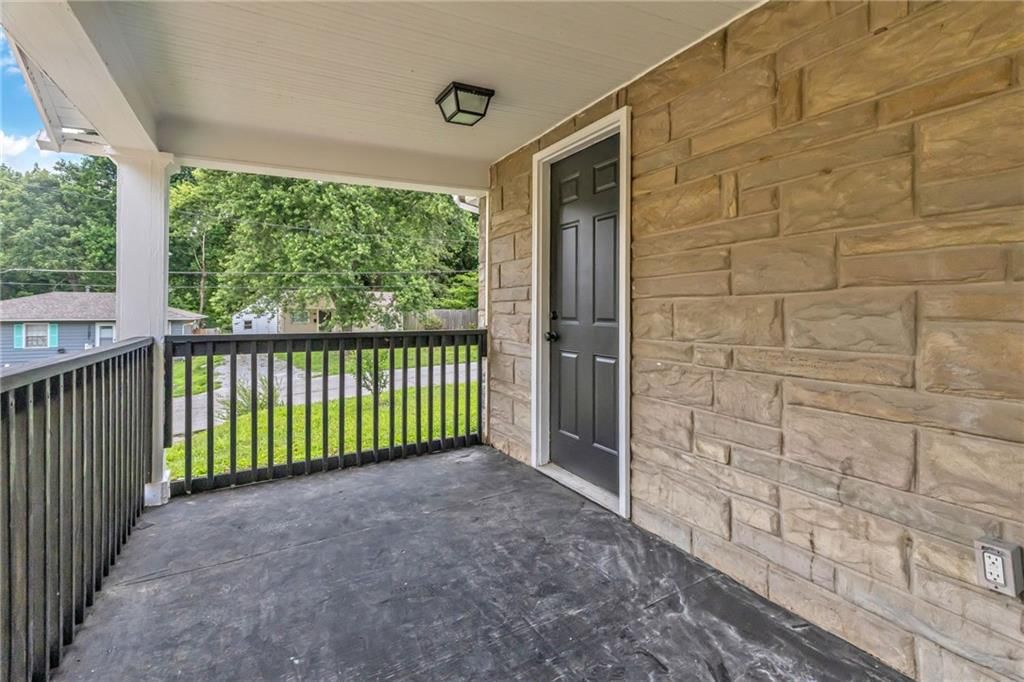
804 N Grand Avenue, Independence, MO


12709 E Silver Lane, Sugar Creek, MO


2402 N Liberty Street, Independence, MO


1239 W South Street, Independence, MO


930 E Stone Street, Independence, MO
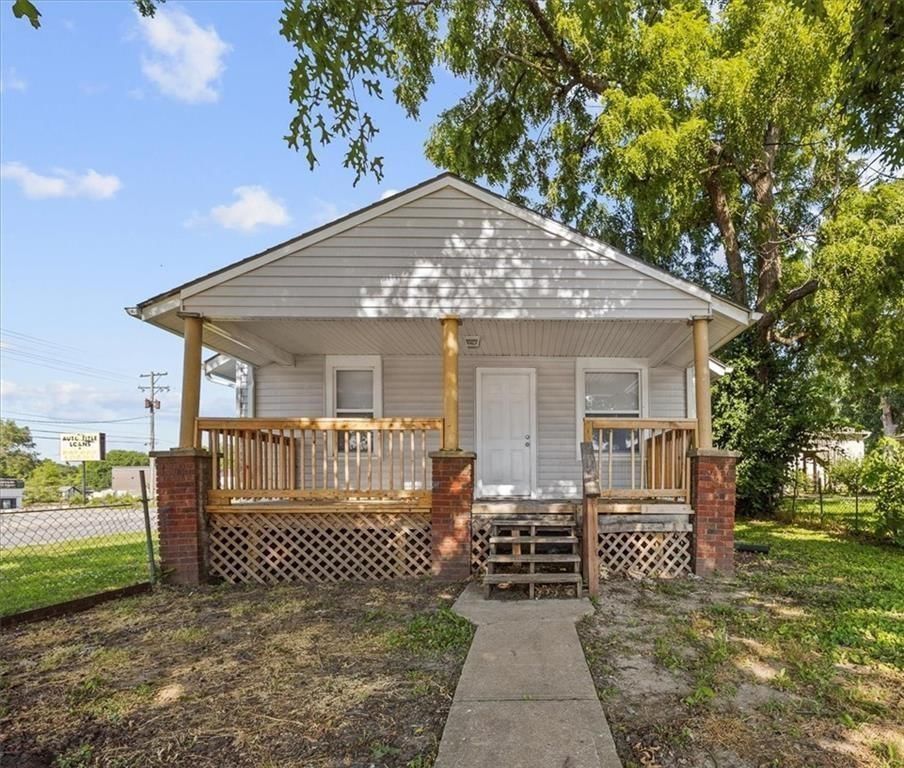


1116 S Woodland Avenue, Independence, MO
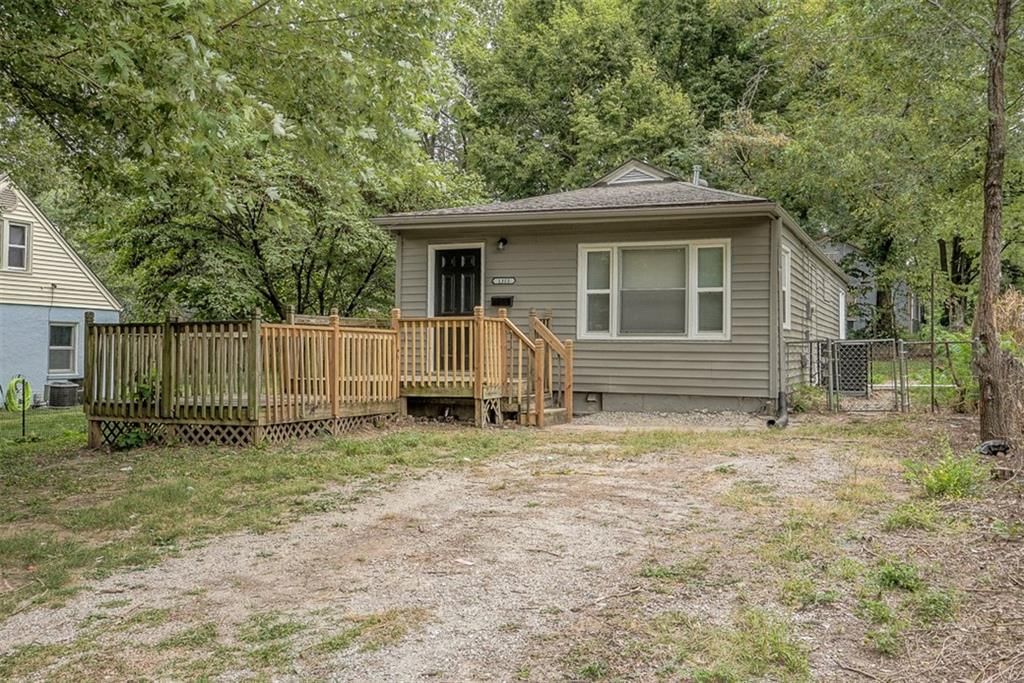
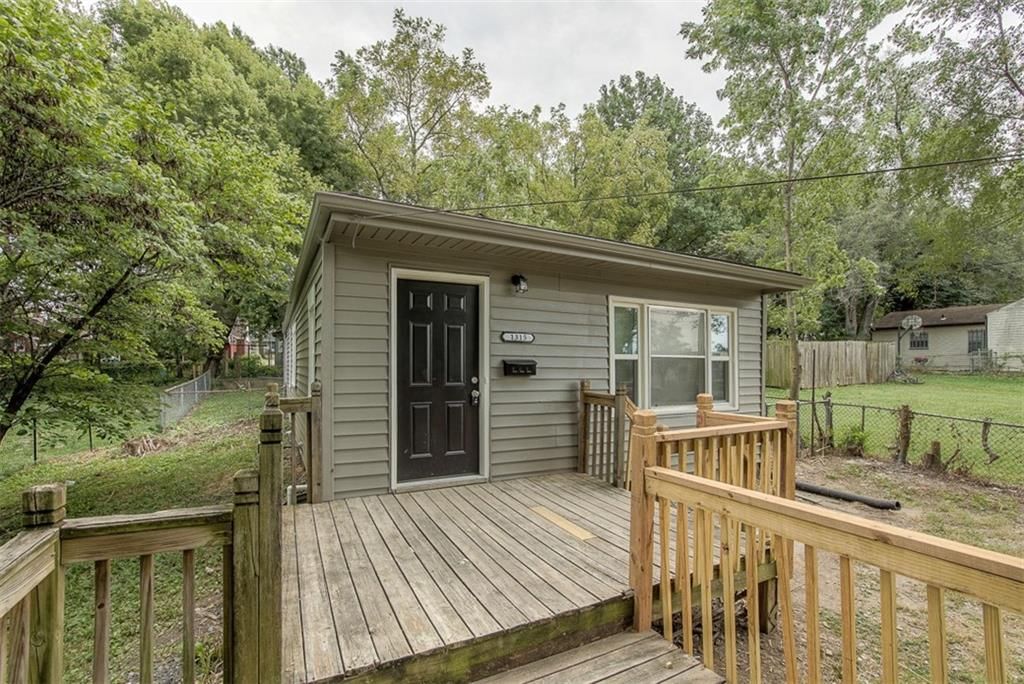

1315 N Mccoy Street, Independence, MO


1512 W College Street, Independence, MO


822 Dickinson Road, Independence, MO
About Single-Story Homes in Riverside 64050
Riverside 64050 has 45 single-story homes for sale right now, with a median list price of $200,000 as of Sep 22 These single-story homes were built between 1900 and 2024, ranging from 360 to 3,750 square feet.
Single-Story Homes market trends Riverside 64050
Riverside 64050: 81 homes for sale · 6 new in the last 7 days · median asking $195,000 · 37 price reductions · a median of 18 days to contract. 24 homes closed in the last 30 days, at a median of $192,000. At the pace of the last 90 days that is 3.63 months of supply.
Single-Story Homes FAQs Riverside 64050
How many single-story homes are for sale in Riverside 64050?
What is the median list price of single-story homes in Riverside 64050?
Schools serving 64050
| School | Median list | |
|---|---|---|
| School districts | ||
| Independence School District | Median— | |
| High schools | ||
| William Chrisman | Median— | |
| Middle schools | ||
| Bingham | Median— | |
| Bridger | Median— | |
| Middle School Complx | Median— | |
| Elementary schools | ||
| Bryant | Median— | |
| Mill Creek | Median— | |
| Ott | Median— | |
| Santa Fe Trails | Median— | |
| Thomas Hart Benton | Median— | |
How we compute these
- Median list.
- The middle asking price among the homes for sale right now. Half are listed above it, half below.
- For sale.
- Homes listed as active right now. A live count, not a monthly average.
Newly listed in 64050
| Address | Price |
|---|---|
| 902 W Maple Avenue | Price$350,000 |
| 3901 N Delaware Street | Price$200,000 |
| 610 W Maple Avenue | Price$350,000 |
| 1405 N McCoy Street | Price$255,000 |
| 1010-1012 S Osage Street | Price$310,000 |
| 1129 S Dodgion Avenue | Price$239,999 |
Recently went under contract in 64050
| Address | List price |
|---|---|
| 1503 N Hocker Avenue | List price$200,000 |
| 704 E Hayward Avenue | List price$169,900 |
| 912 S Osage Street | List price$115,900 |
| 1201 N River Boulevard | List price$239,000 |
| 609 N Sunset Drive | List price$214,900 |
| 405 N Rogers Street | List price$120,000 |
| 531 E College Street | List price$199,000 |
| 1502 Broadway Street | List price$165,000 |
| 1729 N McCoy Street | List price$150,000 |
| 1724 S Trail Ridge Drive | List price$274,500 |
| 216 S Hunter Street | List price$139,900 |
| 1711 N Hocker Street | List price$220,000 |
How we compute these
- Under contract.
- Homes with an accepted contract that have not closed yet. A live count.
- Days to contract.
- The middle number of days between a home being listed and going under contract, over the last 90 days of closings. It is not days-to-close, and it is not how long today's listings have been sitting. Newly built homes are excluded, because a build finishing is not a market moving.
Homes by feature in 64050
| Feature | For sale |
|---|---|
| No HOA | 82 |
| Homes with public water | For sale72 |
| Homes with a public sewer | For sale67 |
| Built before 1960 | 46 |
| Under 1/4 acre | 46 |
| Single story | 45 |
| Two or more stories | For sale40 |
| 2+ full bathrooms | 39 |
| Under 1,500 sq ft | 34 |
| Homes with a city lot | For sale24 |
| 3 bedrooms | 23 |
| Homes with an attached garage | For sale23 |
How we compute these
- For sale.
- Homes listed as active right now. A live count, not a monthly average.
Nearby neighborhoods to Riverside
| Neighborhood | Median sale |
|---|---|
| Montebella | $745,300 |
| The Palisades | $1,250,000 |
| BELLA RIDGE | $719,540 |
| Northwood Heights | $270,000 |
How we compute these
- Market.
- Market type is set by months of supply — how long it would take to sell every home for sale at the current pace. Under ~4 months favors sellers (low inventory, faster sales, homes near or above asking); over ~6 favors buyers (more choice, more negotiating room). 4–6 is balanced.
- Months supply.
- How many months it would take to sell every home now for sale at the pace of the last 90 days: homes for sale ÷ (closings in the last 90 days ÷ 3).
- For sale.
- Homes listed as active right now. A live count, not a monthly average.
- Days to contract.
- The middle number of days between a home being listed and going under contract, over the last 90 days of closings. It is not days-to-close, and it is not how long today's listings have been sitting. Newly built homes are excluded, because a build finishing is not a market moving.
- Coming soon.
- Homes announced but not yet accepting showings. A live count.
- Under contract.
- Homes with an accepted contract that have not closed yet. A live count.
Search homes nearby 64050
| Place | Median list |
|---|---|
| Riverside | $752,000 |
| Kansas City | $265,000 |
| Parkville | $597,000 |
| Platte City | $574,950 |
| Weston | $430,000 |
| Weatherby Lake | $675,000 |
How we compute these
- Market.
- Market type is set by months of supply — how long it would take to sell every home for sale at the current pace. Under ~4 months favors sellers (low inventory, faster sales, homes near or above asking); over ~6 favors buyers (more choice, more negotiating room). 4–6 is balanced.
- Months supply.
- How many months it would take to sell every home now for sale at the pace of the last 90 days: homes for sale ÷ (closings in the last 90 days ÷ 3).
- Median list.
- The middle asking price among the homes for sale right now. Half are listed above it, half below.
- Days to contract.
- The middle number of days between a home being listed and going under contract, over the last 90 days of closings. It is not days-to-close, and it is not how long today's listings have been sitting. Newly built homes are excluded, because a build finishing is not a market moving.
- For sale.
- Homes listed as active right now. A live count, not a monthly average.
- Coming soon.
- Homes announced but not yet accepting showings. A live count.
- Under contract.
- Homes with an accepted contract that have not closed yet. A live count.
Nearby ZIP codes
| Place | Median list |
|---|---|
| 64150 | $769,000 |
How we compute these
- Market.
- Market type is set by months of supply — how long it would take to sell every home for sale at the current pace. Under ~4 months favors sellers (low inventory, faster sales, homes near or above asking); over ~6 favors buyers (more choice, more negotiating room). 4–6 is balanced.
- Months supply.
- How many months it would take to sell every home now for sale at the pace of the last 90 days: homes for sale ÷ (closings in the last 90 days ÷ 3).
- Median list.
- The middle asking price among the homes for sale right now. Half are listed above it, half below.
- Days to contract.
- The middle number of days between a home being listed and going under contract, over the last 90 days of closings. It is not days-to-close, and it is not how long today's listings have been sitting. Newly built homes are excluded, because a build finishing is not a market moving.
- For sale.
- Homes listed as active right now. A live count, not a monthly average.
- Coming soon.
- Homes announced but not yet accepting showings. A live count.
- Under contract.
- Homes with an accepted contract that have not closed yet. A live count.
Search homes for sale in every city we cover
How we compute these
- Market.
- Market type is set by months of supply — how long it would take to sell every home for sale at the current pace. Under ~4 months favors sellers (low inventory, faster sales, homes near or above asking); over ~6 favors buyers (more choice, more negotiating room). 4–6 is balanced.
- Months supply.
- How many months it would take to sell every home now for sale at the pace of the last 90 days: homes for sale ÷ (closings in the last 90 days ÷ 3).
- Median list.
- The middle asking price among the homes for sale right now. Half are listed above it, half below.
- Days to contract.
- The middle number of days between a home being listed and going under contract, over the last 90 days of closings. It is not days-to-close, and it is not how long today's listings have been sitting. Newly built homes are excluded, because a build finishing is not a market moving.
- For sale.
- Homes listed as active right now. A live count, not a monthly average.
- Coming soon.
- Homes announced but not yet accepting showings. A live count.
- Under contract.
- Homes with an accepted contract that have not closed yet. A live count.
Search for homes in popular markets
| Market | For sale |
|---|---|
| Heritage Ranch | 29 |
| Ruskin Heights | 26 |
| Canyon Lakes | 25 |
| Garrett Ranch | 24 |
| Seven Bridges | 24 |
| Tomahawk Valley | 23 |
How we compute these
- Market.
- Market type is set by months of supply — how long it would take to sell every home for sale at the current pace. Under ~4 months favors sellers (low inventory, faster sales, homes near or above asking); over ~6 favors buyers (more choice, more negotiating room). 4–6 is balanced.
- For sale.
- Homes listed as active right now. A live count, not a monthly average.
Or go wider still county, metro and state
How we compute these
- Market.
- Market type is set by months of supply — how long it would take to sell every home for sale at the current pace. Under ~4 months favors sellers (low inventory, faster sales, homes near or above asking); over ~6 favors buyers (more choice, more negotiating room). 4–6 is balanced.
- Months supply.
- How many months it would take to sell every home now for sale at the pace of the last 90 days: homes for sale ÷ (closings in the last 90 days ÷ 3).
- Median list.
- The middle asking price among the homes for sale right now. Half are listed above it, half below.
- Days to contract.
- The middle number of days between a home being listed and going under contract, over the last 90 days of closings. It is not days-to-close, and it is not how long today's listings have been sitting. Newly built homes are excluded, because a build finishing is not a market moving.
- For sale.
- Homes listed as active right now. A live count, not a monthly average.
- Coming soon.
- Homes announced but not yet accepting showings. A live count.
- Under contract.
- Homes with an accepted contract that have not closed yet. A live count.