
6601 W 79th Street, Overland Park, KS 66204, photo 4
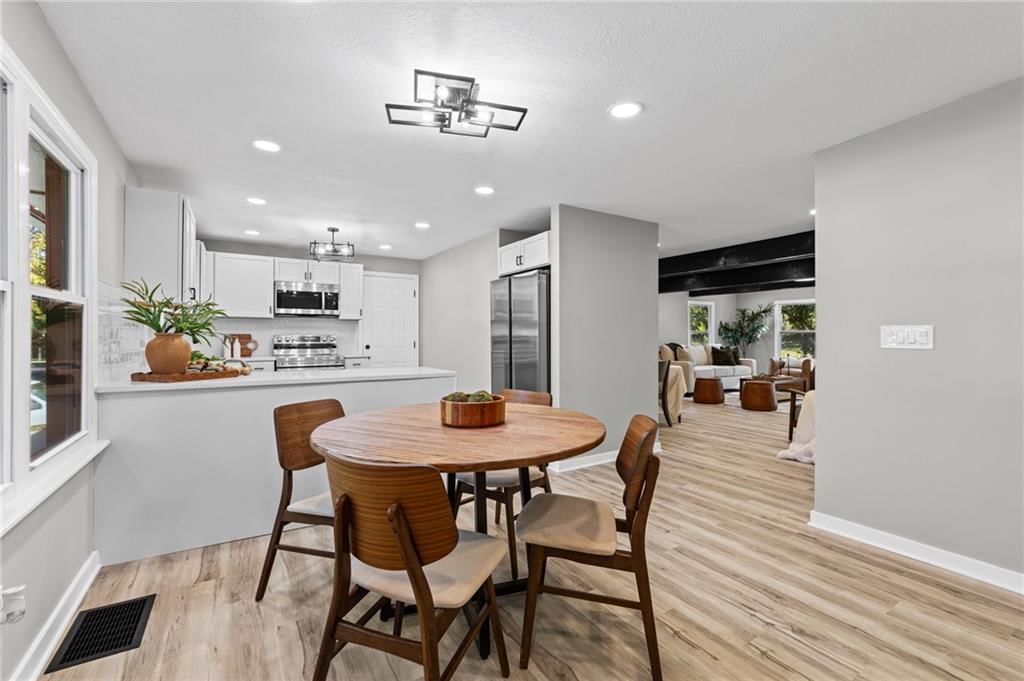 Photo 4
White kitchen cabinets, seen in photo 4
List price $469,000 · 3 beds · 1,384 sqft
7 homes fit this search · Sorted by Newest Listed
Overland Park, KS has about 84,860 households and a median household income of $104,834. Roughly 61% of homes are owner-occupied, the median owner's home value is $413,600, 64% of adults hold a bachelor's degree or higher. The average commute runs 19.7 minutes. About 200,306 people live in Overland Park, KS, per the U.S. Census Bureau's American Community Survey 5-year estimate (2020–2024). New construction is still adding supply: 26 building permits were issued in August 2026.
The honest answer for anyone sizing up Overland Park right now: this is not a panic-buy or panic-sell market. Sellers who price correctly still move product, but the days of throwing any number on a sign and getting five offers by Sunday are largely over. That reset is actually healthy, and for a city this desirable, it means the fundamentals — schools, location, amenities — are doing the heavy lifting again.
The price-per-foot benchmark is one of the most useful gut checks in this market.
The subdivisions worth knowing each have a personality. Wild Horse and Riverstone Valley attract buyers who want newer construction with open floor plans and HOA amenities that actually get used. Chapel Hill and Mission Ranch tend to draw families planting long-term roots — good lot sizes, established trees, and strong resale history. Sundance Ridge and Archers Landing offer that slightly elevated, executive-home feel without crossing into Leawood price territory. Century Farms and Terrybrook Farms are among the newer master-planned communities where buyers are getting fresh builds, though some of those lots are tighter than the price tag might suggest. Southern Meadows rounds out the mix for buyers who want value without sacrificing the Overland Park zip code.
Overland Park runs on Blue Valley and Blue Valley Northwest schools, and that is not an accident — it is the single biggest reason families choose this city over comparable suburbs. The Blue Valley district consistently ranks among the best in Kansas, and buyers paying a premium near the 135th Street corridor or further south toward 167th are often paying specifically for that boundary. Commute-wise, the 69 Highway and I-435 corridors connect residents to downtown Kansas City in 25 to 40 minutes depending on where they land, and the city's internal infrastructure — Town Center, the Promenade, Scheels, a legitimate restaurant scene — means many residents rarely feel the need to leave. It is a suburb that earns its reputation.
Do not ignore those — the stigma is often undeserved. For sellers: correct pricing from day one is everything right now. Overpricing by even 5 percent in this environment leads to the kind of extended market time that makes subsequent buyers wonder what is wrong with the house. Price it sharp, present it well, and the demand for a well-located Overland Park home is absolutely still there.
As of Oct 24, 2026, Overland Park, KS: 498 homes for sale · 50 new in the last 7 days · median asking $725,000 · 157 price reductions · a median of 16 days to contract. 214 homes closed in the last 30 days, at a median of $525,000. At the pace of the last 90 days that is 2.02 months of supply. Inventory is unchanged from four weeks ago.
| Measure | Sep 2026 | Aug 2026 | Sep 2025 |
|---|---|---|---|
| Median sale price | $526,000 | $499,950 | $485,000 |
| Median price per sq ft | $206 | $205 | $196 |
| Median days to contract | 17 | 17 | 16 |
| Sell-to-list ratio | 100% | 100% | 100% |
| Homes sold | 211 | 258 | 166 |
| New listings | 317 | 237 | 230 |
| Went under contract | 223 | 228 | 170 |
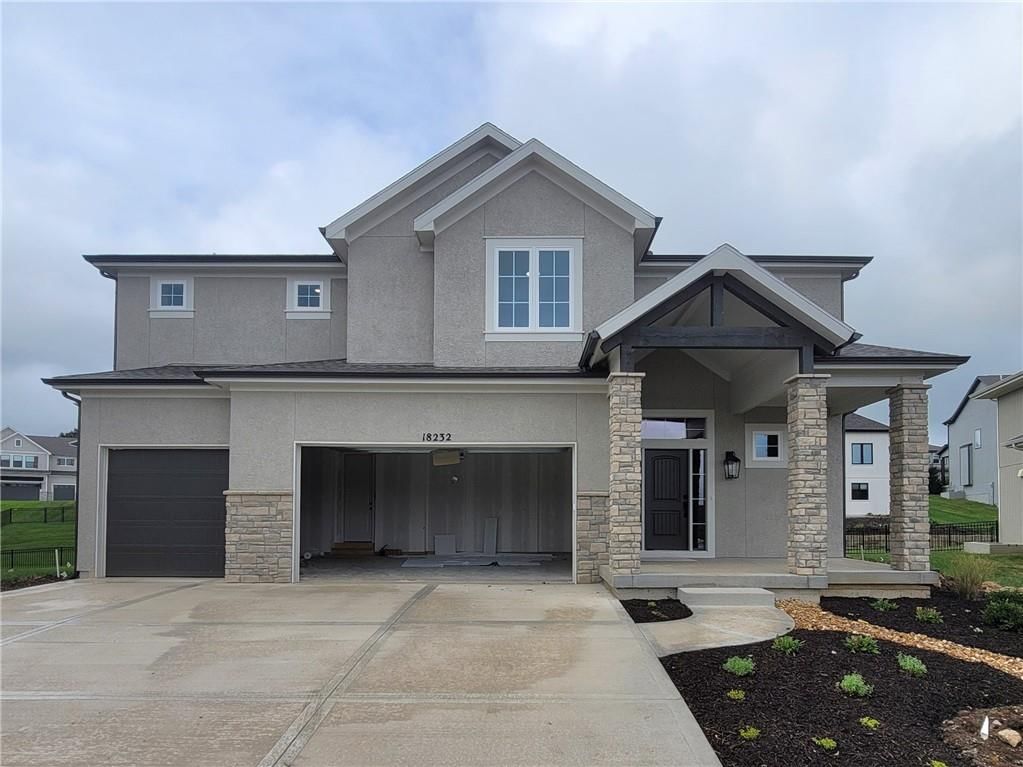
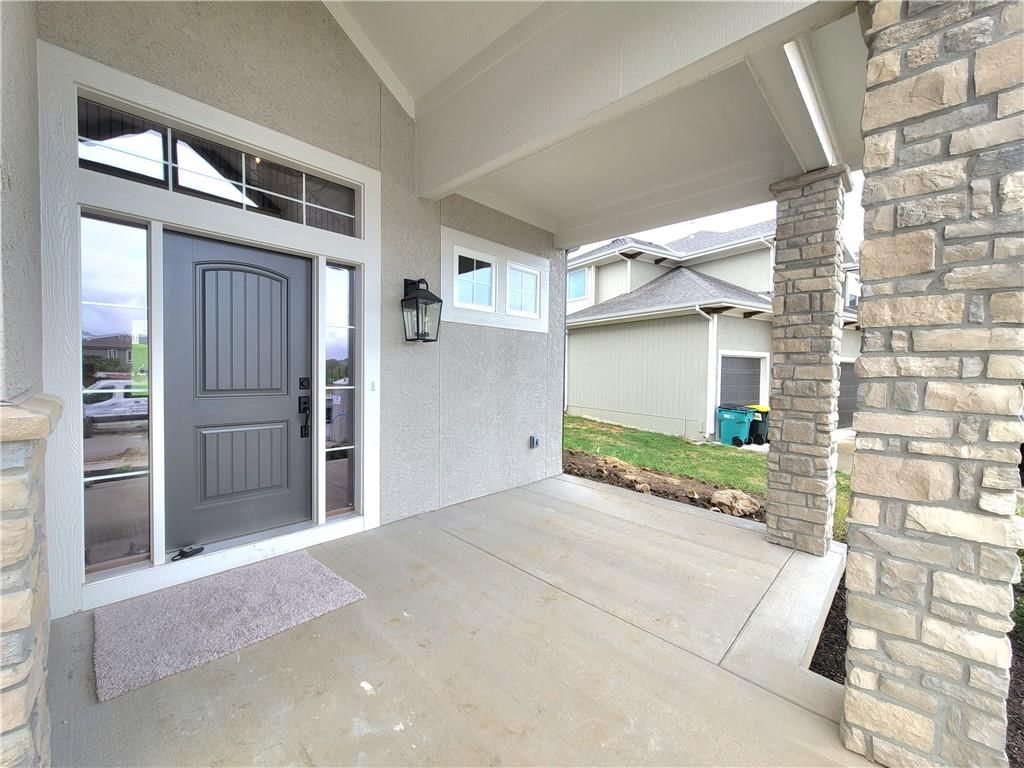
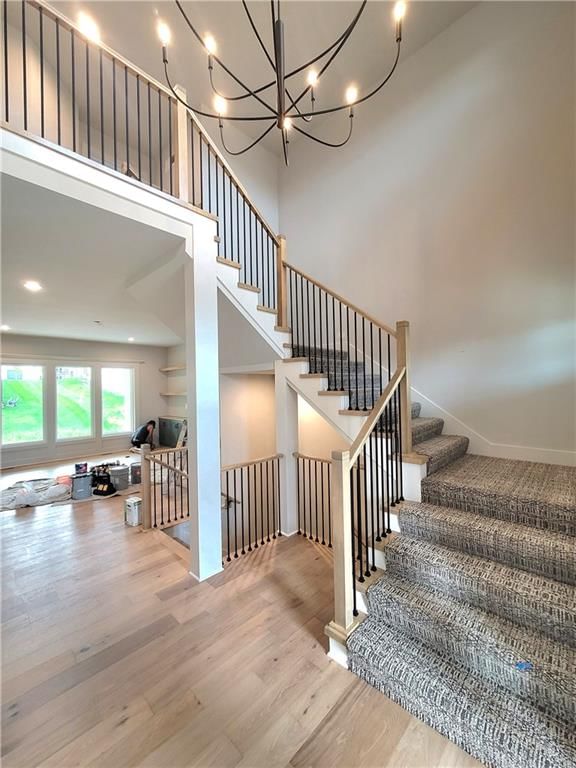
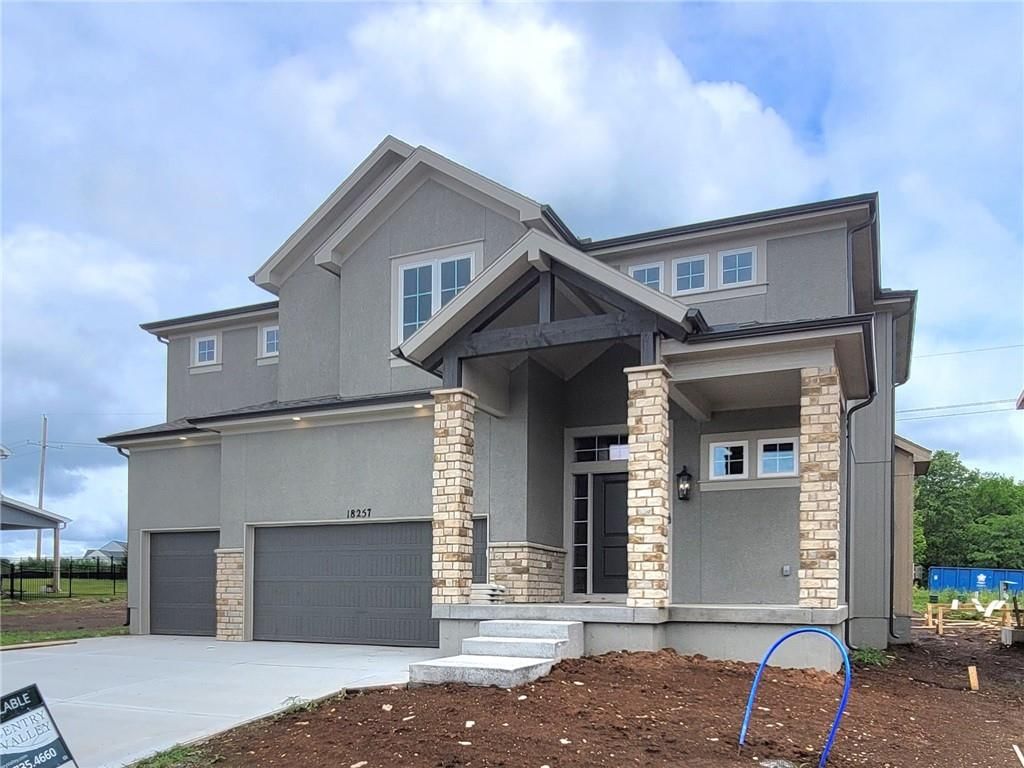
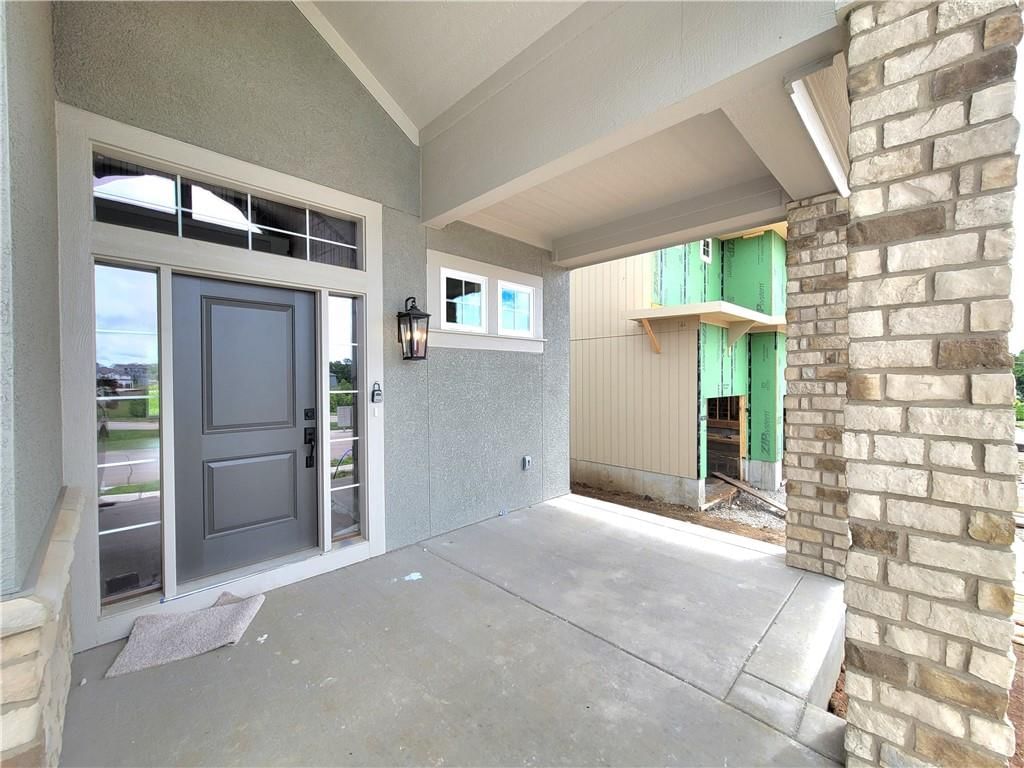
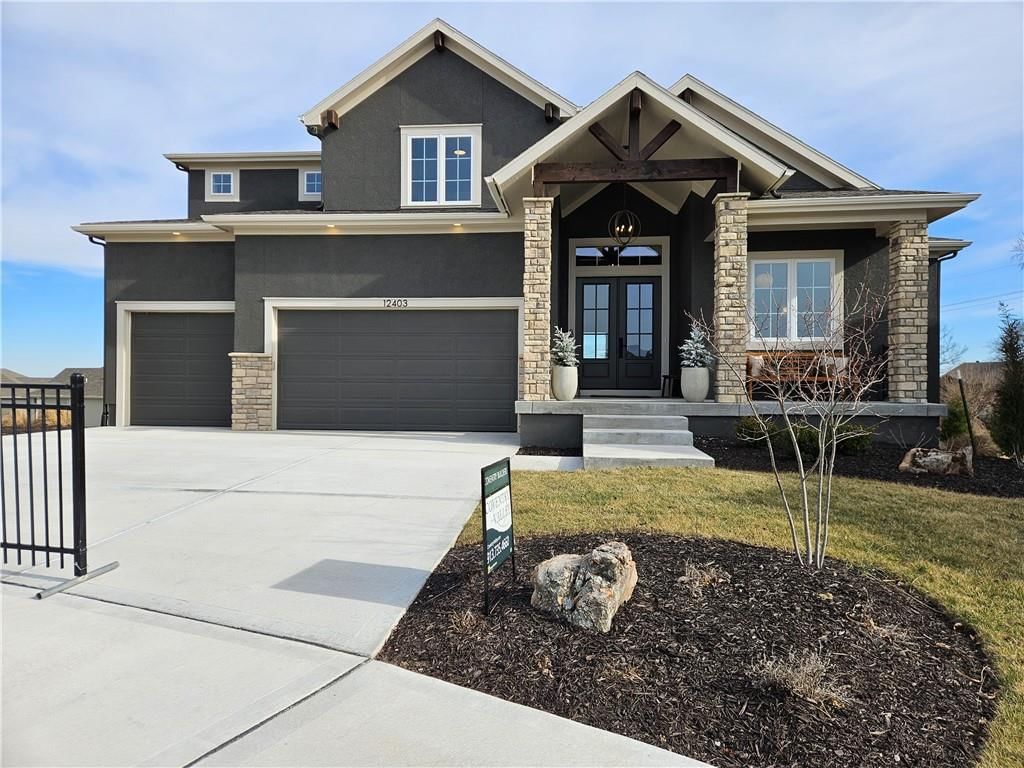
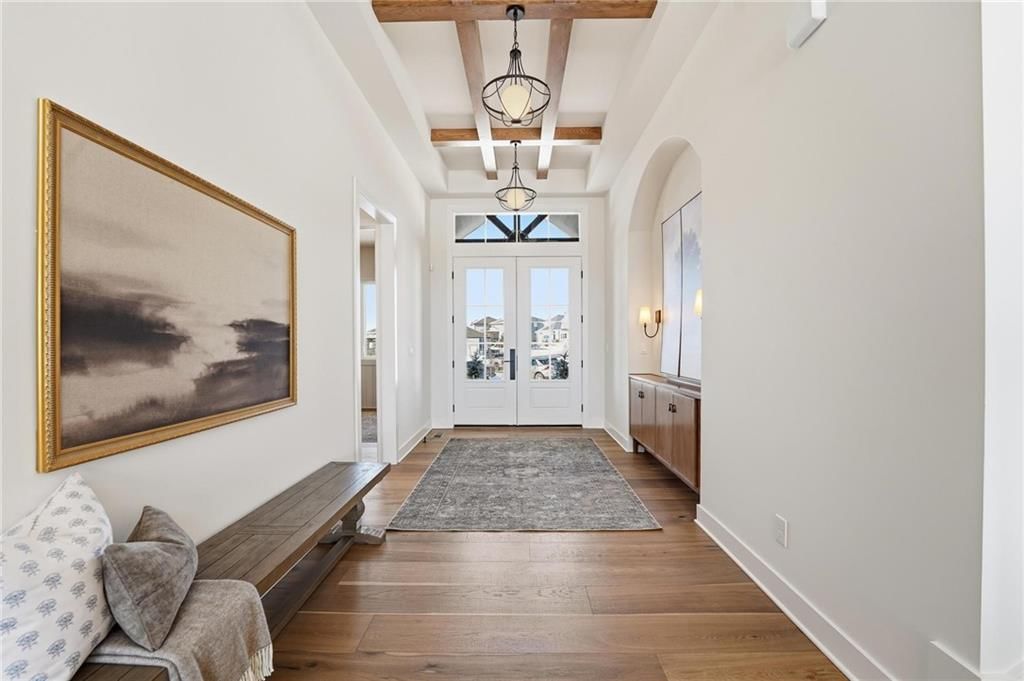
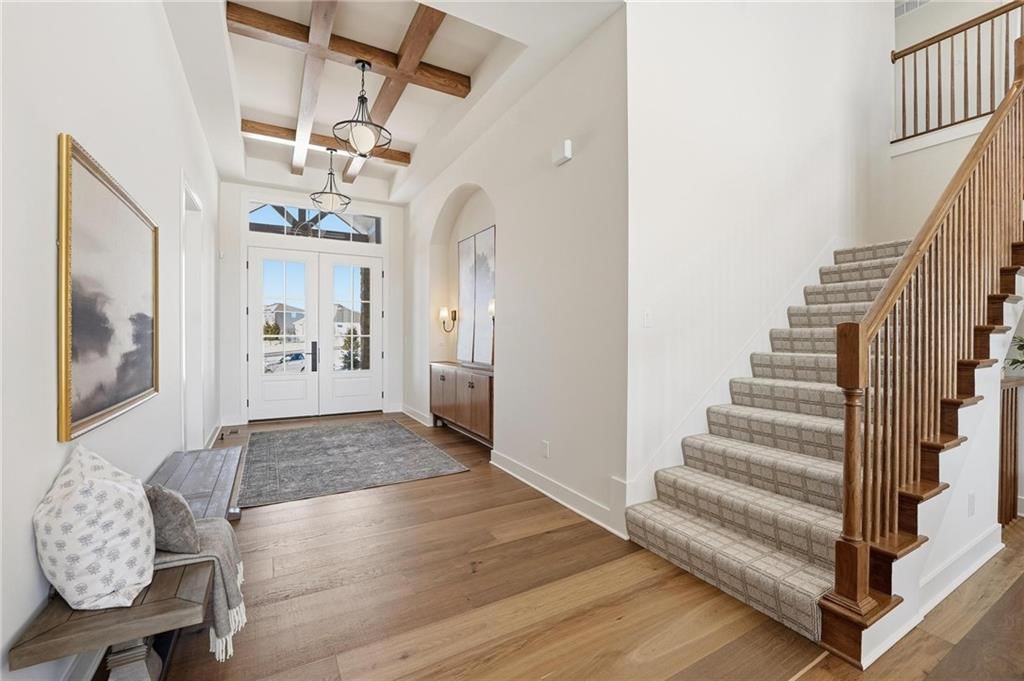
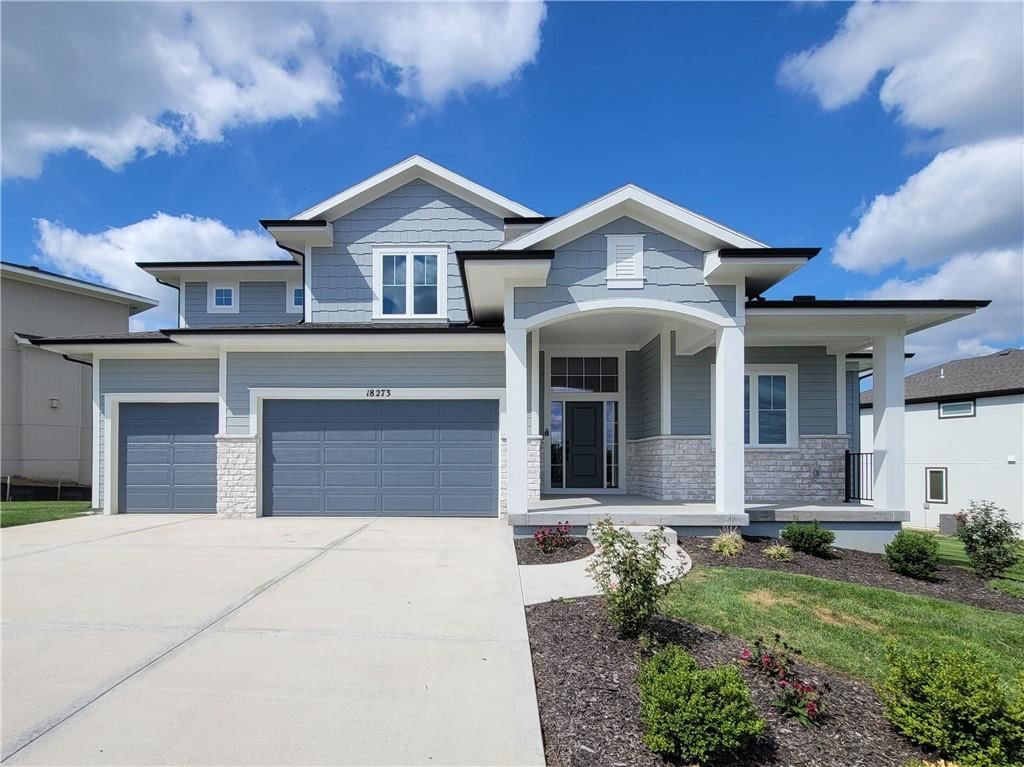


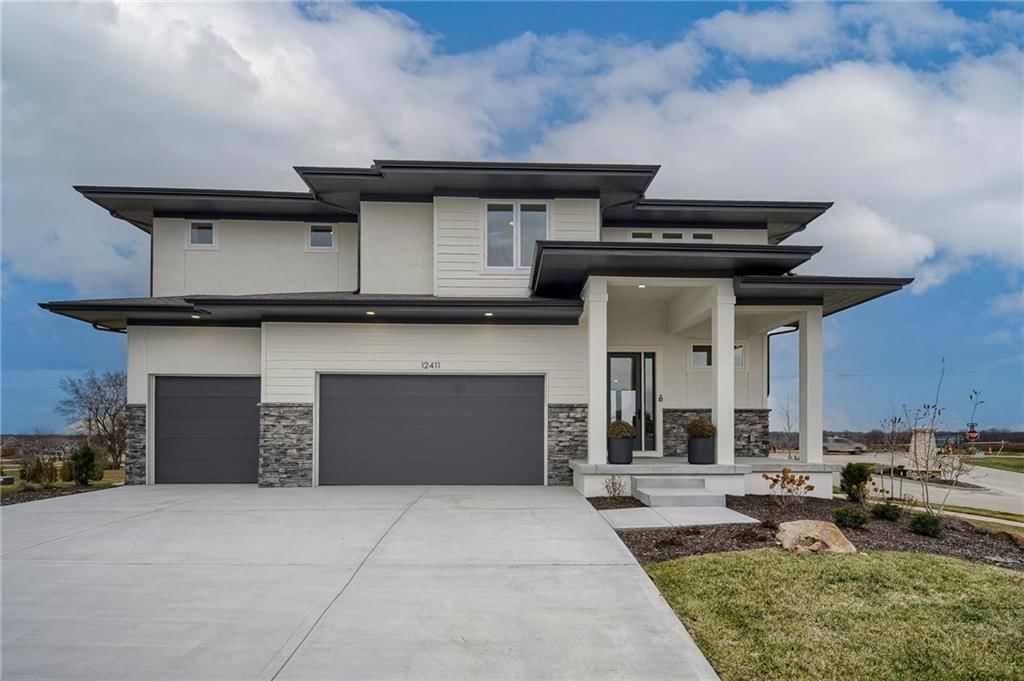
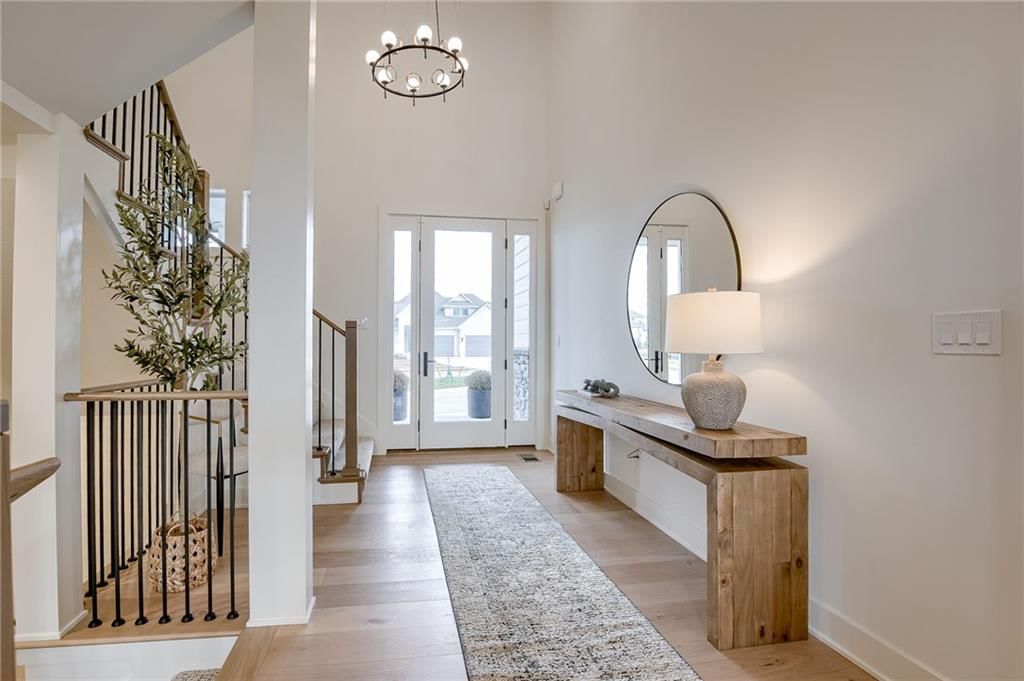
As of Oct 24, 2026
HouseLoop Vision identified 195 homes for sale in Overland Park, KS with white kitchen cabinets, 131 with a freestanding tub, 23 with a pool, 215 with a finished basement, 212 with a fenced yard and 112 with a 3-car garage.
HouseLoop Vision has looked at the photos of 489 of the 498 homes for sale in Overland Park. 9 haven't been looked at yet.
195
of 489 looked at, all 195 seen in the photos
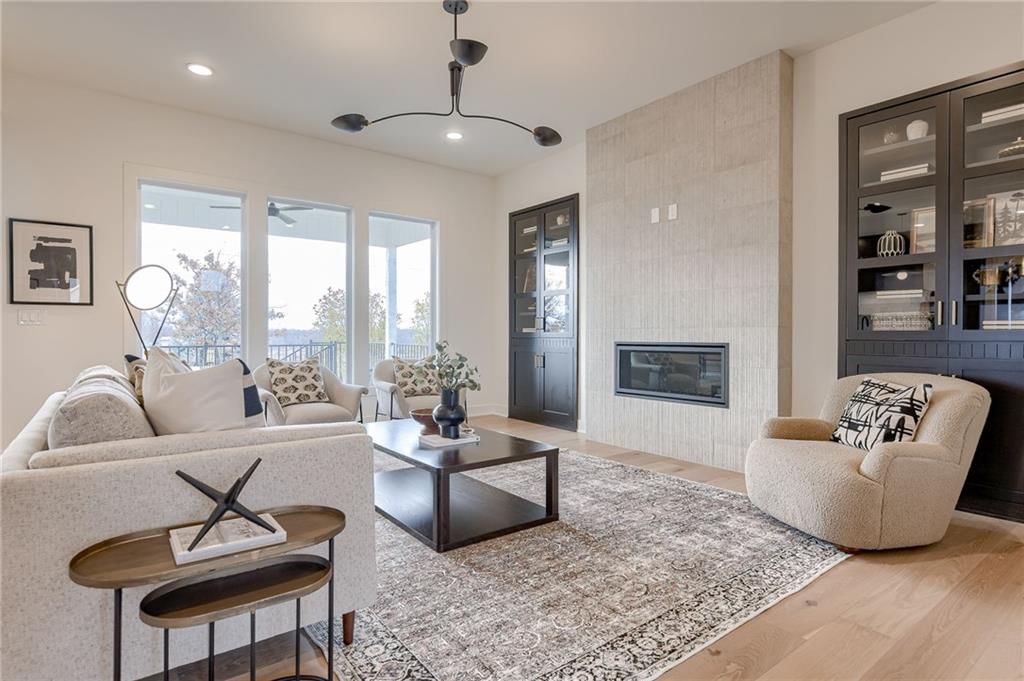
See the 195 homesPhoto 4White kitchen cabinets, seen in photo 4
List price $469,000 · 3 beds · 1,384 sqft
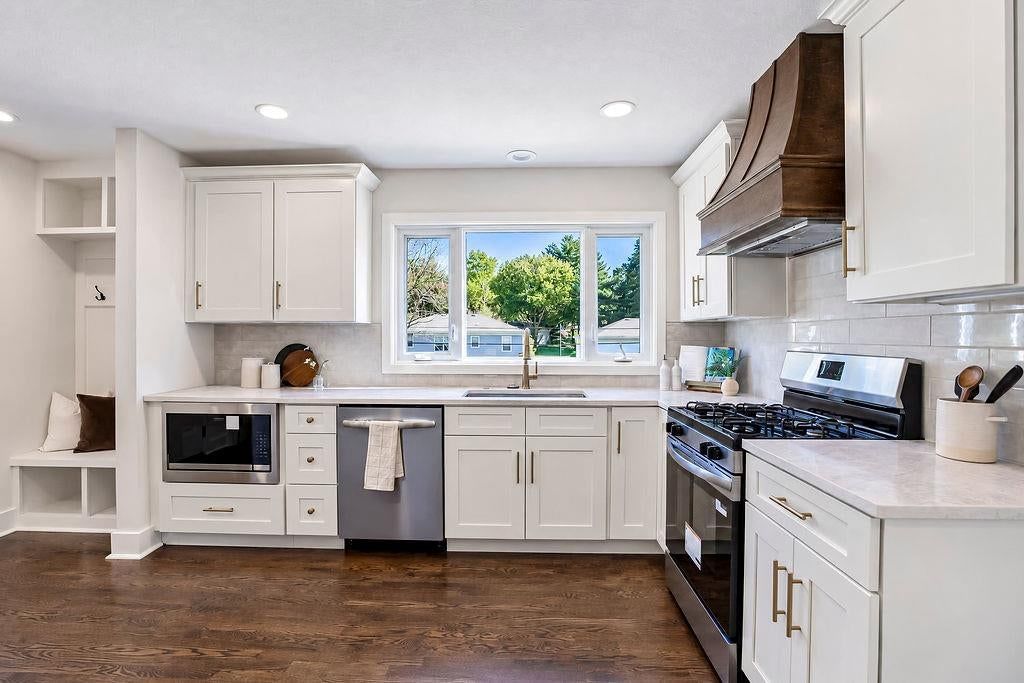 Photo 10
White kitchen cabinets, seen in photo 10
List price $599,950 · 3 beds · 2,619 sqft
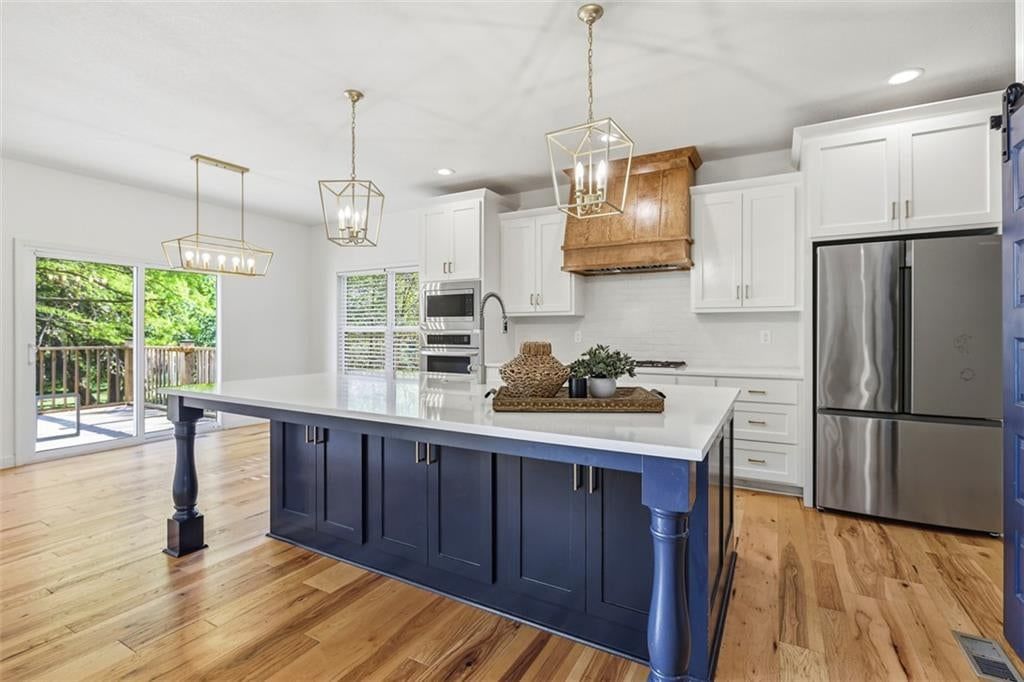 Photo 12
White kitchen cabinets, seen in photo 12
List price $700,000 · 4 beds · 3,029 sqft
131
of 489 looked at, all 131 seen in the photos
See the 131 homes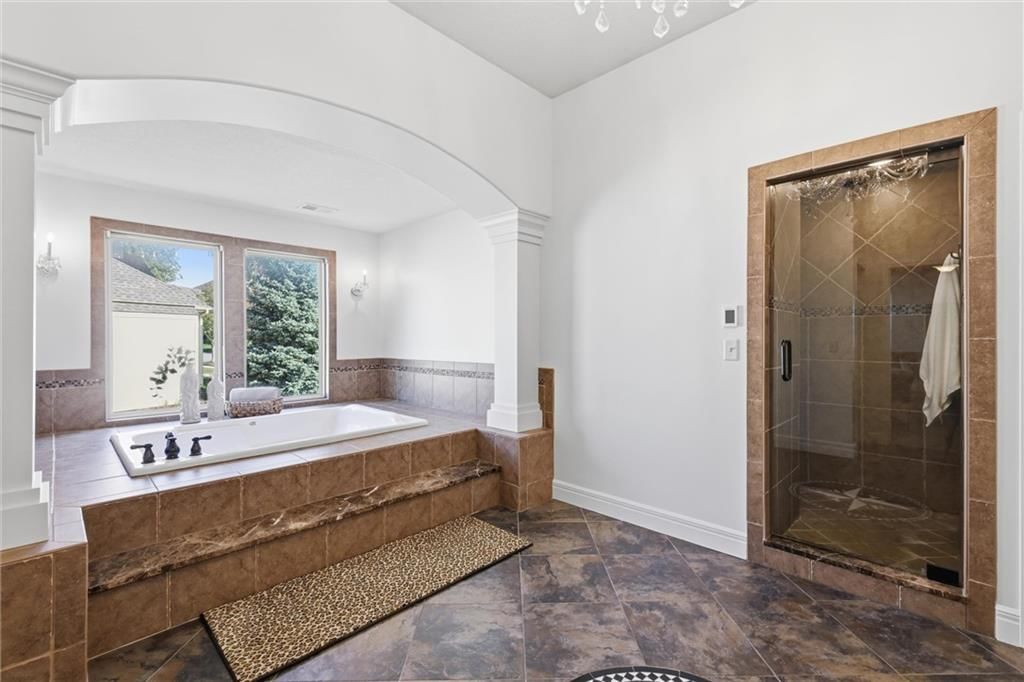 Photo 31
Freestanding tub, seen in photo 31
List price $950,000 · 5 beds · 5,200 sqft
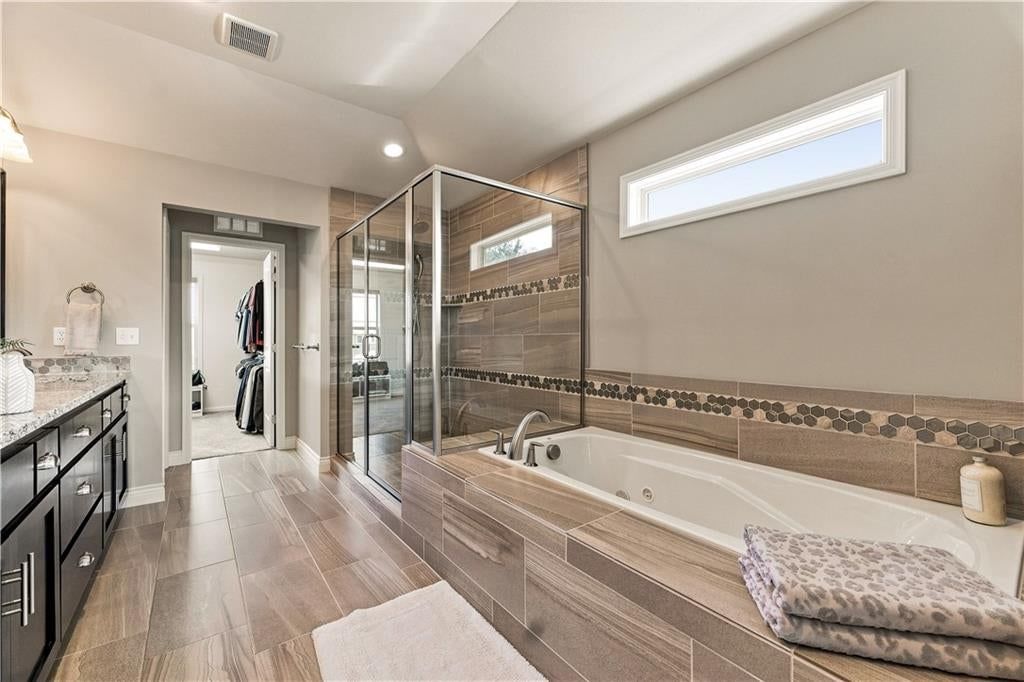 Photo 33
Freestanding tub, seen in photo 33
List price $740,000 · 5 beds · 2,889 sqft
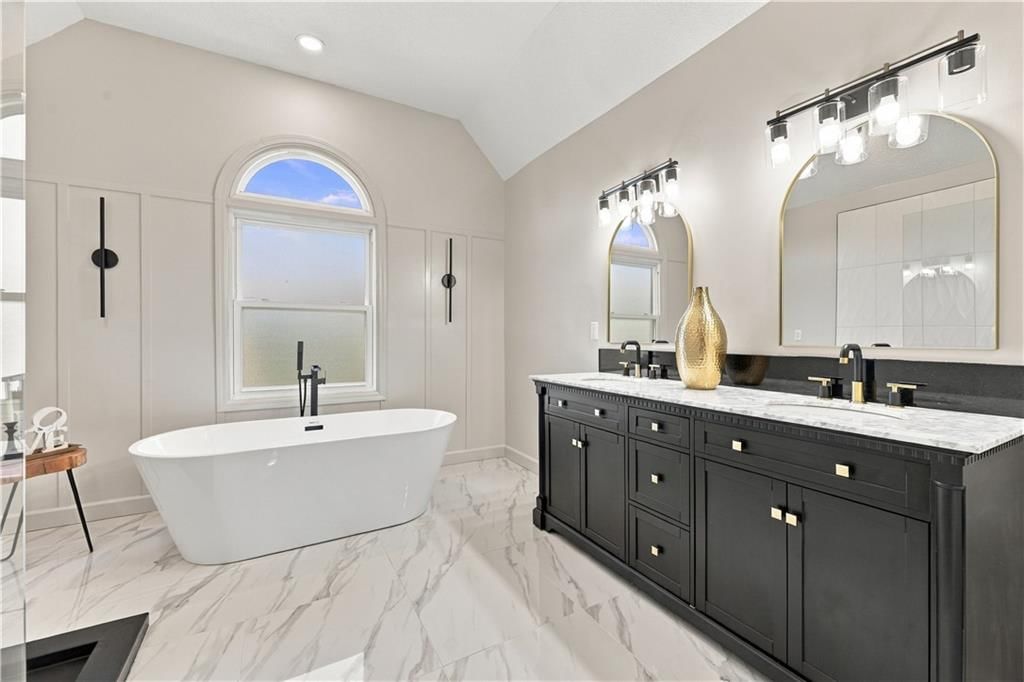 Photo 22
Freestanding tub, seen in photo 22
List price $599,900 · 4 beds · 3,002 sqft
26
of 489 looked at, 23 of them seen in the photos
See the 26 homes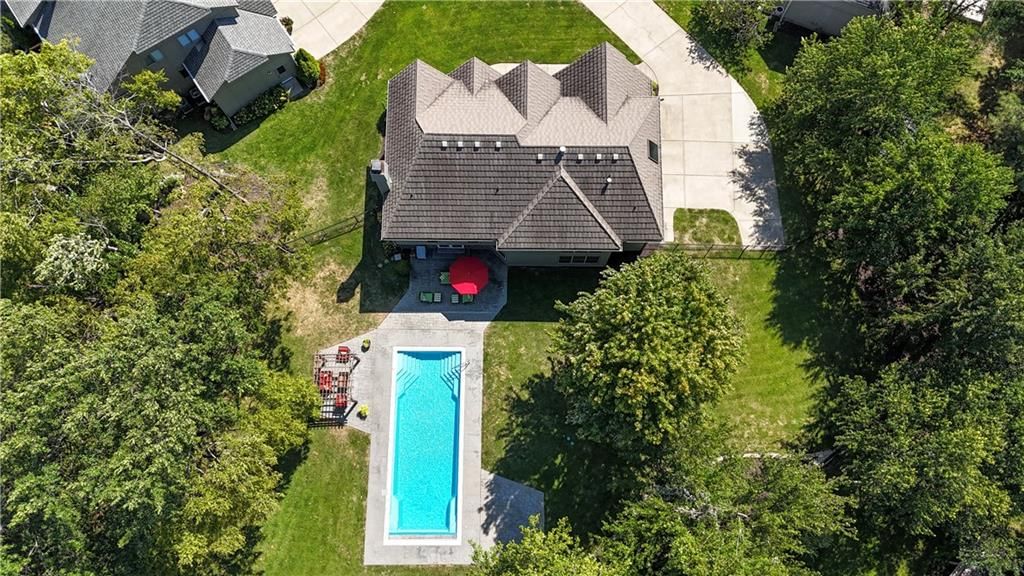 Photo 2
Swimming pool, seen in photo 2
List price $900,000 · 4 beds · 4,565 sqft
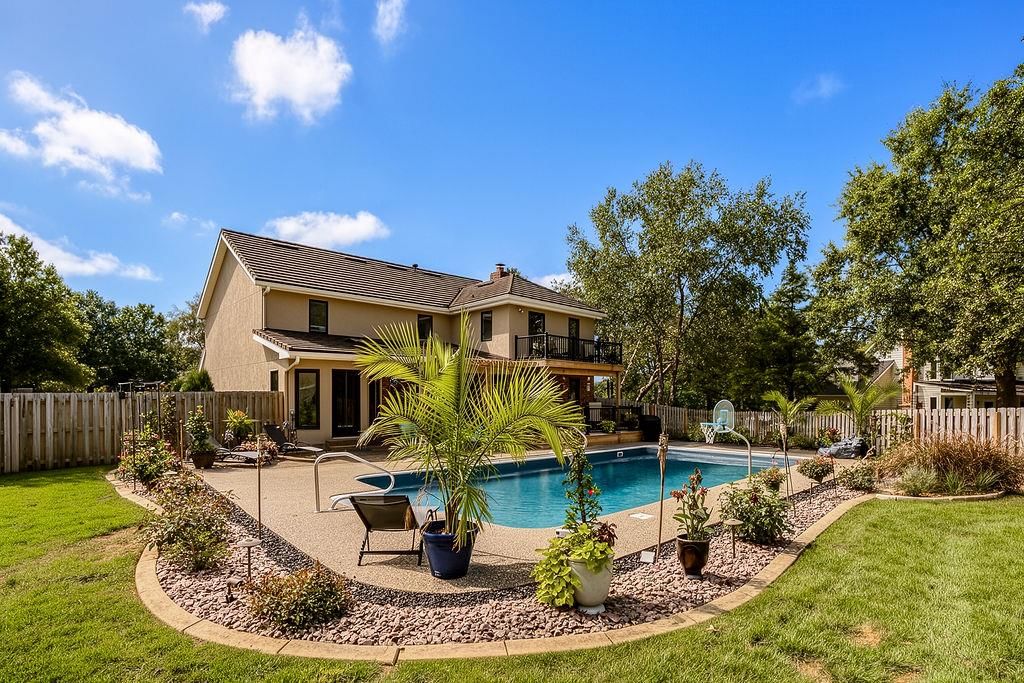 Photo 9
Swimming pool, seen in photo 9
Listed in the MLS
List price $820,000 · 4 beds · 3,217 sqft
301
of 489 looked at, 215 of them seen in the photos
See the 301 homes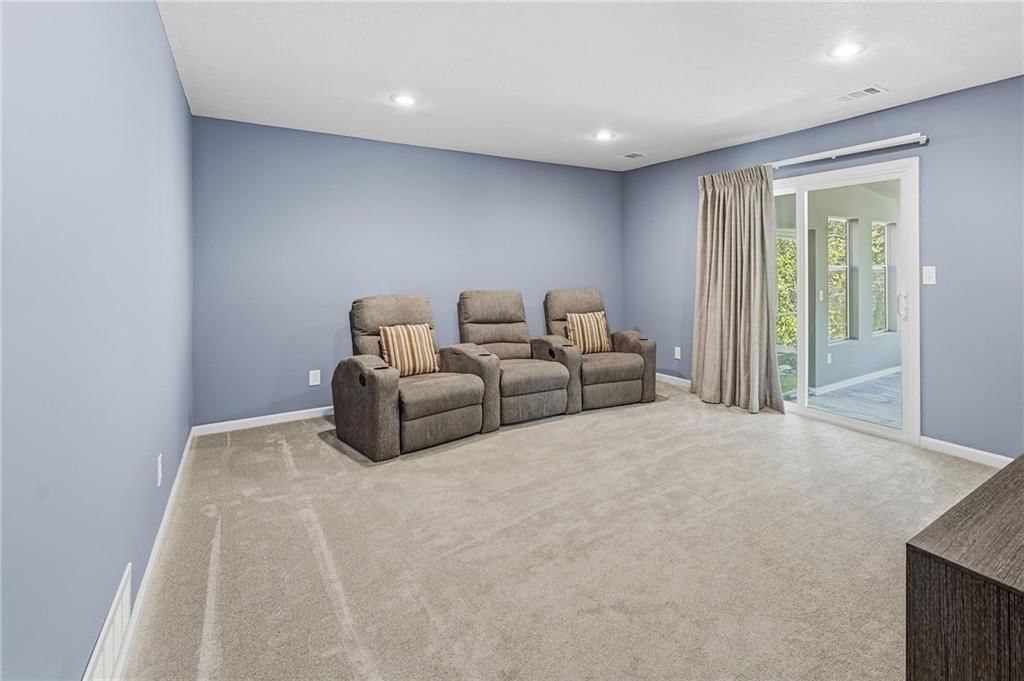 Photo 31
Finished basement, seen in photo 31
Listed in the MLS: Finished
List price $435,000 · 4 beds · 2,100 sqft
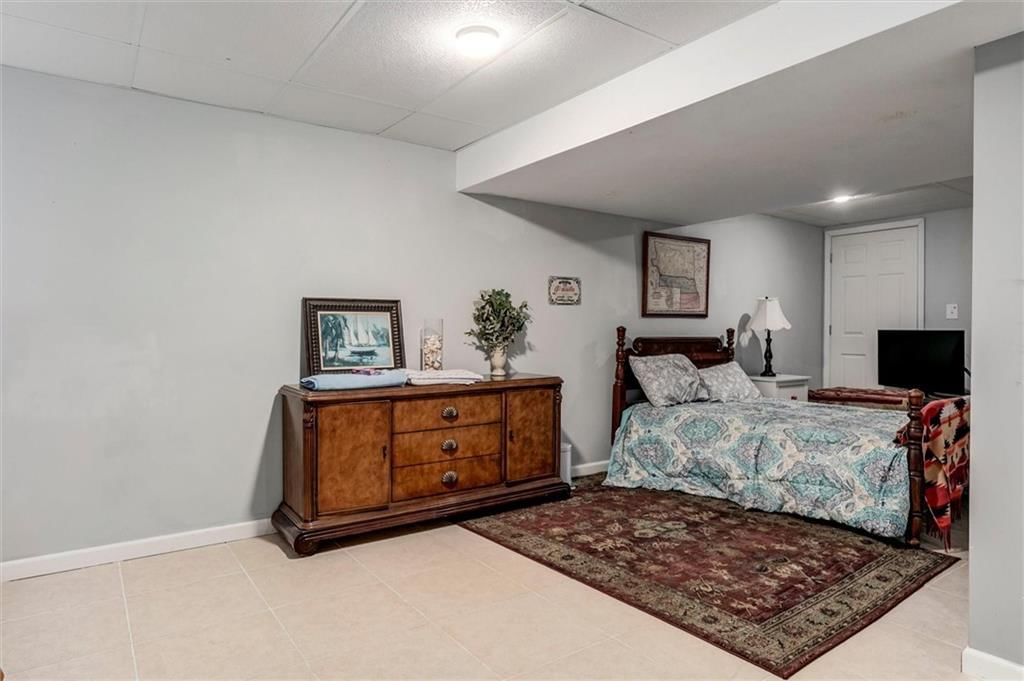 Photo 27
Finished basement, seen in photo 27
Listed in the MLS: Finished
List price $530,000 · 4 beds · 3,398 sqft
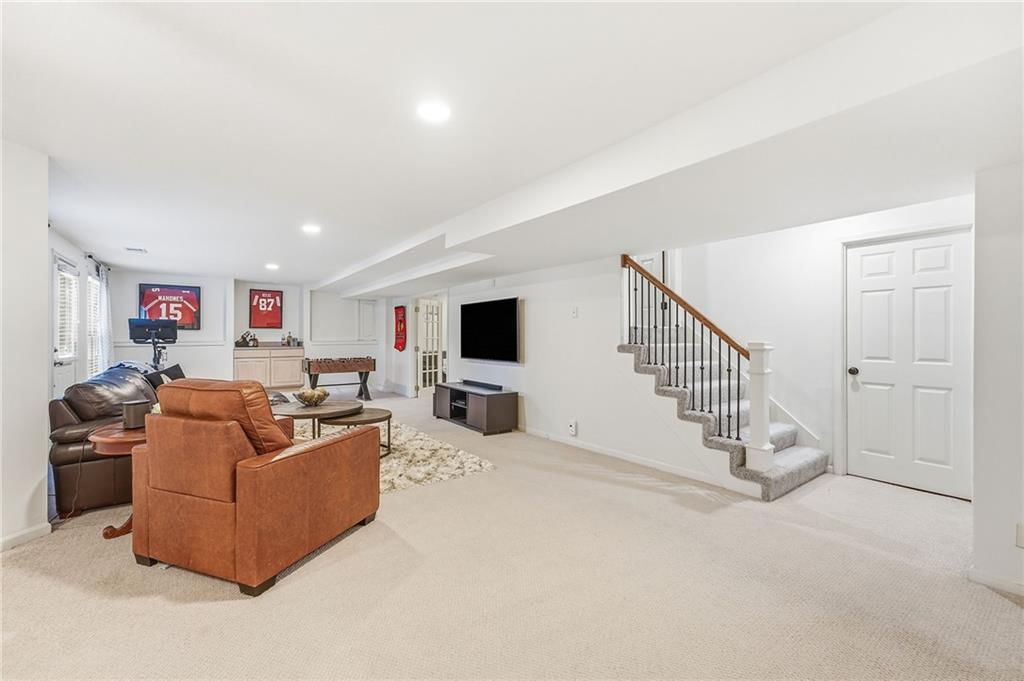 Photo 31
Finished basement, seen in photo 31
Listed in the MLS: Finished
List price $625,000 · 4 beds · 3,525 sqft
248
of 489 looked at, 212 of them seen in the photos
See the 248 homes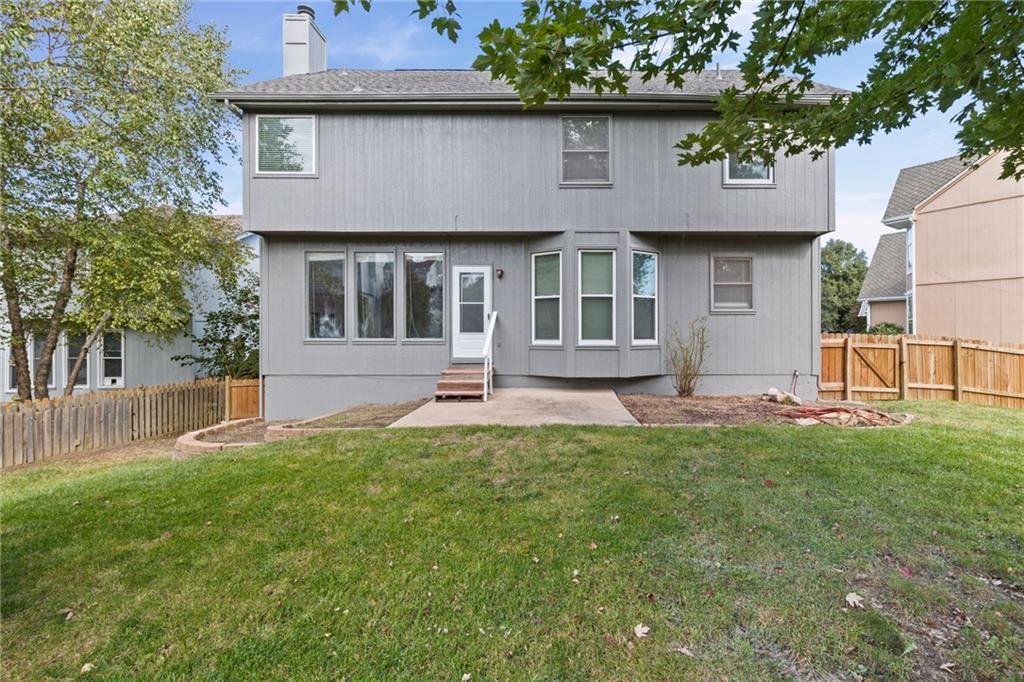 Photo 23
Fenced yard, seen in photo 23
Listed in the MLS
List price $509,000 · 4 beds · 2,106 sqft
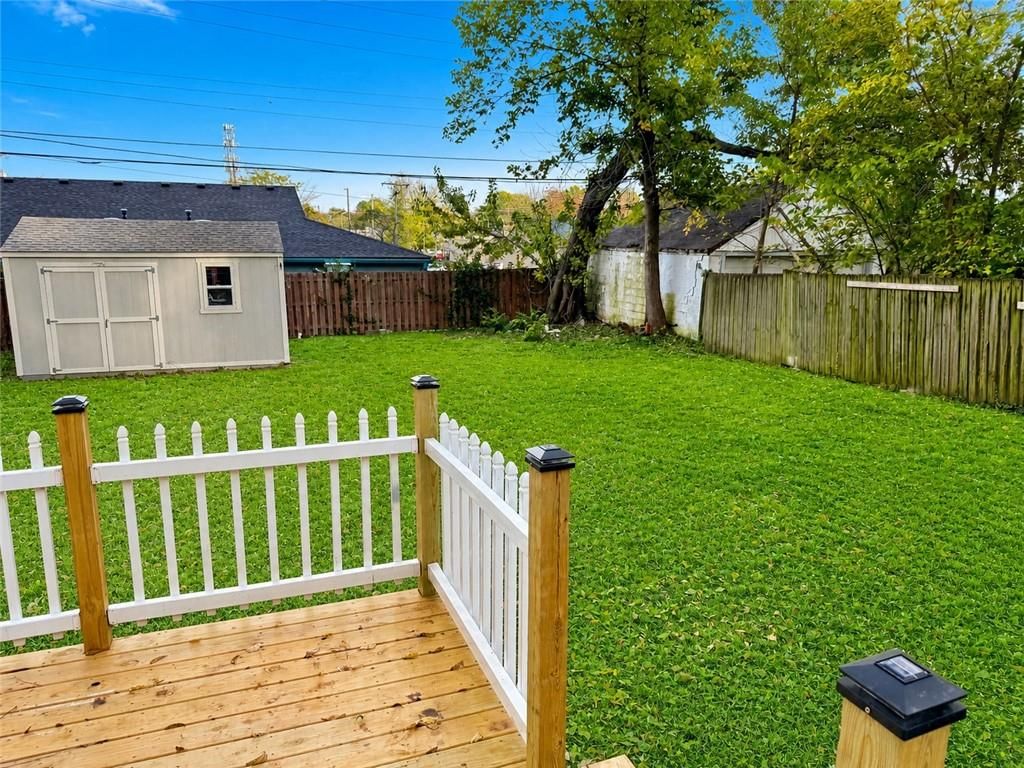 Photo 19
Fenced yard, seen in photo 19
List price $285,000 · 2 beds · 735 sqft
271
of 489 looked at, 112 of them seen in the photos
See the 271 homes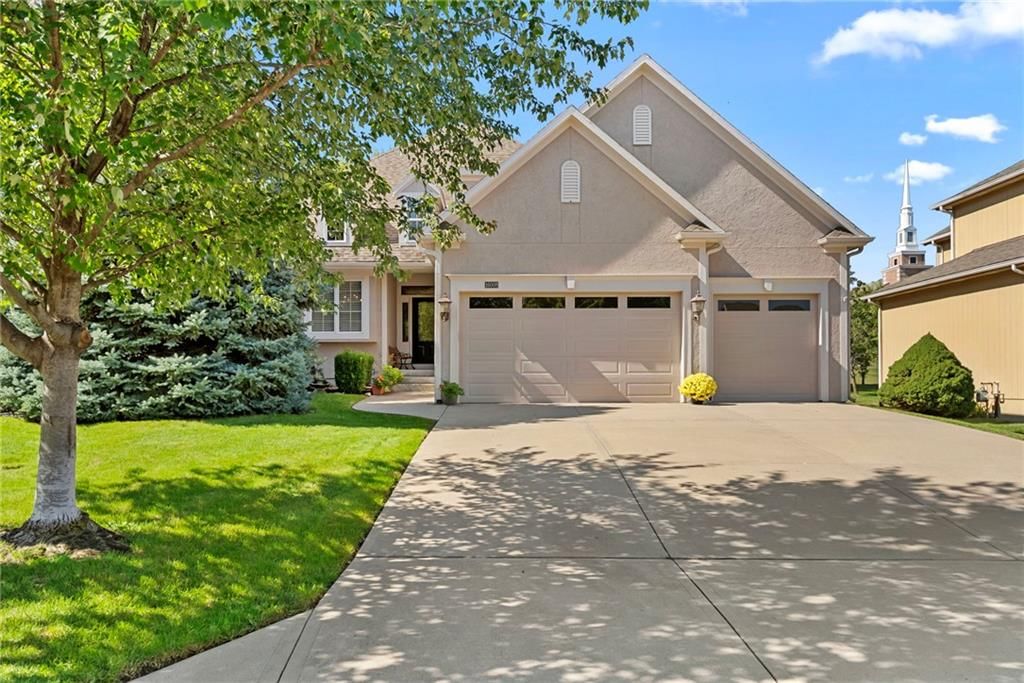 Photo 47
Three-car garage, seen in photo 47
Listed in the MLS
List price $675,000 · 4 beds · 3,296 sqft
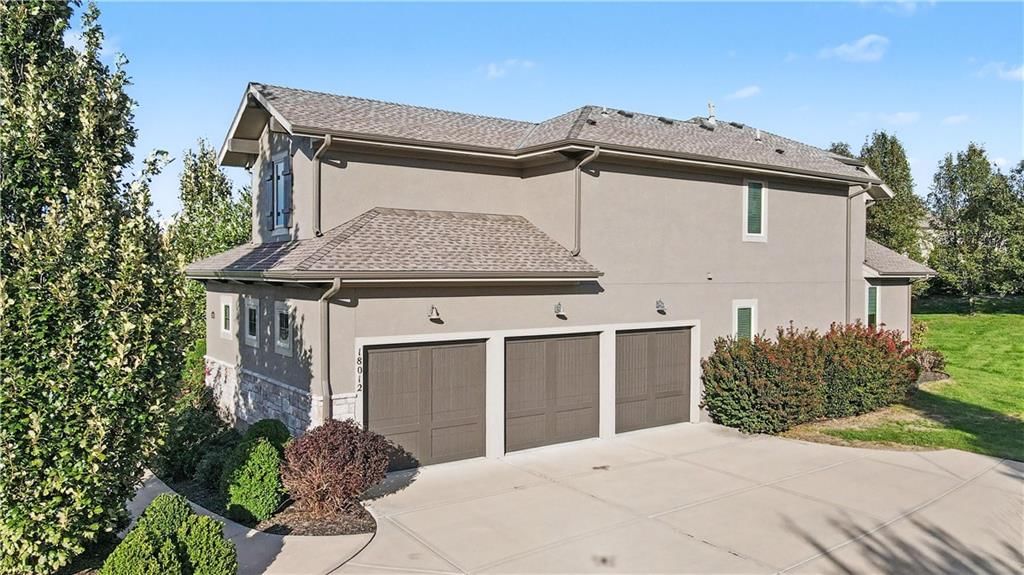 Photo 49
Three-car garage, seen in photo 49
Listed in the MLS
List price $1,350,000 · 5 beds · 4,188 sqft
As of Oct 24, 2026, these are features HouseLoop Vision found in the listing photos of Overland Park homes for sale that the homes' MLS data doesn't list.
| Search | For sale |
|---|---|
| Open houses | For sale84 |
| Luxury homes | For sale104 |
| Just listed homes | For sale50 |
| Price-reduced homes | For sale157 |
| Coming soon homes | For sale37 |
| Homes under contract | For sale324 |
| Price range | For sale |
|---|---|
| Under $200,000 | For sale7 |
| Under $300,000 | For sale43 |
| Under $400,000 | For sale96 |
| Under $500,000 | For sale147 |
| Feature | For sale |
|---|---|
| Homes with 2+ full bathrooms | For sale439 |
| Homes with an attached garage | For sale433 |
| 2-car garage homes | For sale420 |
| Homes with hardwood floors | For sale419 |
| Property type | Market (Market type is set by months of supply — how long it would take to sell every home for sale at the current pace. Under ~4 months favors sellers (low inventory, faster sales, homes near or above asking); over ~6 favors buyers (more choice, more negotiating room). 4–6 is balanced.) | Months supply | For sale | Median sale | Sell-to-list | Days to contract | Coming soon | Under contract |
|---|---|---|---|---|---|---|---|---|
| Single Family | Seller's | 2.3 mo | 374 | Median$548,000 | 102% | 16d | 29 | 252 |
| Townhouse | Strong Seller's | 1.4 mo | 18 | Median$327,500 | 101% | 15d | 1 | 16 |
| Villa | — | — | — | Median— | — | — | — | — |
| Condo / Loft | Strong Seller's | 1.5 mo | 11 | Median$190,000 | 100% | 18d | 3 | 13 |
| Half Duplex | — | — | — | Median— | — | — | — | — |
| Duplex | — | — | — | Median— | — | — | — | — |
| Lots / Land | Strong Buyer's | 52.8 mo | 22 | Median$475,000 | — | 5d | 0 | 5 |
| Neighborhood | Market (Market type is set by months of supply — how long it would take to sell every home for sale at the current pace. Under ~4 months favors sellers (low inventory, faster sales, homes near or above asking); over ~6 favors buyers (more choice, more negotiating room). 4–6 is balanced.) | Months supply | For sale | Median sale | Sell-to-list | Days to contract | Coming soon | Under contract |
|---|---|---|---|---|---|---|---|---|
| Nall Hills | Seller's | 2.3 mo | 9 | Median$425,000 | 100% | 13d | 0 | 2 |
| Chapel Hill | Balanced | 4.8 mo | 18 | Median$750,000 | 100% | 32d | 0 | 3 |
| Quivira Falls | Strong Seller's | 1.5 mo | 4 | Median$250,350 | 100% | 16d | 1 | 5 |
| Oak Park | Seller's | 2.1 mo | 5 | Median$415,000 | 101% | 17d | 1 | 3 |
| Terrybrook Farms | Buyer's | 7.8 mo | 11 | Median$1,127,500 | 94% | 53d | 0 | 4 |
| Place | Market (Market type is set by months of supply — how long it would take to sell every home for sale at the current pace. Under ~4 months favors sellers (low inventory, faster sales, homes near or above asking); over ~6 favors buyers (more choice, more negotiating room). 4–6 is balanced.) | Months supply | Median list | Sell-to-list | Days to contract | For sale | Coming soon | Under contract |
|---|---|---|---|---|---|---|---|---|
| Overland Park | Seller's | 2.5 mo | Median$725,000 | 102% | 16d | 498 | 37 | 324 |
| Olathe | Seller's | 3.1 mo | Median$628,000 | 100% | 18d | 562 | 30 | 292 |
| Shawnee | Seller's | 2.6 mo | Median$565,000 | 100% | 16d | 198 | 20 | 107 |
| Lenexa | Seller's | 2.9 mo | Median$635,050 | 99% | 21d | 199 | 12 | 82 |
| Leawood | Seller's | 2.9 mo | Median$912,000 | 99% | 18d | 141 | 12 | 71 |
| Place | Market (Market type is set by months of supply — how long it would take to sell every home for sale at the current pace. Under ~4 months favors sellers (low inventory, faster sales, homes near or above asking); over ~6 favors buyers (more choice, more negotiating room). 4–6 is balanced.) | Months supply | Median list | Sell-to-list | Days to contract | For sale | Coming soon | Under contract |
|---|---|---|---|---|---|---|---|---|
| 66212 | Strong Seller's | 1.4 mo | Median$365,000 | 100% | 15d | 53 | 3 | 41 |
| 66221 | Balanced | 4.1 mo | Median$972,500 | 101% | 29d | 133 | 6 | 62 |
| 66213 | Strong Seller's | 1.5 mo | Median$555,000 | 100% | 15d | 38 | 5 | 29 |
| 66223 | Strong Seller's | 1.4 mo | Median$502,000 | 99% | 16d | 29 | 3 | 27 |