
F.L. Schlagle High School in Wyandotte County, KS
17 homes for sale in the F.L. Schlagle High School area · Sorted by Newest Listed
1133 N 50th Place, Kansas City, KS
New · 18h ago


4400 Garfield Avenue, Kansas City, KS
New · 1d ago


4522 Walker Avenue, Kansas City, KS

6207 Leavenworth Road, Kansas City, KS


6515 Garfield Drive, Kansas City, KS


1766 N 64th Terrace, Kansas City, KS


1812 N 59th Street, Kansas City, KS


647 N 62nd Street, Kansas City, KS
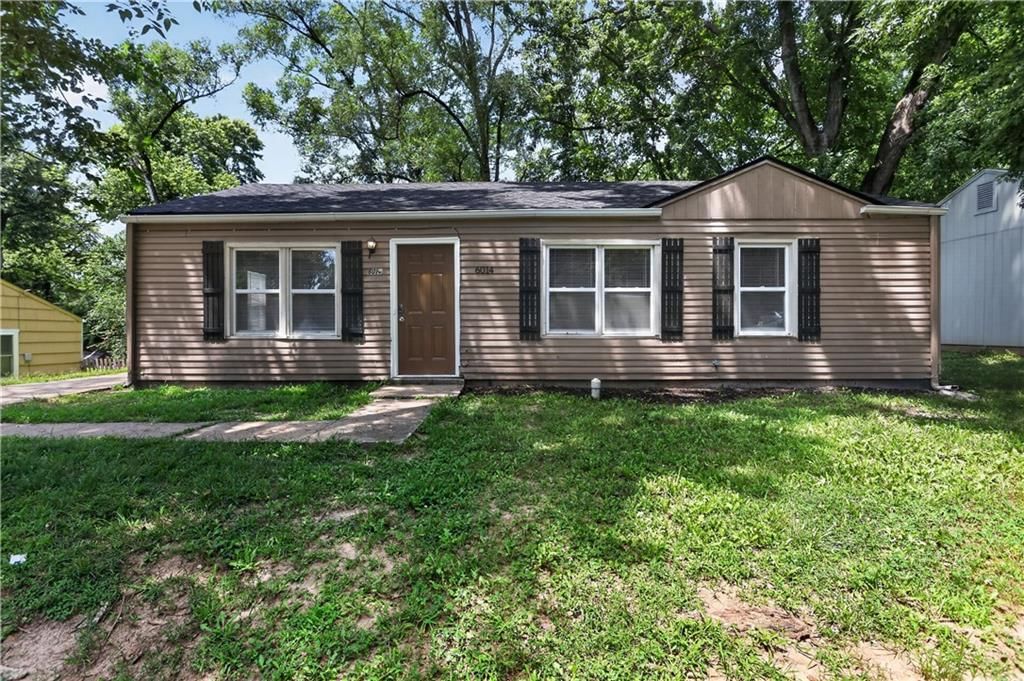


6014 Corona Avenue, Kansas City, KS
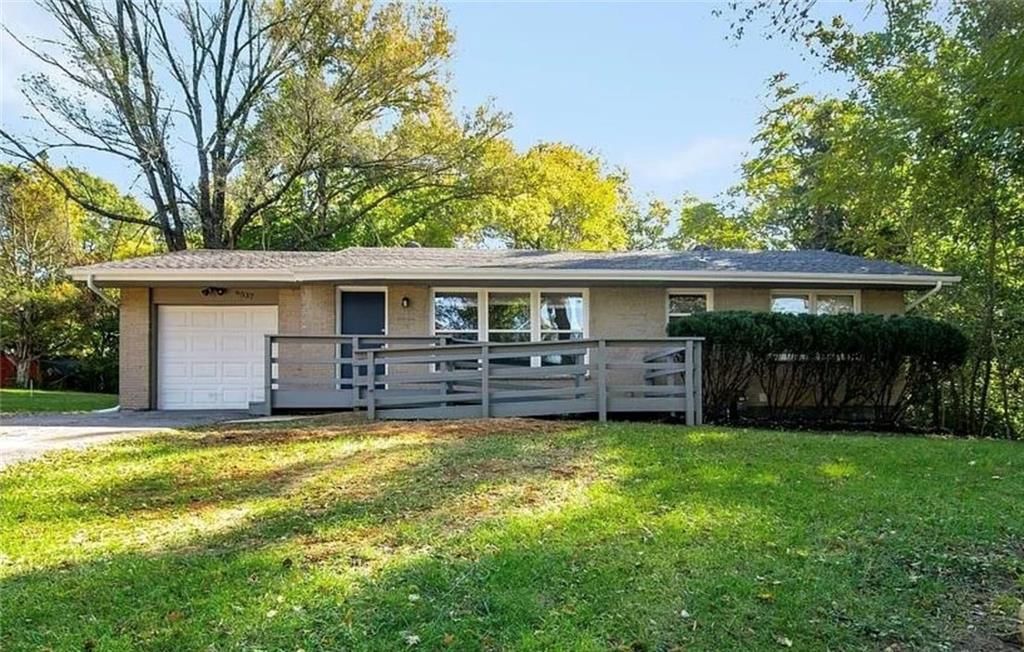


6537 Sears Drive, Kansas City, KS
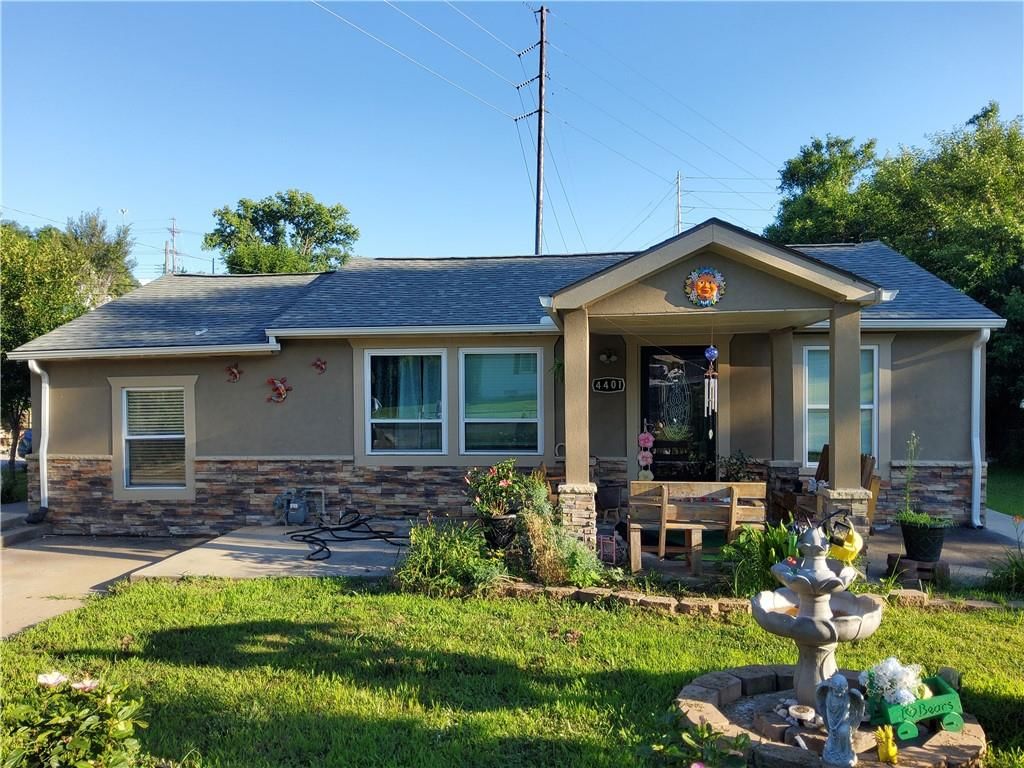


4401 Claudine Lane, Kansas City, KS


1831 N 59th Street, Kansas City, KS


4905 Oakland Avenue, Kansas City, KS
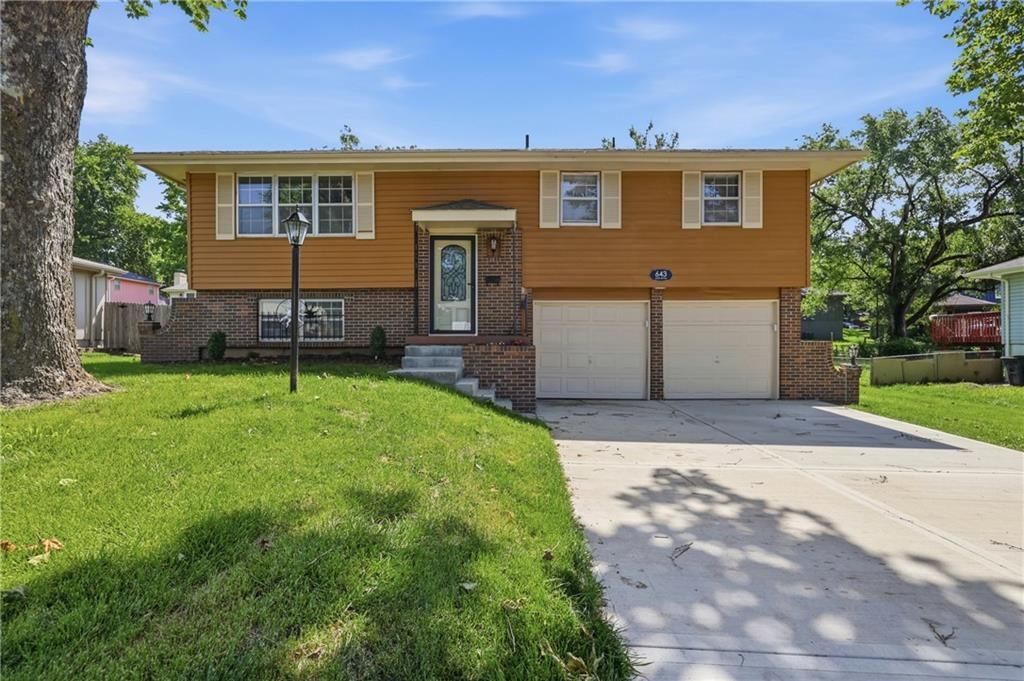


643 N 62nd Terrace, Kansas City, KS

2413 N 59th Terrace, Kansas City, KS
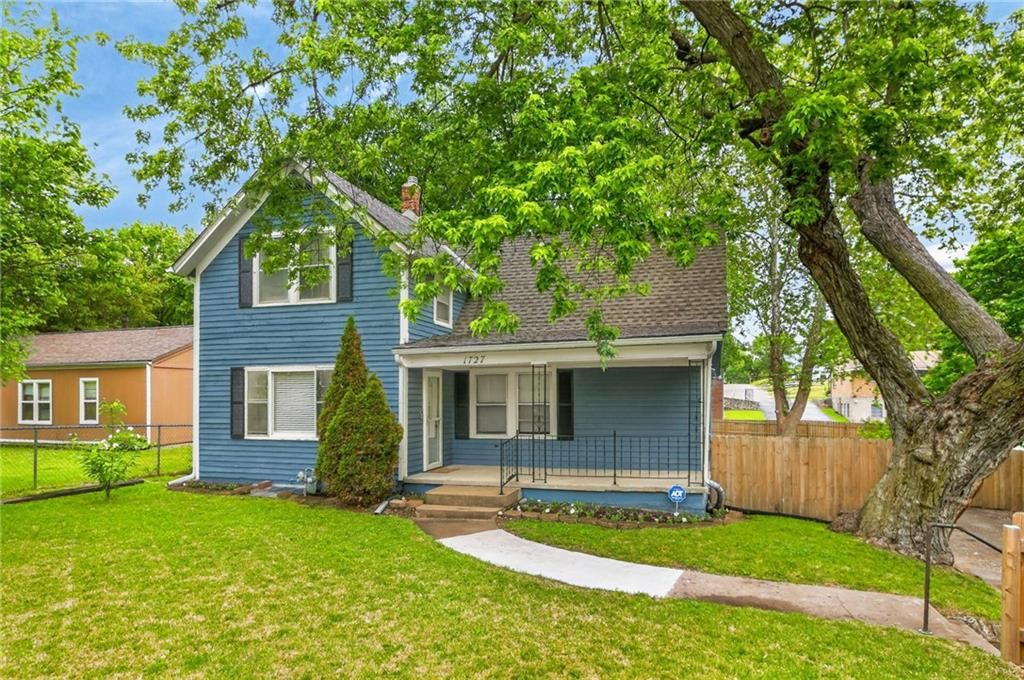

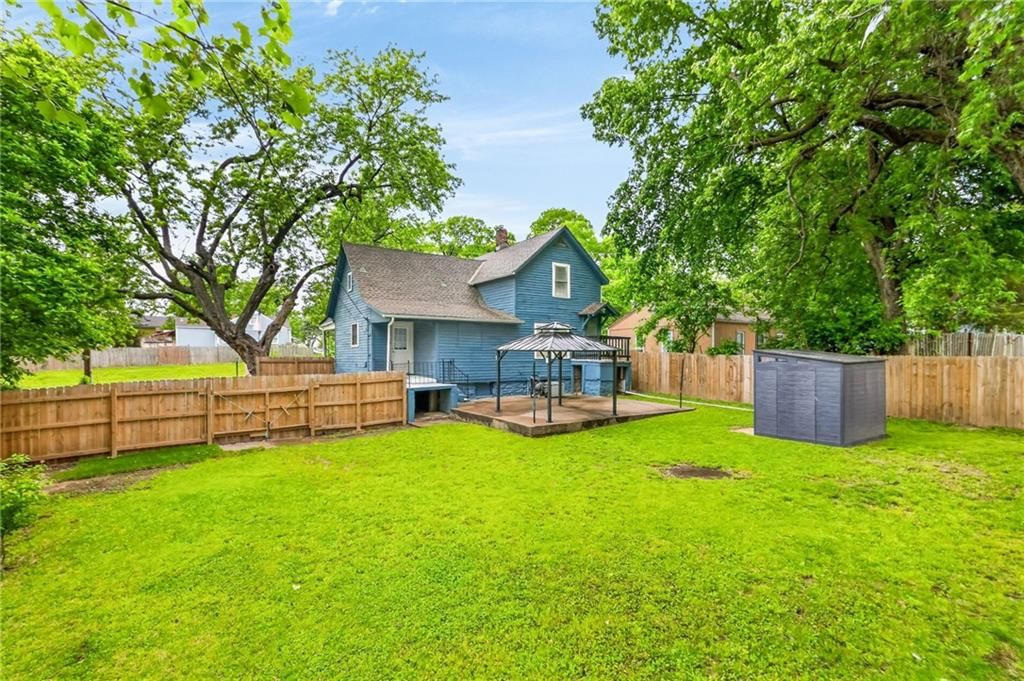
1727 N 47th Street, Kansas City, KS


6252 Lathrop Avenue, Kansas City, KS
Start with the numbers that matter to you
Wyandotte County offers some of the Kansas City metro's most affordable entry points — with 500 homes for sale, patient buyers have real options right now.
Real estate in Wyandotte County, Kansas
Wyandotte County, KS has about 61,241 households and a median household income of $60,582. Roughly 61% of homes are owner-occupied, the median owner's home value is $152,700, 20% of adults hold a bachelor's degree or higher. The average commute runs 22.1 minutes. The Census counts 167,277 residents. New construction is still adding supply: 26 building permits were issued in 2026-07.
The first thing a buyer or seller needs to know about Wyandotte County is this: it's a slow-moving market right now, and that cuts both ways. With homes averaging 105 days on the market and 500 active listings to choose from, buyers hold more leverage here than almost anywhere else in the KC metro. Sellers, meanwhile, need to price honestly and prepare for a longer wait — this is not a market where overpriced listings get bailed out by competing offers. The median list price of $249,000 as of Sep 21 and an average of $171 per square foot make Wyandotte County one of the last genuinely affordable entry points in the greater Kansas City area, which matters enormously for first-time buyers who've been priced out of Johnson County or the Missouri side.
Kansas City, Kansas — which most locals just call KCK — makes up the bulk of the county and carries the county's reputation, for better and worse. It's a city of real character: deeply rooted Latino and Somali communities, a restaurant scene anchored by the legendary barbecue and taqueria strips on Central Avenue, and a working-class housing stock that gives buyers more square footage per dollar than nearly any comparable metro. The 1,757 homes that sold here over the past twelve months tell you people are still betting on this market — it's not stagnant, just deliberate. Buyers should know that neighborhood quality varies block to block, so doing homework on specific streets, not just zip codes, is non-negotiable.
Bonner Springs and Edwardsville sit on the western edge of the county and offer a noticeably different feel. Bonner Springs has a genuine small-town downtown, hosts the annual Renaissance Festival, and attracts buyers who want a slower pace without leaving the metro entirely. Edwardsville is quiet, semi-rural, and tends to draw buyers looking for larger lots or light agricultural use. Both communities have seen steady interest from buyers priced out of Johnson County just to the south, and the commute to corporate campuses in Overland Park or Lenexa is manageable via K-7.
Schools in Wyandotte County are a legitimate consideration. Kansas City, Kansas Public Schools — the USD 500 district — has faced well-documented challenges, and buyers with school-age children should research individual schools rather than assume district-wide performance. Bonner Springs falls under USD 204, which generally earns stronger marks and is a real draw for families settling on the county's western end. Private and charter school options exist throughout the county for families who plan ahead.
For sellers, the data makes one thing clear: at 105 average days on market, this is not a place to test the ceiling on price. Homes that are well-maintained, accurately priced, and properly marketed do move — 1,757 closings in twelve months is proof of that. But aspirational pricing in a market with 470 competing listings leads to stale listings, price reductions, and ultimately less money. The buyers shopping Wyandotte County are often budget-conscious and diligent; they will notice if a home is overpriced.
For buyers, the calculus is more encouraging. The combination of a median list price of $249K as of Sep 21eaningful inventory, and extended days on market means there is room to negotiate and time to be selective. Wyandotte County rewards buyers who are willing to look past surface-level impressions and invest in a community that, particularly in KCK's urban core and Bonner Springs, is putting real energy into its future.
Sources — demographics: U.S. Census Bureau, American Community Survey 5-year estimates (2023) · listings, prices and days on market: Heartland MLS as distributed by MLS GRID, as of September 21, 2026 · analysis and home values: HouseLoop calculations
Housing market trends in Wyandotte County, Kansas
Wyandotte County, KS: 472 homes for sale · 23 new in the last 7 days · median asking $240,000 · 181 price reductions · a median of 21 days to contract. 112 homes closed in the last 30 days, at a median of $241,750. At the pace of the last 90 days that is 3.53 months of supply.
| Measure | Aug 2026 |
|---|---|
| Median sale price | $239,500 |
| Median price per sq ft | $164 |
| Median days to contract | 25 |
| Sell-to-list ratio | 100% |
| Homes sold | 138 |
| New listings | 240 |
| Went under contract | 140 |
Real estate FAQs about Wyandotte County
How many homes are for sale in Wyandotte County?
How much does a home in Wyandotte County cost?
What is the price per square foot in Wyandotte County?
How fast do homes sell in Wyandotte County?
How many homes have sold in Wyandotte County in the past year?
When were the homes in Wyandotte County built?
What are the newest homes for sale in Wyandotte County?
Are there older homes for sale in Wyandotte County?
How big are the homes for sale in Wyandotte County?
How big are the lots in Wyandotte County?
How many bedrooms do homes in Wyandotte County have?
Do homes in Wyandotte County have HOA fees?
Are there single-story homes for sale in Wyandotte County?
Are there homes with a pool in Wyandotte County?
What kind of garages do homes in Wyandotte County have?
What schools serve Wyandotte County?
Schools serving Wyandotte County
| School | Median list | |
|---|---|---|
| School districts | ||
| Kansas City KS School District | $229,000 | |
| Piper School District | $418,975 | |
| Bonner Springs School District | $295,000 | |
| Turner School District | $225,000 | |
| High schools | ||
| Piper | $439,970 | |
| Washington | $249,500 | |
| Wyandotte | $167,500 | |
| Harmon | $200,000 | |
| Bonner Springs | $280,000 | |
| F.L. Schlagle | $240,000 | |
| Turner | Median— | |
| Schlagle | Median— | |
How we compute these
- Median list.
- The middle asking price among the homes for sale right now. Half are listed above it, half below.
- For sale.
- Homes listed as active right now. A live count, not a monthly average.
Newly listed in Wyandotte County, KS
| Address | Price |
|---|---|
| 2421 N 72ND Street | Price$319,900 |
| 4400 Garfield Avenue | Price$264,900 |
| 8248 Armstrong Avenue | Price$264,900 |
| 2617 N 83rd Street | Price$374,900 |
| 3003 N 31st Street | Price$100,000 |
| 1118 S 36th Street | Price$145,000 |
| 6111 Leavenworth Road | Price$229,000 |
| 2022 Madison Drive | Price$249,000 |
| 7401 Greeley Avenue | Price$315,000 |
| 1922 W 36th Avenue | Price$375,000 |
| 4715 Cleveland Avenue | Price$325,000 |
| 1134 Merriam Lane | Price$125,000 |
Recently went under contract in Wyandotte County, KS
| Address | List price |
|---|---|
| 2708 N 101st Terrace | List price$449,950 |
| 3306 Hagemann Street | List price$259,000 |
| 2505 N 57th Drive | List price$250,000 |
| 2516 W 43RD Avenue | List price$145,000 |
| 2204 Washington Boulevard | List price$425,000 |
| 3108 S 47th Street | List price$230,999 |
| 6412 County Line Road | List price$304,950 |
| 6518 Rowland Avenue | List price$180,000 |
| 1044 Barnett Avenue | List price$89,000 |
| 7075 Reynolds Avenue | List price$239,900 |
| 800 Tauromee Avenue | List price$145,000 |
| 3013 Parkwood Boulevard | List price$135,000 |
How we compute these
- Under contract.
- Homes with an accepted contract that have not closed yet. A live count.
- Days to contract.
- The middle number of days between a home being listed and going under contract, over the last 90 days of closings. It is not days-to-close, and it is not how long today's listings have been sitting. Newly built homes are excluded, because a build finishing is not a market moving.
Popular home searches in Wyandotte County
| Search | For sale |
|---|---|
| Open houses | For sale2 |
| Luxury homes | 16 |
| Just listed homes | 38 |
| Price-reduced homes | 183 |
| Coming soon homes | 29 |
| Homes under contract | 207 |
How we compute these
- For sale.
- Homes listed as active right now. A live count, not a monthly average.
Homes by price in Wyandotte County
How we compute these
- For sale.
- Homes listed as active right now. A live count, not a monthly average.
Homes by feature in Wyandotte County
How we compute these
- For sale.
- Homes listed as active right now. A live count, not a monthly average.
Search by property type in Wyandotte County
| Property type | Median sale |
|---|---|
| Single Family | $238,000 |
| Townhouse | $234,000 |
| Villa | Median— |
| Condo / Loft | Median— |
| Half Duplex | Median— |
| Duplex | Median— |
| Quadruplex | Median— |
| Lots / Land | $42,500 |
How we compute these
- Market.
- Market type is set by months of supply — how long it would take to sell every home for sale at the current pace. Under ~4 months favors sellers (low inventory, faster sales, homes near or above asking); over ~6 favors buyers (more choice, more negotiating room). 4–6 is balanced.
- Months supply.
- How many months it would take to sell every home now for sale at the pace of the last 90 days: homes for sale ÷ (closings in the last 90 days ÷ 3).
- For sale.
- Homes listed as active right now. A live count, not a monthly average.
- Days to contract.
- The middle number of days between a home being listed and going under contract, over the last 90 days of closings. It is not days-to-close, and it is not how long today's listings have been sitting. Newly built homes are excluded, because a build finishing is not a market moving.
- Coming soon.
- Homes announced but not yet accepting showings. A live count.
- Under contract.
- Homes with an accepted contract that have not closed yet. A live count.
Search homes in Wyandotte County
| City | Median list |
|---|---|
| Kansas City | $249,000 |
| Bonner Springs | $252,000 |
| Edwardsville | $319,950 |
| Shawnee | $550,000 |
| Lake Quivira | $949,000 |
| Basehor | $459,990 |
How we compute these
- Market.
- Market type is set by months of supply — how long it would take to sell every home for sale at the current pace. Under ~4 months favors sellers (low inventory, faster sales, homes near or above asking); over ~6 favors buyers (more choice, more negotiating room). 4–6 is balanced.
- Months supply.
- How many months it would take to sell every home now for sale at the pace of the last 90 days: homes for sale ÷ (closings in the last 90 days ÷ 3).
- Median list.
- The middle asking price among the homes for sale right now. Half are listed above it, half below.
- Days to contract.
- The middle number of days between a home being listed and going under contract, over the last 90 days of closings. It is not days-to-close, and it is not how long today's listings have been sitting. Newly built homes are excluded, because a build finishing is not a market moving.
- For sale.
- Homes listed as active right now. A live count, not a monthly average.
- Coming soon.
- Homes announced but not yet accepting showings. A live count.
- Under contract.
- Homes with an accepted contract that have not closed yet. A live count.
ZIP codes in Wyandotte County
| Place | Median list |
|---|---|
| 66104 | $237,450 |
| 66106 | $225,000 |
| 66102 | $209,500 |
| 66103 | $244,900 |
| 66112 | $232,450 |
| 66111 | $286,250 |
| 66101 | $165,000 |
| 66105 | $237,500 |
| 66216 | $400,000 |
| 66217 | $607,000 |
How we compute these
- Market.
- Market type is set by months of supply — how long it would take to sell every home for sale at the current pace. Under ~4 months favors sellers (low inventory, faster sales, homes near or above asking); over ~6 favors buyers (more choice, more negotiating room). 4–6 is balanced.
- Months supply.
- How many months it would take to sell every home now for sale at the pace of the last 90 days: homes for sale ÷ (closings in the last 90 days ÷ 3).
- Median list.
- The middle asking price among the homes for sale right now. Half are listed above it, half below.
- Days to contract.
- The middle number of days between a home being listed and going under contract, over the last 90 days of closings. It is not days-to-close, and it is not how long today's listings have been sitting. Newly built homes are excluded, because a build finishing is not a market moving.
- For sale.
- Homes listed as active right now. A live count, not a monthly average.
- Coming soon.
- Homes announced but not yet accepting showings. A live count.
- Under contract.
- Homes with an accepted contract that have not closed yet. A live count.
Search homes for sale in every city we cover
How we compute these
- Market.
- Market type is set by months of supply — how long it would take to sell every home for sale at the current pace. Under ~4 months favors sellers (low inventory, faster sales, homes near or above asking); over ~6 favors buyers (more choice, more negotiating room). 4–6 is balanced.
- Months supply.
- How many months it would take to sell every home now for sale at the pace of the last 90 days: homes for sale ÷ (closings in the last 90 days ÷ 3).
- Median list.
- The middle asking price among the homes for sale right now. Half are listed above it, half below.
- Days to contract.
- The middle number of days between a home being listed and going under contract, over the last 90 days of closings. It is not days-to-close, and it is not how long today's listings have been sitting. Newly built homes are excluded, because a build finishing is not a market moving.
- For sale.
- Homes listed as active right now. A live count, not a monthly average.
- Coming soon.
- Homes announced but not yet accepting showings. A live count.
- Under contract.
- Homes with an accepted contract that have not closed yet. A live count.
Search for homes in popular markets
| Market | For sale |
|---|---|
| Heritage Ranch | 29 |
| Ruskin Heights | 26 |
| Canyon Lakes | 25 |
| Garrett Ranch | 24 |
| Tomahawk Valley | 23 |
| Seven Bridges | 23 |
How we compute these
- Market.
- Market type is set by months of supply — how long it would take to sell every home for sale at the current pace. Under ~4 months favors sellers (low inventory, faster sales, homes near or above asking); over ~6 favors buyers (more choice, more negotiating room). 4–6 is balanced.
- For sale.
- Homes listed as active right now. A live count, not a monthly average.
Or go wider still county, metro and state
How we compute these
- Market.
- Market type is set by months of supply — how long it would take to sell every home for sale at the current pace. Under ~4 months favors sellers (low inventory, faster sales, homes near or above asking); over ~6 favors buyers (more choice, more negotiating room). 4–6 is balanced.
- Months supply.
- How many months it would take to sell every home now for sale at the pace of the last 90 days: homes for sale ÷ (closings in the last 90 days ÷ 3).
- Median list.
- The middle asking price among the homes for sale right now. Half are listed above it, half below.
- Days to contract.
- The middle number of days between a home being listed and going under contract, over the last 90 days of closings. It is not days-to-close, and it is not how long today's listings have been sitting. Newly built homes are excluded, because a build finishing is not a market moving.
- For sale.
- Homes listed as active right now. A live count, not a monthly average.
- Coming soon.
- Homes announced but not yet accepting showings. A live count.
- Under contract.
- Homes with an accepted contract that have not closed yet. A live count.