
Main-Floor Primary Homes for Sale in Shawnee, KS
88 homes fit this search · Sorted by Newest Listed


14303 W 58th Terrace, Shawnee, KS
New · 14h ago


7557 McCormick Drive, Shawnee, KS
New · 20h ago


22400 W 73rd Terrace, Shawnee, KS
New · 2d ago


6701 Apache Drive, Shawnee, KS
New · 2d ago


6635 McCormick Drive, Shawnee, KS
New · 2d ago


22310 W 76th Street, Shawnee, KS
New · 2d ago


7104 Hedge Lane Terrace, Shawnee, KS
New · 3d ago


6745 Arapahoe Drive, Shawnee, KS
New · 3d ago


6751 Arapahoe Drive, Shawnee, KS
New · 3d ago


6634 McCormick Drive, Shawnee, KS
New · 3d ago


5141 Monrovia Street, Shawnee, KS
New · 4d ago


4425 Silverheel Street, Shawnee, KS
New · 4d ago


7202 Larsen Street, Shawnee, KS
New · 6d ago


11416 W 67TH Terrace, Shawnee, KS
New · 7d ago


24625 W 60 Terrace, Shawnee, KS
New · 7d ago


24624 W 60th Terrace, Shawnee, KS
New · 7d ago


11300 W 70th Terrace, Shawnee, KS


6102 Earnshaw Street, Shawnee, KS


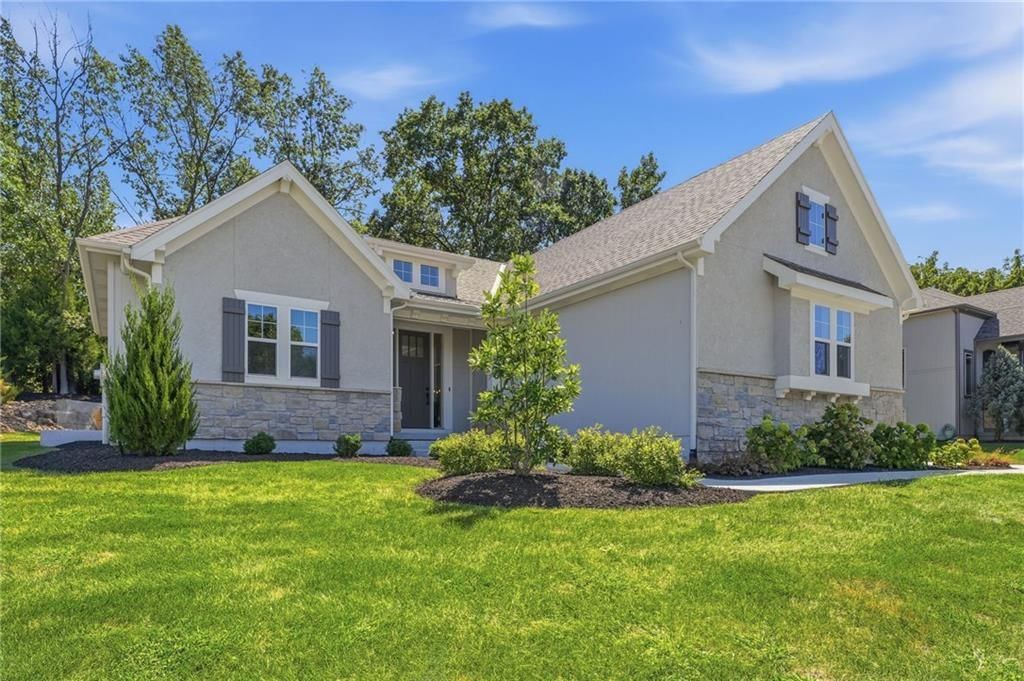
6753 Longview Road, Shawnee, KS


12716 W 57th Terrace, Shawnee, KS


5906 McCormick Drive, Shawnee, KS


5902 McCormick Drive, Shawnee, KS


12208 W 55 Street, Shawnee, KS


6104 Barth Road, Shawnee, KS
About Homes with Main Floor Primary inShawnee, KS
Shawnee, KS has 88 homes with main floor primary for sale right now, with a median list price of $529,950 as of Sep 19 These homes with main floor primary were built between 1932 and 2026, ranging from 744 to 5,943 square feet.
Homes with Main Floor Primary market trendsShawnee, KS
Shawnee, KS: 161 homes for sale · 21 new in the last 7 days · median asking $530,000 · 48 price reductions · a median of 16 days to contract. 75 homes closed in the last 30 days, at a median of $426,500. At the pace of the last 90 days that is 1.98 months of supply.
| Measure | Aug 2026 |
|---|---|
| Median sale price | $420,000 |
| Median price per sq ft | $200 |
| Median days to contract | 16 |
| Sell-to-list ratio | 101% |
| Homes sold | 85 |
| New listings | 102 |
| Went under contract | 78 |
Homes with Main Floor Primary FAQsShawnee, KS
How many homes with main floor primary are for sale in Shawnee, KS?
What is the median list price of homes with main floor primary in Shawnee, KS?
Schoolsserving Shawnee
| School | Median list | |
|---|---|---|
| School districts | ||
| De Soto School District | $664,950 | |
| Shawnee Mission School District | $387,450 | |
| High schools | ||
| Mill Valley | $569,000 | |
| De Soto | $674,950 | |
| Shawnee Mission Northwest | $399,000 | |
| Shawnee Mission North | Median— | |
| Middle schools | ||
| Mill Creek | $704,950 | |
| Trailridge | $397,000 | |
| Monticello Trails | $499,900 | |
| Hocker Grove | $335,000 | |
| Elementary schools | ||
| Belmont | $704,950 | |
| Horizon | $855,000 | |
How we compute these
- Median list.
- The middle asking price among the homes for sale right now. Half are listed above it, half below.
- For sale.
- Homes listed as active right now. A live count, not a monthly average.
Newly listedin Shawnee, KS
| Address | Price |
|---|---|
| 7020 Widmer Road | Price$330,000 |
| 22312 W 76th Street | Price$488,360 |
| 5913 Noland Road | Price$399,000 |
| 11318 W 66th Terrace | Price$325,000 |
| 13907 W 58th Place | Price$480,000 |
| 11921 W 66th Terrace | Price$285,000 |
| 22400 W 73rd Terrace | Price$415,000 |
| 6701 Apache Drive | Price$595,400 |
| 6635 McCormick Drive | Price$610,375 |
| 22310 W 76th Street | Price$474,950 |
| 5821 Rosehill Road | Price$225,000 |
| 11204 W 51st Terrace | Price$324,950 |
Recently went under contractin Shawnee, KS
| Address | List price |
|---|---|
| 7128 Allman Drive | List price$500,000 |
| 4831 Reeder Street | List price$249,000 |
| 5537 Aminda Street | List price$605,000 |
| 21206 W 55th Terrace | List price$425,000 |
| 6241 Rene Street | List price$250,000 |
| 6940 Renner Road | List price$275,000 |
| 11815 Johnson Drive | List price$369,000 |
| 21106 W. 81st Street | List price$1,441,155 |
| 5308 Quivira Road | List price$150,000 |
| 5124 Noble Street | List price$425,000 |
| 10910 W 67 Street | List price$395,000 |
| 5507 Cody Street | List price$347,000 |
How we compute these
- Under contract.
- Homes with an accepted contract that have not closed yet. A live count.
- Days to contract.
- The middle number of days between a home being listed and going under contract, over the last 90 days of closings. It is not days-to-close, and it is not how long today's listings have been sitting. Newly built homes are excluded, because a build finishing is not a market moving.
Popular home searchesin Shawnee
| Search | For sale |
|---|---|
| Open houses | 36 |
| Luxury homes | 20 |
| Just listed homes | 29 |
| Price-reduced homes | 48 |
| Coming soon homes | 19 |
| Homes under contract | 108 |
How we compute these
- For sale.
- Homes listed as active right now. A live count, not a monthly average.
Homes by pricein Shawnee
How we compute these
- For sale.
- Homes listed as active right now. A live count, not a monthly average.
Homes by featurein Shawnee
How we compute these
- For sale.
- Homes listed as active right now. A live count, not a monthly average.
Search by property typein Shawnee
| Property type | Median sale |
|---|---|
| Single Family | $445,000 |
| Townhouse | $322,500 |
| Villa | Median— |
| Condo / Loft | Median— |
| Half Duplex | Median— |
| Duplex | Median— |
| Triplex | Median— |
| Lots / Land | $275,000 |
How we compute these
- Market.
- Market type is set by months of supply — how long it would take to sell every home for sale at the current pace. Under ~4 months favors sellers (low inventory, faster sales, homes near or above asking); over ~6 favors buyers (more choice, more negotiating room). 4–6 is balanced.
- Months supply.
- How many months it would take to sell every home now for sale at the pace of the last 90 days: homes for sale ÷ (closings in the last 90 days ÷ 3).
- For sale.
- Homes listed as active right now. A live count, not a monthly average.
- Days to contract.
- The middle number of days between a home being listed and going under contract, over the last 90 days of closings. It is not days-to-close, and it is not how long today's listings have been sitting. Newly built homes are excluded, because a build finishing is not a market moving.
- Coming soon.
- Homes announced but not yet accepting showings. A live count.
- Under contract.
- Homes with an accepted contract that have not closed yet. A live count.
Nearby neighborhoodsto Shawnee
| Neighborhood | Median sale |
|---|---|
| Canyon Lakes | $723,000 |
| Shawnee Village | $256,000 |
| Bristol Highlands | $1,108,000 |
| Hillcrest Farm | $453,500 |
| Lakeview Est | $549,500 |
| Woodsonia | $477,000 |
How we compute these
- Market.
- Market type is set by months of supply — how long it would take to sell every home for sale at the current pace. Under ~4 months favors sellers (low inventory, faster sales, homes near or above asking); over ~6 favors buyers (more choice, more negotiating room). 4–6 is balanced.
- Months supply.
- How many months it would take to sell every home now for sale at the pace of the last 90 days: homes for sale ÷ (closings in the last 90 days ÷ 3).
- For sale.
- Homes listed as active right now. A live count, not a monthly average.
- Days to contract.
- The middle number of days between a home being listed and going under contract, over the last 90 days of closings. It is not days-to-close, and it is not how long today's listings have been sitting. Newly built homes are excluded, because a build finishing is not a market moving.
- Coming soon.
- Homes announced but not yet accepting showings. A live count.
- Under contract.
- Homes with an accepted contract that have not closed yet. A live count.
Search homesnearby Shawnee
| Place | Median list |
|---|---|
| Shawnee | $529,950 |
| Overland Park | $744,925 |
| Olathe | $626,705 |
| Lenexa | $649,300 |
| Leawood | $980,000 |
| Prairie Village | $1,195,000 |
How we compute these
- Market.
- Market type is set by months of supply — how long it would take to sell every home for sale at the current pace. Under ~4 months favors sellers (low inventory, faster sales, homes near or above asking); over ~6 favors buyers (more choice, more negotiating room). 4–6 is balanced.
- Months supply.
- How many months it would take to sell every home now for sale at the pace of the last 90 days: homes for sale ÷ (closings in the last 90 days ÷ 3).
- Median list.
- The middle asking price among the homes for sale right now. Half are listed above it, half below.
- Days to contract.
- The middle number of days between a home being listed and going under contract, over the last 90 days of closings. It is not days-to-close, and it is not how long today's listings have been sitting. Newly built homes are excluded, because a build finishing is not a market moving.
- For sale.
- Homes listed as active right now. A live count, not a monthly average.
- Coming soon.
- Homes announced but not yet accepting showings. A live count.
- Under contract.
- Homes with an accepted contract that have not closed yet. A live count.
NearbyZIP codes
| Place | Median list |
|---|---|
| 66203 | $325,000 |
| 66226 | $664,950 |
| 66218 | $625,000 |
| 66216 | $399,500 |
| 66225 | Median— |
| 66217 | $607,000 |
How we compute these
- Market.
- Market type is set by months of supply — how long it would take to sell every home for sale at the current pace. Under ~4 months favors sellers (low inventory, faster sales, homes near or above asking); over ~6 favors buyers (more choice, more negotiating room). 4–6 is balanced.
- Months supply.
- How many months it would take to sell every home now for sale at the pace of the last 90 days: homes for sale ÷ (closings in the last 90 days ÷ 3).
- Median list.
- The middle asking price among the homes for sale right now. Half are listed above it, half below.
- Days to contract.
- The middle number of days between a home being listed and going under contract, over the last 90 days of closings. It is not days-to-close, and it is not how long today's listings have been sitting. Newly built homes are excluded, because a build finishing is not a market moving.
- For sale.
- Homes listed as active right now. A live count, not a monthly average.
- Coming soon.
- Homes announced but not yet accepting showings. A live count.
- Under contract.
- Homes with an accepted contract that have not closed yet. A live count.
Search homes for salein every city we cover
How we compute these
- Market.
- Market type is set by months of supply — how long it would take to sell every home for sale at the current pace. Under ~4 months favors sellers (low inventory, faster sales, homes near or above asking); over ~6 favors buyers (more choice, more negotiating room). 4–6 is balanced.
- Months supply.
- How many months it would take to sell every home now for sale at the pace of the last 90 days: homes for sale ÷ (closings in the last 90 days ÷ 3).
- Median list.
- The middle asking price among the homes for sale right now. Half are listed above it, half below.
- Days to contract.
- The middle number of days between a home being listed and going under contract, over the last 90 days of closings. It is not days-to-close, and it is not how long today's listings have been sitting. Newly built homes are excluded, because a build finishing is not a market moving.
- For sale.
- Homes listed as active right now. A live count, not a monthly average.
- Coming soon.
- Homes announced but not yet accepting showings. A live count.
- Under contract.
- Homes with an accepted contract that have not closed yet. A live count.
Search for homesin popular markets
| Market | For sale |
|---|---|
| Heritage Ranch | 28 |
| Canyon Lakes | 25 |
| Ruskin Heights | 25 |
| Garrett Ranch | 24 |
| Tomahawk Valley | 23 |
| Seven Bridges | 23 |
How we compute these
- Market.
- Market type is set by months of supply — how long it would take to sell every home for sale at the current pace. Under ~4 months favors sellers (low inventory, faster sales, homes near or above asking); over ~6 favors buyers (more choice, more negotiating room). 4–6 is balanced.
- For sale.
- Homes listed as active right now. A live count, not a monthly average.
Or go wider stillcounty, metro and state
How we compute these
- Market.
- Market type is set by months of supply — how long it would take to sell every home for sale at the current pace. Under ~4 months favors sellers (low inventory, faster sales, homes near or above asking); over ~6 favors buyers (more choice, more negotiating room). 4–6 is balanced.
- Months supply.
- How many months it would take to sell every home now for sale at the pace of the last 90 days: homes for sale ÷ (closings in the last 90 days ÷ 3).
- Median list.
- The middle asking price among the homes for sale right now. Half are listed above it, half below.
- Days to contract.
- The middle number of days between a home being listed and going under contract, over the last 90 days of closings. It is not days-to-close, and it is not how long today's listings have been sitting. Newly built homes are excluded, because a build finishing is not a market moving.
- For sale.
- Homes listed as active right now. A live count, not a monthly average.
- Coming soon.
- Homes announced but not yet accepting showings. A live count.
- Under contract.
- Homes with an accepted contract that have not closed yet. A live count.