
Ranch Homes for Sale in Gardner, KS
21 homes for sale in Gardner · Sorted by Newest Listed


31687 W 172nd Street, Gardner, KS
New · 2d ago


945 E Cottage Creek Drive, Gardner, KS
New · 2d ago

18404 Ash Street, Gardner, KS
New · 3d ago


738 S Cypress Street, Gardner, KS
New · 4d ago


561 N Evergreen Street, Gardner, KS
New · 5d ago

724 Valerie Lane, Gardner, KS


644 N Pear Street, Gardner, KS


805 N Buckeye Street, Gardner, KS


829 N Buckeye Street, Gardner, KS


837 N Buckeye Street, Gardner, KS


328 N Cherry Street, Gardner, KS


533 N Mulberry Street, Gardner, KS


333 N Cherry Street, Gardner, KS


891 N Pear Street, Gardner, KS


640 Lanesfield Street, Gardner, KS


31940 W 172nd Street, Gardner, KS


17542 Muncie Street, Gardner, KS


588 W Bluebird Street, Gardner, KS
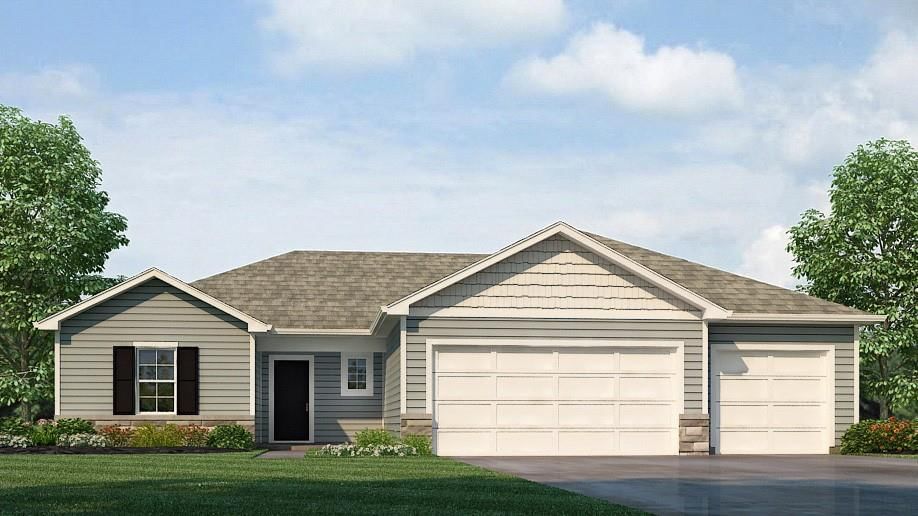


25021 178th Terrace, Gardner, KS


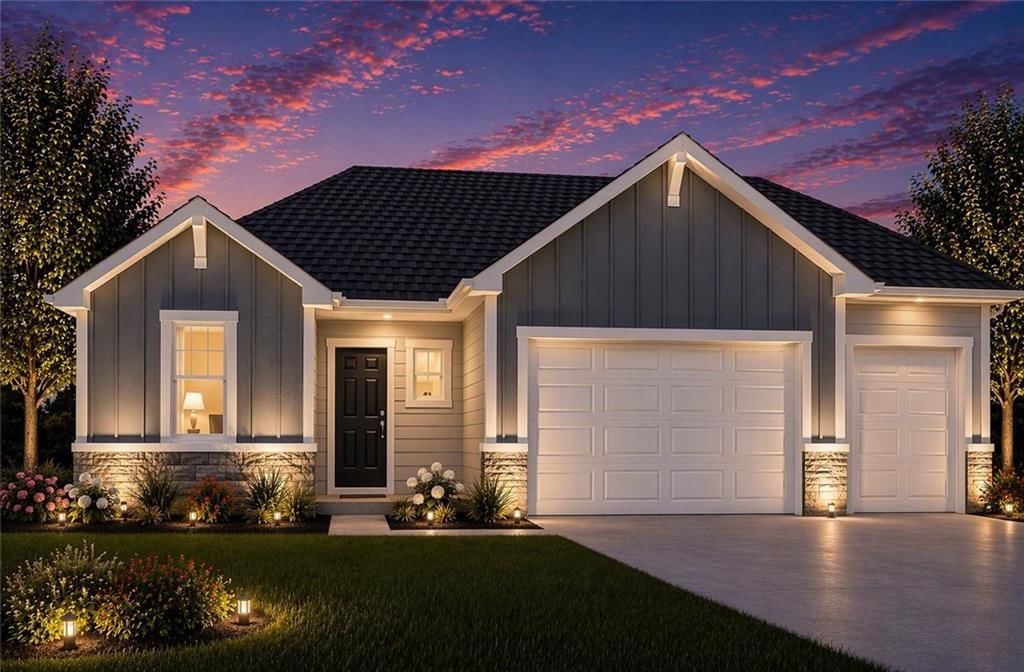
17819 Green Road, Gardner, KS


32710 W 175th Terrace, Gardner, KS
Start with the numbers that matter to you
Real estate in Gardner, Kansas
Gardner, KS has about 8,175 households and a median household income of $92,579. Roughly 67% of homes are owner-occupied, the median owner's home value is $276,000, 32% of adults hold a bachelor's degree or higher. The average commute runs 23.3 minutes. The Census counts 24,020 residents. New construction is still adding supply: 101 building permits were issued in 2026-07.
Gardner, KS has 101 homes for sale right now, with a median list price of $427,178 as of Sep 20 These homes were built between 1973 and 2026, ranging from 1,120 to 4,376 square feet.
Sources — demographics: U.S. Census Bureau, American Community Survey 5-year estimates (2023) · listings, prices and days on market: Heartland MLS as distributed by MLS GRID, as of September 20, 2026 · analysis and home values: HouseLoop calculations
Housing market trends in Gardner, Kansas
Gardner, KS: 97 homes for sale · 6 new in the last 7 days · median asking $429,355 · 33 price reductions · a median of 17 days to contract. 46 homes closed in the last 30 days, at a median of $385,000. At the pace of the last 90 days that is 2.31 months of supply.
| Measure | Aug 2026 |
|---|---|
| Median sale price | $373,552 |
| Median price per sq ft | $218 |
| Median days to contract | 19 |
| Sell-to-list ratio | 100% |
| Homes sold | 52 |
| New listings | 47 |
| Went under contract | 44 |
Real estate FAQs about Gardner
How many homes are for sale in Gardner?
How much does a home in Gardner cost?
What is the price per square foot in Gardner?
How fast do homes sell in Gardner?
How many homes have sold in Gardner in the past year?
When were the homes in Gardner built?
What are the newest homes for sale in Gardner?
How big are the homes for sale in Gardner?
How big are the lots in Gardner?
How many bedrooms do homes in Gardner have?
Do homes in Gardner have HOA fees?
Are there single-story homes for sale in Gardner?
What kind of garages do homes in Gardner have?
What schools serve Gardner?
What is the most common flooring in Gardner homes?
What are the nearby places to Gardner?
Schools serving Gardner
| School | Median list | |
|---|---|---|
| School districts | ||
| Gardner Edgerton School District | $425,000 | |
| High schools | ||
| Gardner Edgerton | $449,990 | |
| Middle schools | ||
| Pioneer Ridge | $402,025 | |
| Trailridge | $483,990 | |
| Wheatridge | Median— | |
| Elementary schools | ||
| Madison | $399,990 | |
| Nike | $499,000 | |
| Gardner | Median— | |
| Madison Place | Median— | |
| Moonlight | Median— | |
| Grand Star | Median— | |
How we compute these
- Median list.
- The middle asking price among the homes for sale right now. Half are listed above it, half below.
- For sale.
- Homes listed as active right now. A live count, not a monthly average.
Newly listed in Gardner, KS
| Address | Price |
|---|---|
| 866 N Maple Street | Price$405,000 |
| 31687 W 172nd Street | Price$329,990 |
| 405 Birch Street | Price$349,900 |
| 765 N Buckeye Street | Price$380,995 |
| 738 S Cypress Street | Price$349,900 |
| 561 N Evergreen Street | Price$467,000 |
Recently went under contract in Gardner, KS
| Address | List price |
|---|---|
| 29201 W 183rd Terrace | List price$370,000 |
| 31700 W 164th Court | List price$550,000 |
| 31780 W 172nd Street | List price$342,500 |
| 628 E Dogwood Street | List price$359,950 |
| 25242 W 177th Terrace | List price$399,990 |
| 16439 Blair Street | List price$339,950 |
| 25291 W 177th Terrace | List price$439,990 |
| 17581 Spivey Street | List price$400,815 |
| 17633 Spivey Street | List price$393,520 |
| 844 S Woodson Court | List price$215,000 |
| 269 W Cheyenne Street | List price$360,000 |
| 28407 W 161st Street | List price$544,500 |
How we compute these
- Under contract.
- Homes with an accepted contract that have not closed yet. A live count.
- Days to contract.
- The middle number of days between a home being listed and going under contract, over the last 90 days of closings. It is not days-to-close, and it is not how long today's listings have been sitting. Newly built homes are excluded, because a build finishing is not a market moving.
Popular home searches in Gardner
| Search | For sale |
|---|---|
| Open houses | 12 |
| Luxury homes | 10 |
| Just listed homes | 9 |
| Price-reduced homes | 33 |
| Coming soon homes | 4 |
| Homes under contract | 58 |
How we compute these
- For sale.
- Homes listed as active right now. A live count, not a monthly average.
Homes by price in Gardner
| Price range | For sale |
|---|---|
| Under $300,000 | For sale6 |
| Under $400,000 | 43 |
| Under $500,000 | 69 |
| Under $600,000 | 85 |
| Under $750,000 | 90 |
| Under $1,000,000 | 91 |
| $300,000 – $400,000 | 37 |
| $400,000 – $500,000 | 26 |
| $500,000 – $600,000 | 17 |
| $600,000 – $750,000 | For sale5 |
| $1M and above | 10 |
How we compute these
- For sale.
- Homes listed as active right now. A live count, not a monthly average.
Homes by feature in Gardner
How we compute these
- For sale.
- Homes listed as active right now. A live count, not a monthly average.
Search by property type in Gardner
| Property type | Median sale |
|---|---|
| Single Family | $370,000 |
| Lots / Land | $195,300 |
How we compute these
- Market.
- Market type is set by months of supply — how long it would take to sell every home for sale at the current pace. Under ~4 months favors sellers (low inventory, faster sales, homes near or above asking); over ~6 favors buyers (more choice, more negotiating room). 4–6 is balanced.
- Months supply.
- How many months it would take to sell every home now for sale at the pace of the last 90 days: homes for sale ÷ (closings in the last 90 days ÷ 3).
- For sale.
- Homes listed as active right now. A live count, not a monthly average.
- Days to contract.
- The middle number of days between a home being listed and going under contract, over the last 90 days of closings. It is not days-to-close, and it is not how long today's listings have been sitting. Newly built homes are excluded, because a build finishing is not a market moving.
- Coming soon.
- Homes announced but not yet accepting showings. A live count.
- Under contract.
- Homes with an accepted contract that have not closed yet. A live count.
Nearby neighborhoods to Gardner
| Neighborhood | Median sale |
|---|---|
| Cypress Creek | $347,740 |
| Prairie Trace | $469,970 |
| Symphony Farms | $585,440 |
| Willow Springs | $352,000 |
| St. Johns Trace | $315,000 |
| St. Johns Highlands | $341,525 |
How we compute these
- Market.
- Market type is set by months of supply — how long it would take to sell every home for sale at the current pace. Under ~4 months favors sellers (low inventory, faster sales, homes near or above asking); over ~6 favors buyers (more choice, more negotiating room). 4–6 is balanced.
- Months supply.
- How many months it would take to sell every home now for sale at the pace of the last 90 days: homes for sale ÷ (closings in the last 90 days ÷ 3).
- For sale.
- Homes listed as active right now. A live count, not a monthly average.
- Days to contract.
- The middle number of days between a home being listed and going under contract, over the last 90 days of closings. It is not days-to-close, and it is not how long today's listings have been sitting. Newly built homes are excluded, because a build finishing is not a market moving.
- Coming soon.
- Homes announced but not yet accepting showings. A live count.
- Under contract.
- Homes with an accepted contract that have not closed yet. A live count.
Search homes nearby Gardner
| Place | Median list |
|---|---|
| Gardner | $427,178 |
| Overland Park | $744,950 |
| Olathe | $628,738 |
| Shawnee | $530,000 |
| Lenexa | $649,950 |
| Leawood | $980,000 |
How we compute these
- Market.
- Market type is set by months of supply — how long it would take to sell every home for sale at the current pace. Under ~4 months favors sellers (low inventory, faster sales, homes near or above asking); over ~6 favors buyers (more choice, more negotiating room). 4–6 is balanced.
- Months supply.
- How many months it would take to sell every home now for sale at the pace of the last 90 days: homes for sale ÷ (closings in the last 90 days ÷ 3).
- Median list.
- The middle asking price among the homes for sale right now. Half are listed above it, half below.
- Days to contract.
- The middle number of days between a home being listed and going under contract, over the last 90 days of closings. It is not days-to-close, and it is not how long today's listings have been sitting. Newly built homes are excluded, because a build finishing is not a market moving.
- For sale.
- Homes listed as active right now. A live count, not a monthly average.
- Coming soon.
- Homes announced but not yet accepting showings. A live count.
- Under contract.
- Homes with an accepted contract that have not closed yet. A live count.
Nearby ZIP codes
| Place | Median list |
|---|---|
| 66030 | $441,900 |
| 66053 | $288,614 |
How we compute these
- Market.
- Market type is set by months of supply — how long it would take to sell every home for sale at the current pace. Under ~4 months favors sellers (low inventory, faster sales, homes near or above asking); over ~6 favors buyers (more choice, more negotiating room). 4–6 is balanced.
- Months supply.
- How many months it would take to sell every home now for sale at the pace of the last 90 days: homes for sale ÷ (closings in the last 90 days ÷ 3).
- Median list.
- The middle asking price among the homes for sale right now. Half are listed above it, half below.
- Days to contract.
- The middle number of days between a home being listed and going under contract, over the last 90 days of closings. It is not days-to-close, and it is not how long today's listings have been sitting. Newly built homes are excluded, because a build finishing is not a market moving.
- For sale.
- Homes listed as active right now. A live count, not a monthly average.
- Coming soon.
- Homes announced but not yet accepting showings. A live count.
- Under contract.
- Homes with an accepted contract that have not closed yet. A live count.
Search homes for sale in every city we cover
How we compute these
- Market.
- Market type is set by months of supply — how long it would take to sell every home for sale at the current pace. Under ~4 months favors sellers (low inventory, faster sales, homes near or above asking); over ~6 favors buyers (more choice, more negotiating room). 4–6 is balanced.
- Months supply.
- How many months it would take to sell every home now for sale at the pace of the last 90 days: homes for sale ÷ (closings in the last 90 days ÷ 3).
- Median list.
- The middle asking price among the homes for sale right now. Half are listed above it, half below.
- Days to contract.
- The middle number of days between a home being listed and going under contract, over the last 90 days of closings. It is not days-to-close, and it is not how long today's listings have been sitting. Newly built homes are excluded, because a build finishing is not a market moving.
- For sale.
- Homes listed as active right now. A live count, not a monthly average.
- Coming soon.
- Homes announced but not yet accepting showings. A live count.
- Under contract.
- Homes with an accepted contract that have not closed yet. A live count.
Search for homes in popular markets
| Market | For sale |
|---|---|
| Heritage Ranch | 29 |
| Canyon Lakes | 25 |
| Ruskin Heights | 25 |
| Garrett Ranch | 24 |
| Tomahawk Valley | 23 |
| Seven Bridges | 23 |
How we compute these
- Market.
- Market type is set by months of supply — how long it would take to sell every home for sale at the current pace. Under ~4 months favors sellers (low inventory, faster sales, homes near or above asking); over ~6 favors buyers (more choice, more negotiating room). 4–6 is balanced.
- For sale.
- Homes listed as active right now. A live count, not a monthly average.
Or go wider still county, metro and state
How we compute these
- Market.
- Market type is set by months of supply — how long it would take to sell every home for sale at the current pace. Under ~4 months favors sellers (low inventory, faster sales, homes near or above asking); over ~6 favors buyers (more choice, more negotiating room). 4–6 is balanced.
- Months supply.
- How many months it would take to sell every home now for sale at the pace of the last 90 days: homes for sale ÷ (closings in the last 90 days ÷ 3).
- Median list.
- The middle asking price among the homes for sale right now. Half are listed above it, half below.
- Days to contract.
- The middle number of days between a home being listed and going under contract, over the last 90 days of closings. It is not days-to-close, and it is not how long today's listings have been sitting. Newly built homes are excluded, because a build finishing is not a market moving.
- For sale.
- Homes listed as active right now. A live count, not a monthly average.
- Coming soon.
- Homes announced but not yet accepting showings. A live count.
- Under contract.
- Homes with an accepted contract that have not closed yet. A live count.