
Homes Under Contract in Gardner, KS
56 homes under contract in Gardner · Sorted by Newest Listed

890 N Pear Street, Gardner, KS
New · 2d ago


524 E Hawthorn Street, Gardner, KS


883 N Pear Street, Gardner, KS

17851 Green Road, Gardner, KS
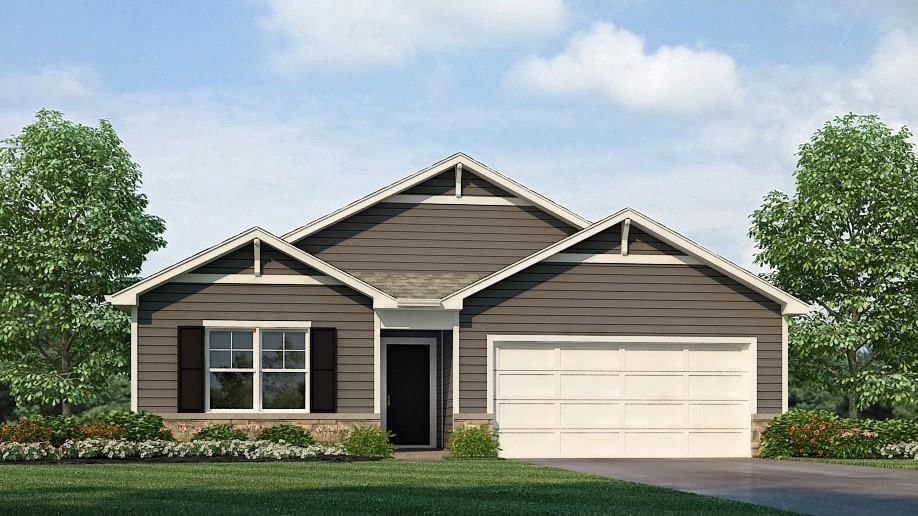


25279 W 177th Terr Street, Gardner, KS


549 S Woodson Lane, Gardner, KS


512 E Cheyenne Street, Gardner, KS


882 N Pear Street, Gardner, KS


847 E Pinewood Street, Gardner, KS

830 N Buckeye Street, Gardner, KS


840 E Cheyenne Street, Gardner, KS


740 E Valerie Lane, Gardner, KS


590 S Pine Street, Gardner, KS


16820 Scott Street, Gardner, KS


571 S Meadowbrook Street, Gardner, KS

858 N Pear Street, Gardner, KS


32493 W 168th Court, Gardner, KS


256 N ALDER Street, Gardner, KS


734 S Cypress Street, Gardner, KS


848 N Alder Street, Gardner, KS


749 S Cypress Street, Gardner, KS


31855 W 171st Street, Gardner, KS

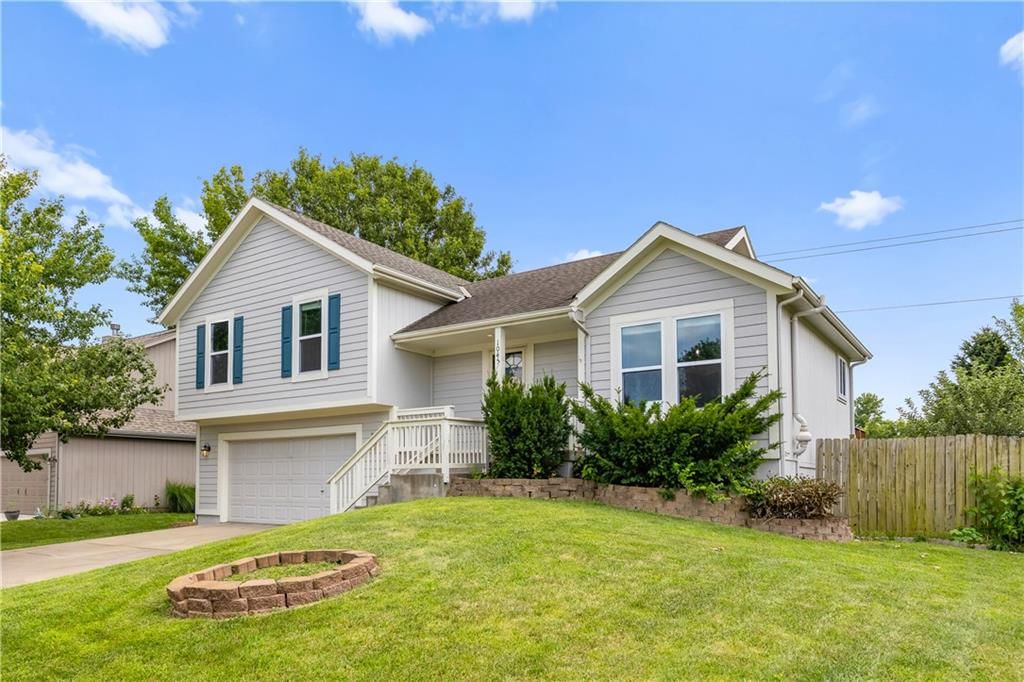
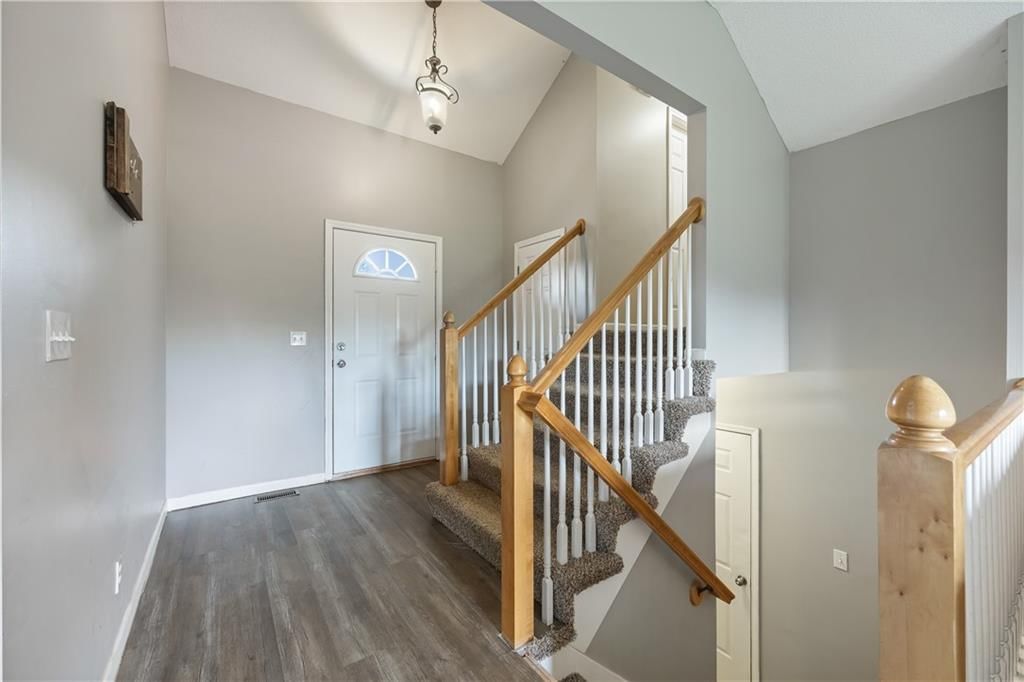
1045 E PUMPKIN RIDGE Street, Gardner, KS


525 Parma Way, Gardner, KS
About Homes Under Contract inGardner, KS
Gardner, KS has 56 homes under contract right now, with a median list price of $441,900 as of Sep 12 These homes under contract were built between 1962 and 2026, ranging from 1,216 to 3,888 square feet.
Homes Under Contract market trendsGardner, KS
Gardner, KS: 95 homes for sale · 14 new in the last 7 days · median asking $441,900 · 36 price reductions · a median of 17 days to contract. 53 homes closed in the last 30 days, at a median of $385,000. At the pace of the last 90 days that is 2.44 months of supply.
| Measure | Aug 2026 |
|---|---|
| Median sale price | $373,552 |
| Median price per sq ft | $218 |
| Median days to contract | 19 |
| Sell-to-list ratio | 100% |
| Homes sold | 52 |
| New listings | 48 |
| Went under contract | 44 |
Homes Under Contract FAQsGardner, KS
How many homes under contract are there in Gardner, KS?
What is the median list price of homes under contract in Gardner, KS?
Schoolsserving Gardner
| School | Median list | |
|---|---|---|
| School districts | ||
| Gardner Edgerton School District | $439,990 | |
| High schools | ||
| Gardner Edgerton | $448,900 | |
| Middle schools | ||
| Pioneer Ridge | $420,065 | |
| Trailridge | $473,990 | |
| Wheatridge | Median— | |
| Elementary schools | ||
| Madison | $411,045 | |
| Nike | $499,000 | |
| Gardner | Median— | |
| Moonlight | Median— | |
| Madison Place | Median— | |
How we compute these
- Median list.
- The middle asking price among the homes for sale right now. Half are listed above it, half below.
- For sale.
- Homes listed as active right now. A live count, not a monthly average.
Newly listedin Gardner, KS
| Address | Price |
|---|---|
| 312 Ghost Creek Lane | Price$357,500 |
| 18424 S Juniper Street | Price$399,000 |
| 644 N Pear Street | Price$335,000 |
| 805 N Buckeye Street | Price$332,995 |
| 829 N Buckeye Street | Price$359,995 |
| 509 Peach Tree Circle | Price$535,000 |
| 837 N Buckeye Street | Price$374,995 |
| 789 N Buckeye Street | Price$314,991 |
| 328 N Cherry Street | Price$370,000 |
| 628 E Dogwood Street | Price$369,950 |
| 17674 Jubilee Street | Price$420,065 |
Recently went under contractin Gardner, KS
| Address | List price |
|---|---|
| 269 W Cheyenne Street | List price$360,000 |
| 28407 W 161st Street | List price$544,500 |
| 890 N Pear Street | List price$338,490 |
| 524 E Hawthorn Street | List price$330,000 |
| 17819 Green Road | List price$464,990 |
| 740 E Valerie Lane | List price$294,900 |
| 590 S Pine Street | List price$360,000 |
| 848 N Alder Street | List price$488,888 |
| 32742 W 175th Terrace | List price$369,990 |
| 840 E Cheyenne Street | List price$392,000 |
| 882 N Pear Street | List price$362,990 |
| 571 S Meadowbrook Street | List price$379,950 |
How we compute these
- Under contract.
- Homes with an accepted contract that have not closed yet. A live count.
- Days to contract.
- The middle number of days between a home being listed and going under contract, over the last 90 days of closings. It is not days-to-close, and it is not how long today's listings have been sitting. Newly built homes are excluded, because a build finishing is not a market moving.
Popular home searchesin Gardner
| Search | For sale |
|---|---|
| Open houses | 5 |
| Luxury homes | 10 |
| Just listed homes | 13 |
| Price-reduced homes | 36 |
| Coming soon homes | For sale2 |
| Homes under contract | 56 |
How we compute these
- For sale.
- Homes listed as active right now. A live count, not a monthly average.
Homes by pricein Gardner
| Price range | For sale |
|---|---|
| Under $300,000 | For sale6 |
| Under $400,000 | 41 |
| Under $500,000 | 64 |
| Under $600,000 | 81 |
| Under $750,000 | 86 |
| Under $1,000,000 | 87 |
| $300,000 – $400,000 | 35 |
| $400,000 – $500,000 | 23 |
| $500,000 – $600,000 | 18 |
| $600,000 – $750,000 | For sale5 |
| $1M and above | 10 |
How we compute these
- For sale.
- Homes listed as active right now. A live count, not a monthly average.
Homes by featurein Gardner
How we compute these
- For sale.
- Homes listed as active right now. A live count, not a monthly average.
Search by property typein Gardner
| Property type | Median sale |
|---|---|
| Single Family | $369,413 |
| Townhouse | Median— |
| Half Duplex | Median— |
| Lots / Land | $195,300 |
How we compute these
- Market.
- Market type is set by months of supply — how long it would take to sell every home for sale at the current pace. Under ~4 months favors sellers (low inventory, faster sales, homes near or above asking); over ~6 favors buyers (more choice, more negotiating room). 4–6 is balanced.
- Months supply.
- How many months it would take to sell every home now for sale at the pace of the last 90 days: homes for sale ÷ (closings in the last 90 days ÷ 3).
- For sale.
- Homes listed as active right now. A live count, not a monthly average.
- Days to contract.
- The middle number of days between a home being listed and going under contract, over the last 90 days of closings. It is not days-to-close, and it is not how long today's listings have been sitting. Newly built homes are excluded, because a build finishing is not a market moving.
- Coming soon.
- Homes announced but not yet accepting showings. A live count.
- Under contract.
- Homes with an accepted contract that have not closed yet. A live count.
Nearby neighborhoodsto Gardner
| Neighborhood | Median sale |
|---|---|
| Cypress Creek | $347,740 |
| Prairie Trace | $469,975 |
| Symphony Farms | $585,220 |
| Willow Springs | $356,500 |
| St. Johns Highlands | $341,050 |
| Double Gate | $325,000 |
How we compute these
- Market.
- Market type is set by months of supply — how long it would take to sell every home for sale at the current pace. Under ~4 months favors sellers (low inventory, faster sales, homes near or above asking); over ~6 favors buyers (more choice, more negotiating room). 4–6 is balanced.
- Months supply.
- How many months it would take to sell every home now for sale at the pace of the last 90 days: homes for sale ÷ (closings in the last 90 days ÷ 3).
- For sale.
- Homes listed as active right now. A live count, not a monthly average.
- Days to contract.
- The middle number of days between a home being listed and going under contract, over the last 90 days of closings. It is not days-to-close, and it is not how long today's listings have been sitting. Newly built homes are excluded, because a build finishing is not a market moving.
- Coming soon.
- Homes announced but not yet accepting showings. A live count.
- Under contract.
- Homes with an accepted contract that have not closed yet. A live count.
Search homesnearby Gardner
| Place | Median list |
|---|---|
| Gardner | $441,900 |
| Overland Park | $749,950 |
| Olathe | $634,975 |
| Shawnee | $550,000 |
| Lenexa | $654,575 |
| Leawood | $982,109 |
How we compute these
- Market.
- Market type is set by months of supply — how long it would take to sell every home for sale at the current pace. Under ~4 months favors sellers (low inventory, faster sales, homes near or above asking); over ~6 favors buyers (more choice, more negotiating room). 4–6 is balanced.
- Months supply.
- How many months it would take to sell every home now for sale at the pace of the last 90 days: homes for sale ÷ (closings in the last 90 days ÷ 3).
- Median list.
- The middle asking price among the homes for sale right now. Half are listed above it, half below.
- Days to contract.
- The middle number of days between a home being listed and going under contract, over the last 90 days of closings. It is not days-to-close, and it is not how long today's listings have been sitting. Newly built homes are excluded, because a build finishing is not a market moving.
- For sale.
- Homes listed as active right now. A live count, not a monthly average.
- Coming soon.
- Homes announced but not yet accepting showings. A live count.
- Under contract.
- Homes with an accepted contract that have not closed yet. A live count.
NearbyZIP codes
| Place | Median list |
|---|---|
| 66030 | $449,450 |
| 66053 | $294,774 |
How we compute these
- Market.
- Market type is set by months of supply — how long it would take to sell every home for sale at the current pace. Under ~4 months favors sellers (low inventory, faster sales, homes near or above asking); over ~6 favors buyers (more choice, more negotiating room). 4–6 is balanced.
- Months supply.
- How many months it would take to sell every home now for sale at the pace of the last 90 days: homes for sale ÷ (closings in the last 90 days ÷ 3).
- Median list.
- The middle asking price among the homes for sale right now. Half are listed above it, half below.
- Days to contract.
- The middle number of days between a home being listed and going under contract, over the last 90 days of closings. It is not days-to-close, and it is not how long today's listings have been sitting. Newly built homes are excluded, because a build finishing is not a market moving.
- For sale.
- Homes listed as active right now. A live count, not a monthly average.
- Coming soon.
- Homes announced but not yet accepting showings. A live count.
- Under contract.
- Homes with an accepted contract that have not closed yet. A live count.
Search homes for salein every city we cover
How we compute these
- Market.
- Market type is set by months of supply — how long it would take to sell every home for sale at the current pace. Under ~4 months favors sellers (low inventory, faster sales, homes near or above asking); over ~6 favors buyers (more choice, more negotiating room). 4–6 is balanced.
- Months supply.
- How many months it would take to sell every home now for sale at the pace of the last 90 days: homes for sale ÷ (closings in the last 90 days ÷ 3).
- Median list.
- The middle asking price among the homes for sale right now. Half are listed above it, half below.
- Days to contract.
- The middle number of days between a home being listed and going under contract, over the last 90 days of closings. It is not days-to-close, and it is not how long today's listings have been sitting. Newly built homes are excluded, because a build finishing is not a market moving.
- For sale.
- Homes listed as active right now. A live count, not a monthly average.
- Coming soon.
- Homes announced but not yet accepting showings. A live count.
- Under contract.
- Homes with an accepted contract that have not closed yet. A live count.
Search for homesin popular markets
| Market | For sale |
|---|---|
| Heritage Ranch | 30 |
| Canyon Lakes | 25 |
| Ruskin Heights | 24 |
| Garrett Ranch | 24 |
| Seven Bridges | 24 |
| Tomahawk Valley | 23 |
How we compute these
- Market.
- Market type is set by months of supply — how long it would take to sell every home for sale at the current pace. Under ~4 months favors sellers (low inventory, faster sales, homes near or above asking); over ~6 favors buyers (more choice, more negotiating room). 4–6 is balanced.
- For sale.
- Homes listed as active right now. A live count, not a monthly average.
Or go wider stillcounty, metro and state
How we compute these
- Market.
- Market type is set by months of supply — how long it would take to sell every home for sale at the current pace. Under ~4 months favors sellers (low inventory, faster sales, homes near or above asking); over ~6 favors buyers (more choice, more negotiating room). 4–6 is balanced.
- Months supply.
- How many months it would take to sell every home now for sale at the pace of the last 90 days: homes for sale ÷ (closings in the last 90 days ÷ 3).
- Median list.
- The middle asking price among the homes for sale right now. Half are listed above it, half below.
- Days to contract.
- The middle number of days between a home being listed and going under contract, over the last 90 days of closings. It is not days-to-close, and it is not how long today's listings have been sitting. Newly built homes are excluded, because a build finishing is not a market moving.
- For sale.
- Homes listed as active right now. A live count, not a monthly average.
- Coming soon.
- Homes announced but not yet accepting showings. A live count.
- Under contract.
- Homes with an accepted contract that have not closed yet. A live count.