
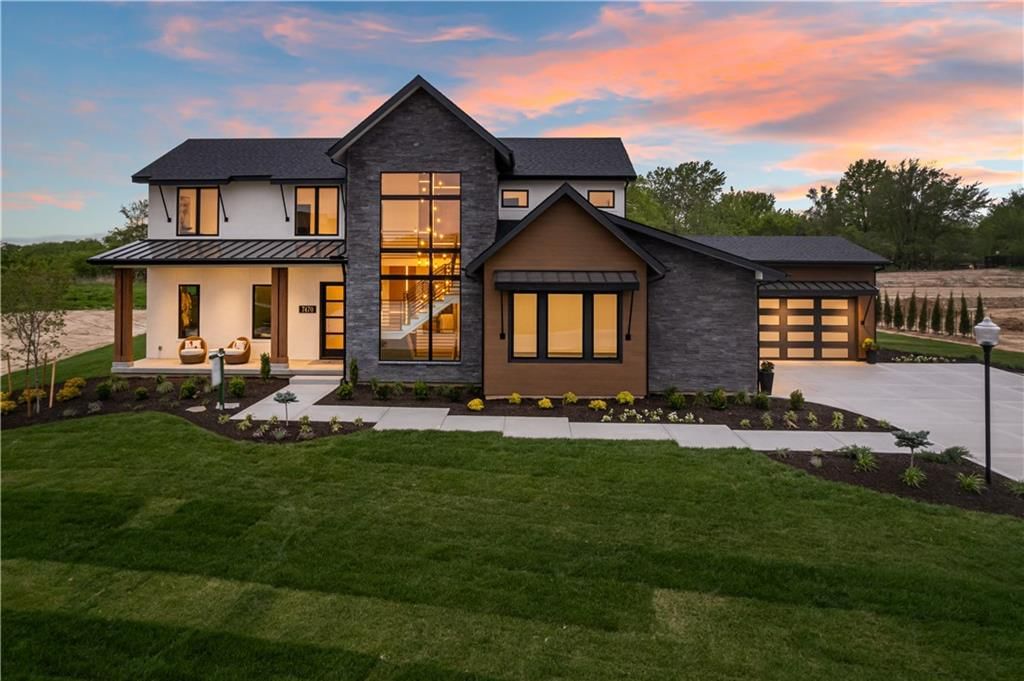
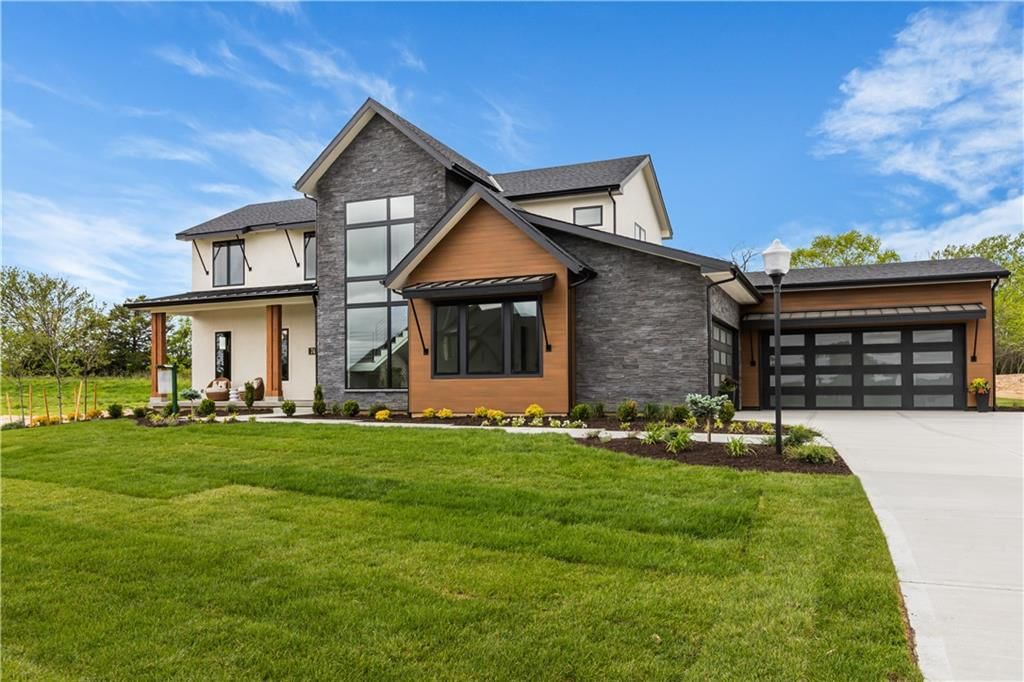
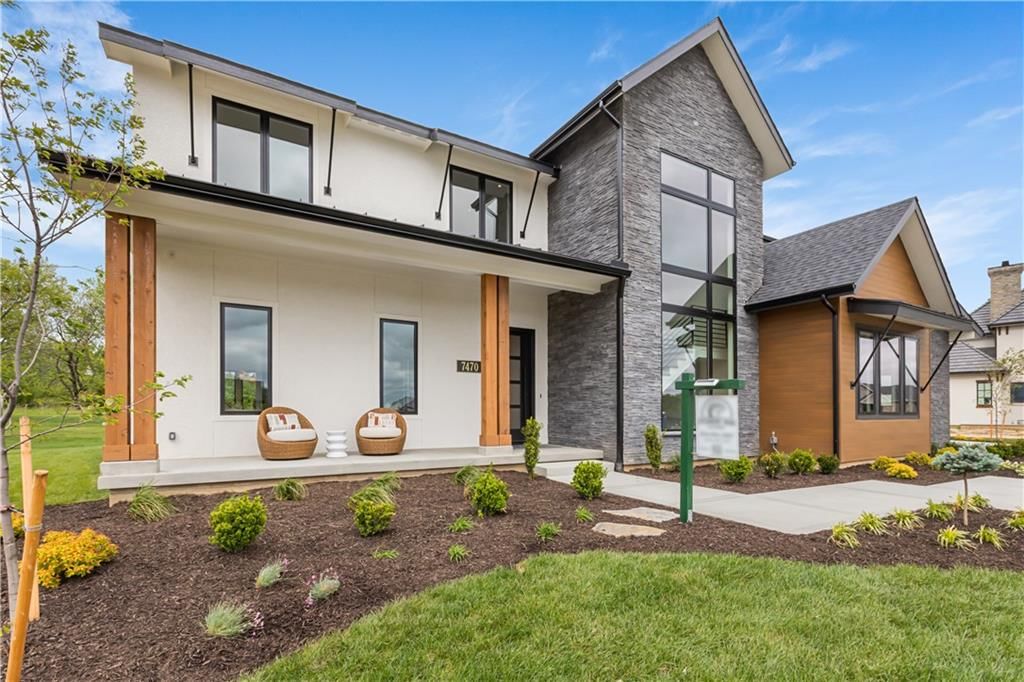
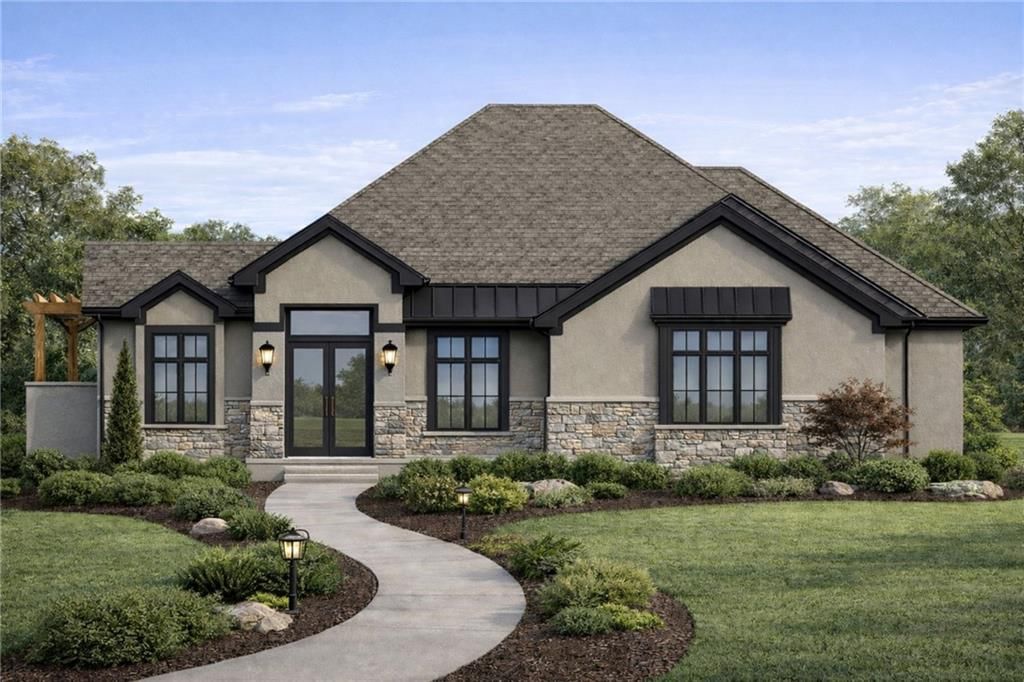
Luxury Homes for Sale in Platte County, MO
· 44 homes fit this search44 homes fit this search · Sorted by Newest Listed
Real estate in Platte County, Missouri
Platte County, MO has about 43,902 households and a median household income of $96,227. Roughly 67% of homes are owner-occupied, the median owner's home value is $345,100, 47% of adults hold a bachelor's degree or higher. The average commute runs 24.3 minutes. About 110,371 people live in Platte County, MO, per the U.S. Census Bureau's American Community Survey 5-year estimate (2020–2024). New construction is still adding supply: 22 building permits were issued in September 2026.
The first question most buyers ask about Platte County is simple: is there actually time to think, or will I lose every house I look at? It means buyers can do their homework, get inspections, and negotiate without making panicked decisions.
Park Hill School District draws families here specifically, and its reputation is earned; the district consistently ranks among the best in the Kansas City metro. Kansas City proper bleeds into the county's southern edge near Riverside, where a mix of price points and quick highway access to the urban core appeals to buyers who want metro convenience without the full metro price tag.
Weston is the county's wildcard and arguably its most characterful city — a 19th-century tobacco town turned weekend destination with brick-street charm, antique shops, a working distillery, and homes that range from century-old Victorians to newer builds on acreage. The pace is genuinely slower, the community tight-knit, and the commute to Kansas City honest about being 45 minutes on a good day. Platte City, the county seat, sits in the middle of the market both geographically and in price, offering practical, no-nonsense housing stock with decent highway access and a small-town feel that some buyers find refreshing and others find limiting. Dearborn and Edgerton are the county's northern fringe — agricultural roots, larger lots, lower price points, and buyers who know exactly what trade-offs they are making.
For sellers, the honest read is this: the market is not handing anyone a windfall, but it is functional and consistent. Pricing to the data — not to hope — and presenting a home in clean, move-in condition remains the fastest path to a contract. For buyers, the inventory and days-on-market numbers are actually good news that many KC-area buyers have not found yet. Platte County rewards the prepared buyer who moves decisively once they have done the work.
Housing market trends in Platte County, Missouri
| Measure | Oct 2026 | Sep 2026 | Oct 2025 |
|---|---|---|---|
| Median sale price | $413,038 | $405,000 | $405,400 |
| Median price per sq ft | $189 | $182 | $178 |
| Median days to contract | 22 | 29 | 30 |
| Sell-to-list ratio | 100% | 100% | 100% |
| Homes sold | 148 | 139 | 126 |
| New listings | 193 | 189 | 142 |
| Went under contract | 113 | 129 | 99 |




Popular home searches in Platte County
| Search | For sale |
|---|---|
| Open houses | For sale11 |
| Luxury homes | For sale44 |
| Just listed homes | For sale38 |
| Price-reduced homes | For sale187 |
| Coming soon homes | For sale33 |
| Homes under contract | For sale178 |
How we compute these
- For sale.
- Homes listed as active right now. A live count, not a monthly average.
Homes by price in Platte County
| Price range | For sale |
|---|---|
| Under $200,000 | For sale60 |
| Under $300,000 | For sale124 |
| Under $400,000 | For sale202 |
| Under $500,000 | For sale277 |
How we compute these
- For sale.
- Homes listed as active right now. A live count, not a monthly average.
Search homes in Platte County
| City | Market (Market type is set by months of supply — how long it would take to sell every home for sale at the current pace. Under ~4 months favors sellers (low inventory, faster sales, homes near or above asking); over ~6 favors buyers (more choice, more negotiating room). 4–6 is balanced.) | Months supply | Median list | Sell-to-list | Days to contract | For sale | Coming soon | Under contract |
|---|---|---|---|---|---|---|---|---|
| Kansas City | Seller's | 3.8 mo | Median$260,000 | 100% | 21d | 2,173 | 98 | 759 |
| Parkville | Seller's | 4 mo | Median$510,000 | 97% | 35d | 104 | 6 | 29 |
| Platte City | Balanced | 4.5 mo | Median$525,000 | 97% | 25d | 86 | 4 | 23 |
| Riverside | Balanced | 5.2 mo | Median$742,450 | 101% | 24d | 28 | 0 | 8 |
| Weston | Balanced | 5.4 mo | Median$430,000 | 96% | 28d | 14 | 1 | 7 |
How we compute these
- Market.
- Market type is set by months of supply — how long it would take to sell every home for sale at the current pace. Under ~4 months favors sellers (low inventory, faster sales, homes near or above asking); over ~6 favors buyers (more choice, more negotiating room). 4–6 is balanced.
- Months supply.
- How many months it would take to sell every home now for sale at the pace of the last 90 days: homes for sale ÷ (closings in the last 90 days ÷ 3).
- Median list.
- The middle asking price among the homes for sale right now. Half are listed above it, half below.
- Days to contract.
- The middle number of days between a home being listed and going under contract, over the last 90 days of closings. It is not days-to-close, and it is not how long today's listings have been sitting. Newly built homes are excluded, because a build finishing is not a market moving.
- For sale.
- Homes listed as active right now. A live count, not a monthly average.
- Coming soon.
- Homes announced but not yet accepting showings. A live count.
- Under contract.
- Homes with an accepted contract that have not closed yet. A live count.