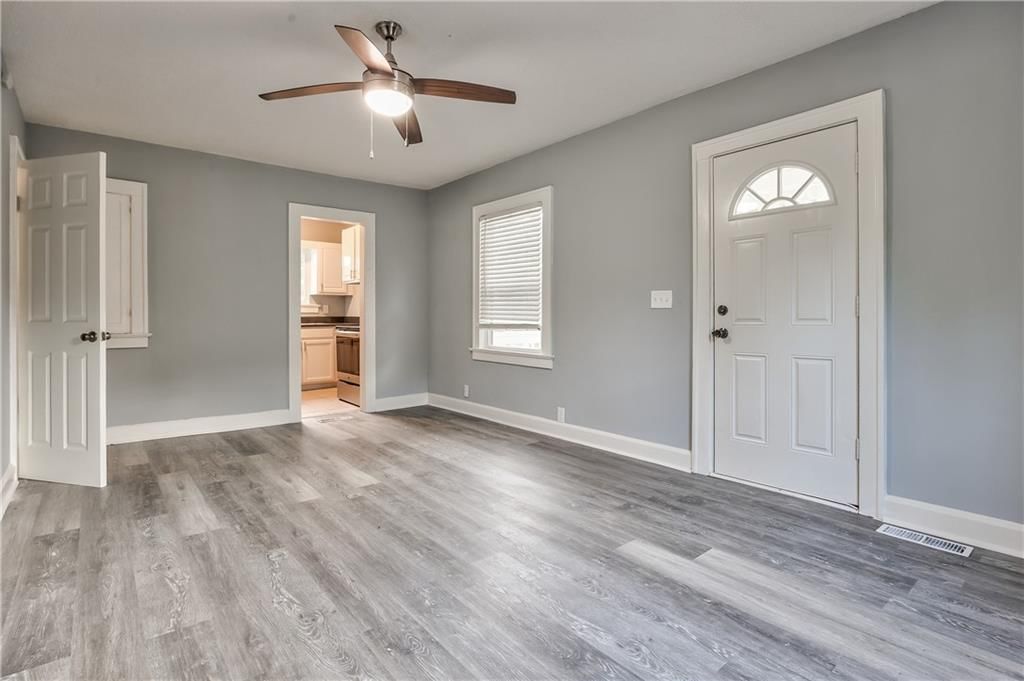
64053 (Kansas City, MO) Real Estate & Homes For Sale

22 homes for sale in 64053 · Sorted by Newest Listed

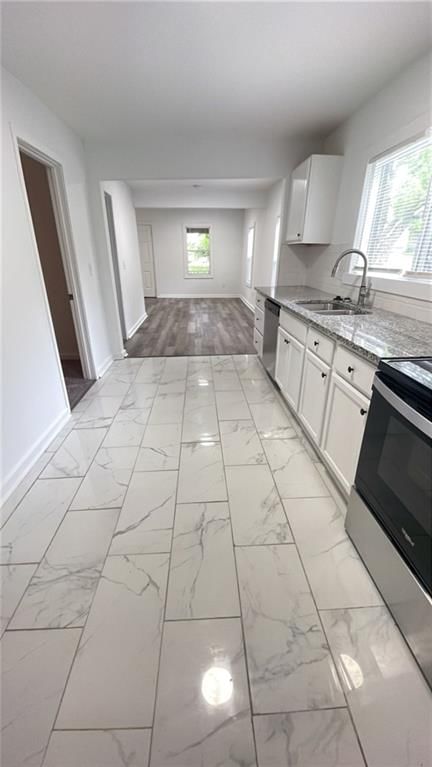
822 S Hardy Avenue, Independence, MO
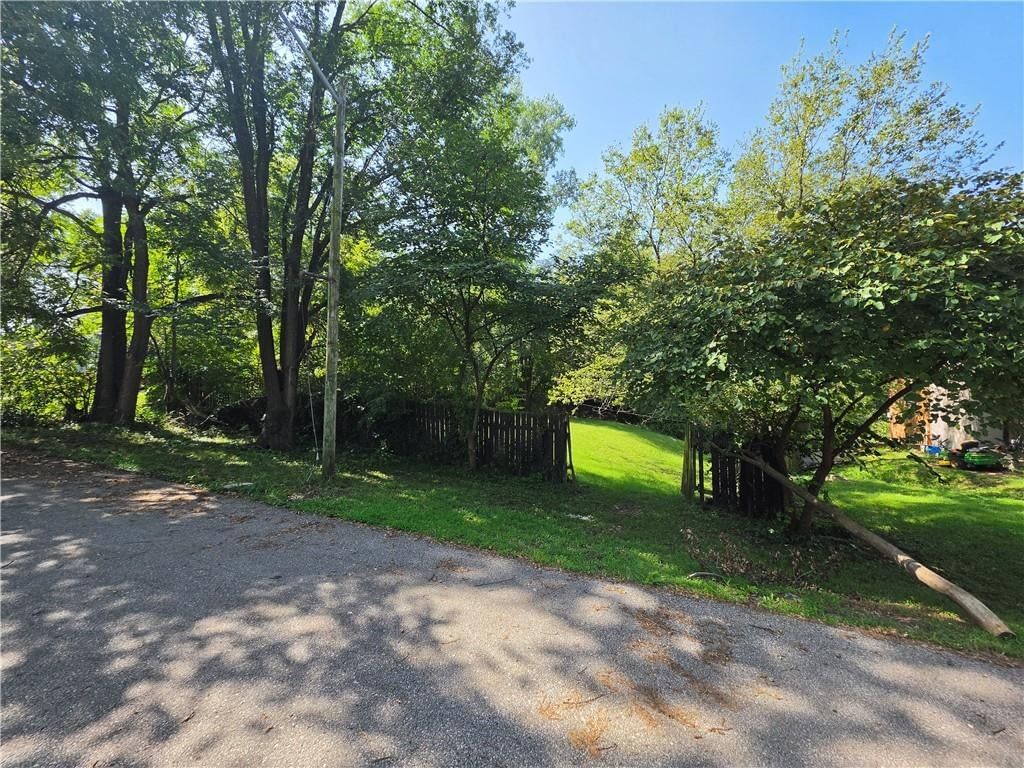
Tile floors
$180,0006d active
3beds|2baths|1,500sqft|House for sale

822 S Hardy Avenue, Independence, MO
New · 6d ago

851 20 20 5
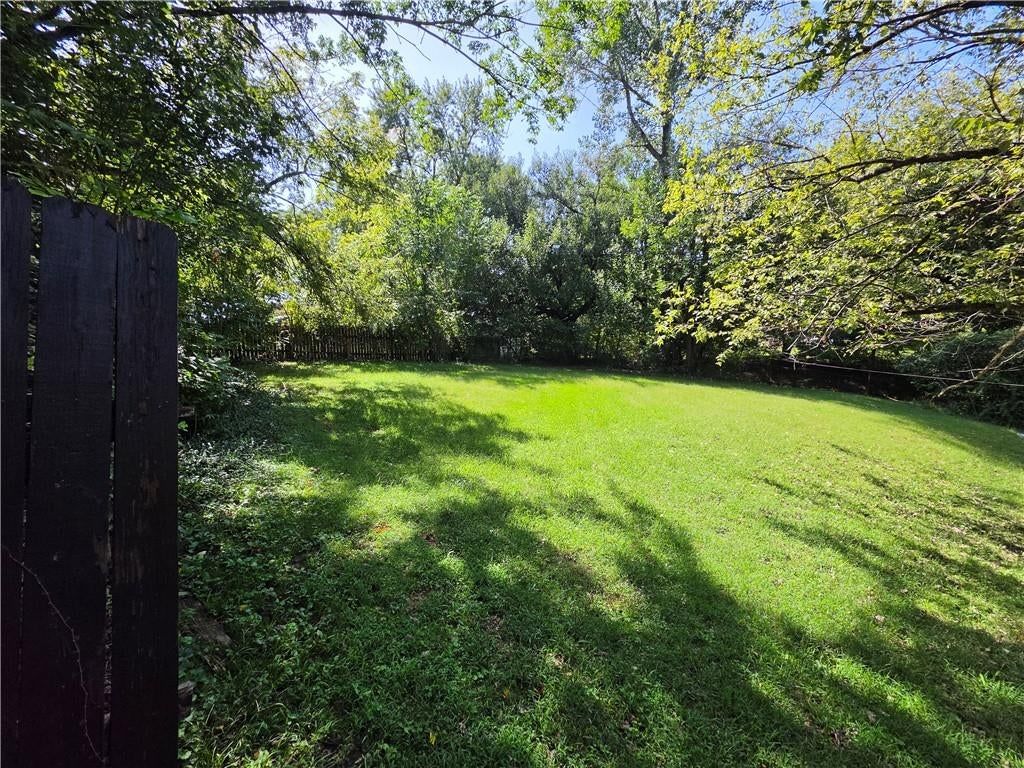
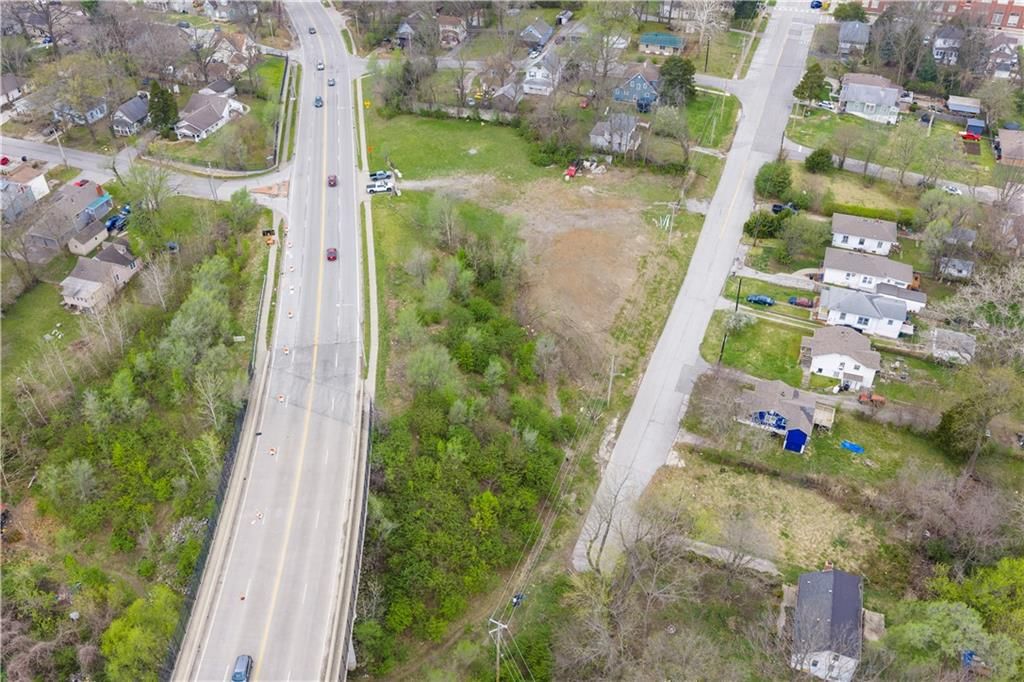
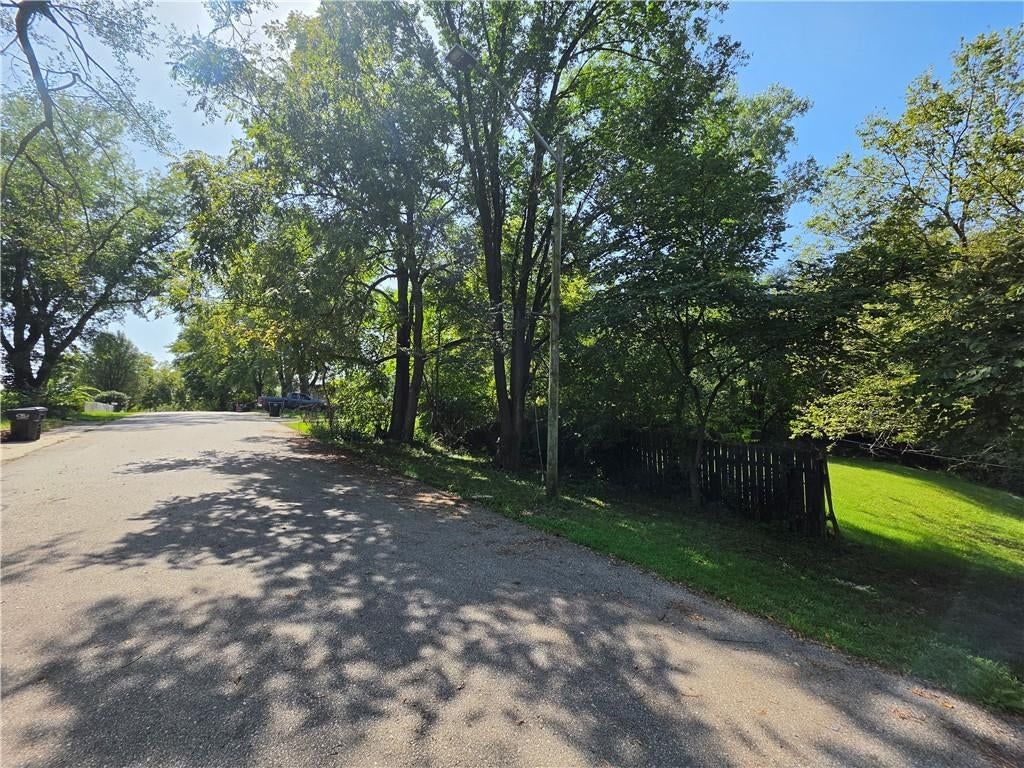
230 Glenwood Avenue, Independence, MO
10 days
$10,00010d active
9,148sqft lot|Land for sale

230 Glenwood Avenue, Independence, MO

105 6 6 3
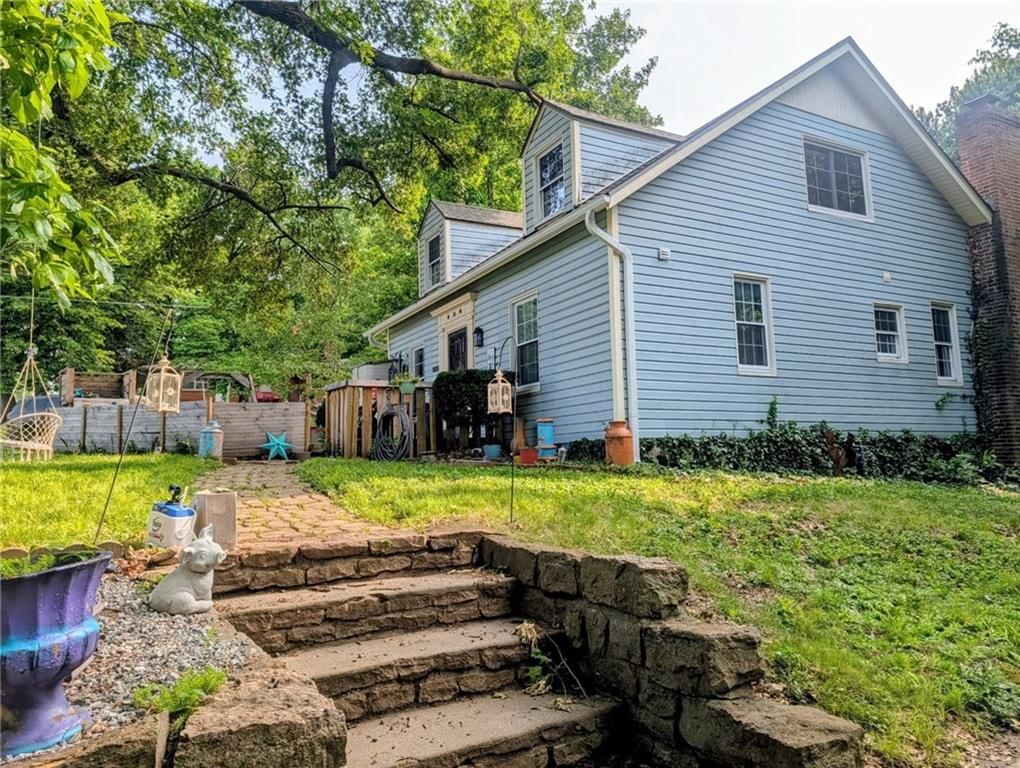
332 N Cedar Avenue, Independence, MO
Price Cut · $10K
$40,00015d active
3beds|1baths|1,068sqft|House for sale

332 N Cedar Avenue, Independence, MO

190 6 9 2
10522 E 6th Street S, Independence, MO
Single-story
$130,00019d active
1beds|1baths|600sqft|House for sale

10522 E 6th Street S, Independence, MO

602 30 14 7
10107 E 11th Street, Independence, MO
Price Cut · $5K
$219,90022d active
3beds|2baths|1,600sqft|House for sale

10107 E 11th Street, Independence, MO

1,417 36 42 5
8725 E Smart Avenue, Independence, MO
Price Cut · $10K
$95,00027d active
2beds|1baths|910sqft|House for sale

8725 E Smart Avenue, Independence, MO

1,097 38 14 16
706 S Northern Boulevard, Independence, MO
Price Cut · $4K
$183,50043d active
3beds|2baths|1,050sqft|House for sale

706 S Northern Boulevard, Independence, MO

1,204 85 29 12
619 S Ash Avenue, Independence, MO
Single-story
$160,00043d active
2beds|1baths|852sqft|House for sale

619 S Ash Avenue, Independence, MO

802 29 13 5
637 S Huttig Avenue, Independence, MO
Single-story
$180,00054d active
2beds|1baths|870sqft|House for sale

637 S Huttig Avenue, Independence, MO

456 20 16 6
10117 E 10th Street S, Independence, MO
Single-story
$180,00083d active
2beds|1baths|995sqft|House for sale

10117 E 10th Street S, Independence, MO

748 21 18 6
9617 E Independence Avenue, Independence, MO
5+ bedrooms
$190,00087d active
5beds|2baths|3,060sqft|House for sale

9617 E Independence Avenue, Independence, MO

389 23 16 8
530 S Willow Avenue, Independence, MO
Price Cut · $15K
$104,900104d active
3beds|1baths|1,160sqft|House for sale

530 S Willow Avenue, Independence, MO

703 27 16 5
110 N Ditzler Avenue, Independence, MO
Single-story
$40,000106d active
2beds|1baths|1,092sqft|House for sale

110 N Ditzler Avenue, Independence, MO

147 9 10 3
820 S Glenwood Avenue, Independence, MO
Hardwood floors
$200,000125d active
4beds|3.5baths|1,536sqft|House for sale

820 S Glenwood Avenue, Independence, MO

107 3 6 3
9827 E Independence Avenue, Independence, MO
Price Cut · $40K
$79,000177d active
1.03acres|Land for sale

9827 E Independence Avenue, Independence, MO

172 5 8 5
139 N Ditzler Avenue, Independence, MO
Single-story
$139,900181d active
3beds|1baths|835sqft|House for sale

139 N Ditzler Avenue, Independence, MO

183 5 8 3
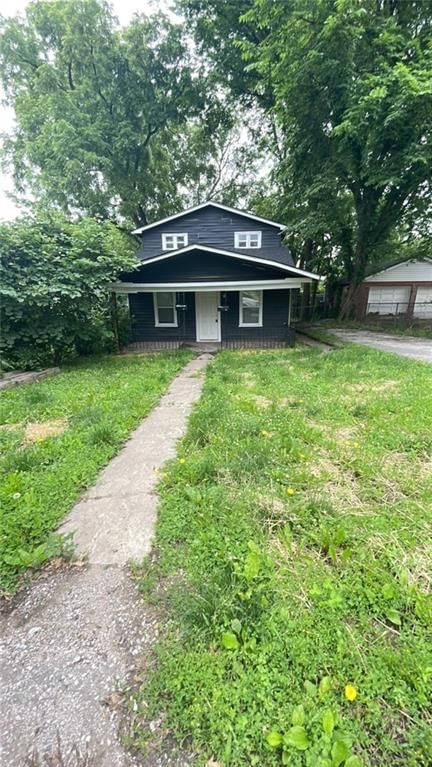
141 N Ditzler Avenue, Independence, MO
Single-story
$119,900181d active
2beds|1baths|758sqft|House for sale

141 N Ditzler Avenue, Independence, MO
234 6 10 3
807 S Hardy Avenue, Independence, MO
Price Cut · $10K
$185,000241d active
1,344sqft|House for sale

807 S Hardy Avenue, Independence, MO

178 10 8 3
128 S Hardy Avenue, Independence, MO
Price Cut · $5K
$40,000247d active
13,237sqft lot|Land for sale

128 S Hardy Avenue, Independence, MO

143 5 8 3
804 S Home Avenue, Independence, MO
Price Cut · $21K
$184,000328d active
3beds|1baths|1,431sqft|House for sale

804 S Home Avenue, Independence, MO
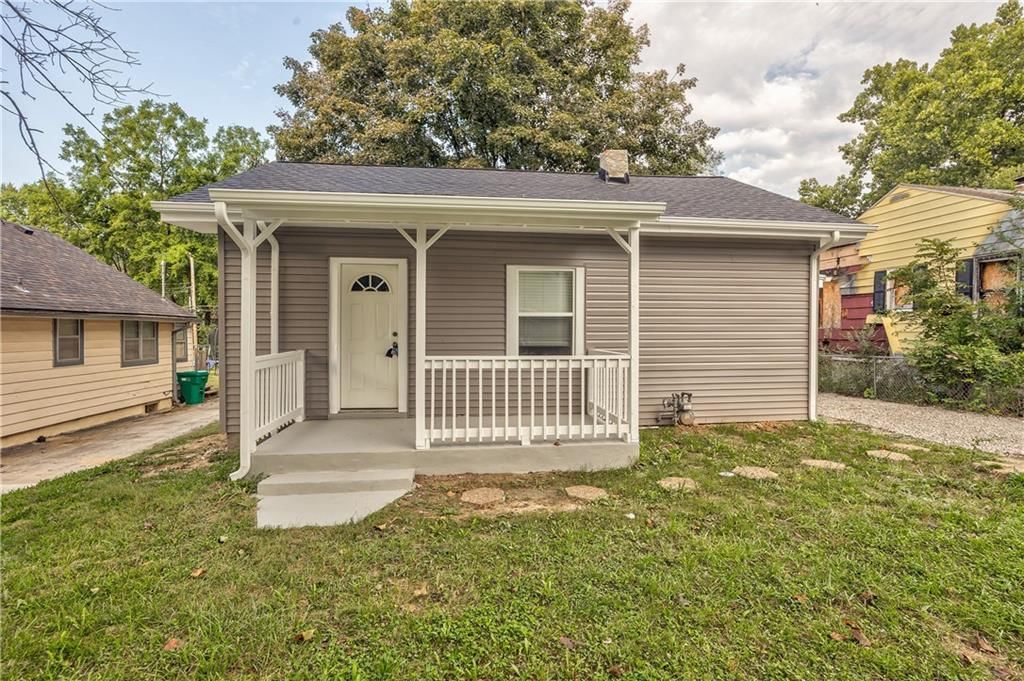
523 43 14 3
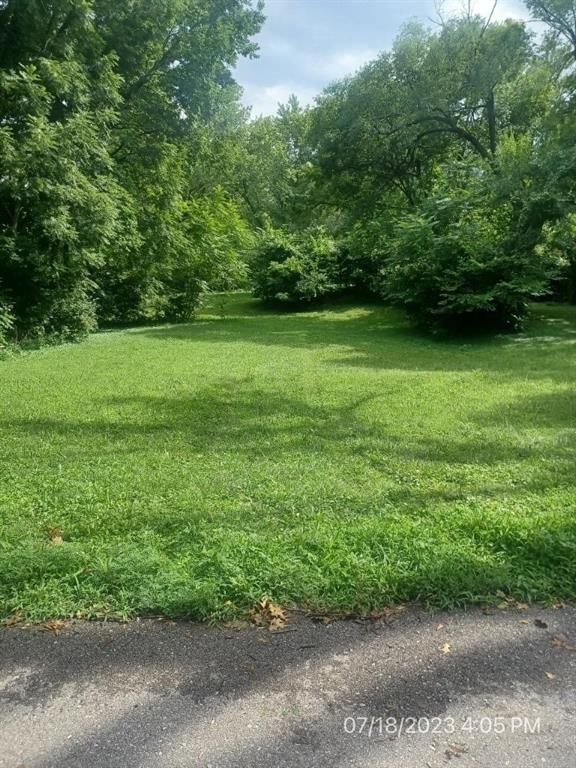
1810 S Maywood Avenue, Independence, MO
Price Cut · $33K
$135,000409d active
2beds|2baths|660sqft|House for sale

1810 S Maywood Avenue, Independence, MO

213 11 11 3
10300 E Norledge Avenue, Independence, MO
Price Cut · $40K
$59,9951117d active
Land for sale

10300 E Norledge Avenue, Independence, MO

143 5 8 3

Start with the numbers that matter to you

Real estate in 64053 in Kansas City, Missouri

Kansas City 64053 has about 2,450 households and a median household income of $48,790. Roughly 52% of homes are owner-occupied, the median owner's home value is $78,400, 12% of adults hold a bachelor's degree or higher. The average commute runs 23.6 minutes. The Census counts 6,817 residents.

Kansas City 64053 has 22 homes for sale right now, with a median list price of $135,000 as of Sep 30 These homes were built between 1905 and 1950, ranging from 600 to 3,060 square feet.

Sources — demographics: U.S. Census Bureau, American Community Survey 5-year estimates (2023) · listings, prices and days on market: Heartland MLS as distributed by MLS GRID, as of September 30, 2026 · analysis and home values: HouseLoop calculations

Real estate FAQs about 64053

How many homes are for sale in 64053?

22 homes are for sale in 64053 on HouseLoop right now, and 12 more are under contract. The list updates from the Heartland MLS feed through the day.

How much does a home in 64053 cost?

The median list price in 64053 is $135,000 across the 22 homes for sale today.

What is the price per square foot in 64053?

Homes for sale in 64053 list at a median of $137 per square foot.

How fast do homes sell in 64053?

Homes in 64053 take a median of 8 days to go under contract.

How many homes have sold in 64053 in the past year?

86 homes have sold in 64053 over the last 12 months.

When were the homes in 64053 built?

The homes for sale in 64053 break down as built before 1960 (18).

Are there older homes for sale in 64053?

18 of the homes for sale in 64053 were built before 1960.

How big are the homes for sale in 64053?

By finished area above grade, they run under 1,500 sq ft (13), 1,500-1,999 sq ft (3).

How big are the lots in 64053?

Lot sizes in 64053 run under 1/4 acre (17), 1/4 to 1/2 acre (3).

How many bedrooms do homes in 64053 have?

The homes for sale in 64053 are 2 bedrooms (7), 3 bedrooms (7).

Do homes in 64053 have HOA fees?

22 of the homes for sale in 64053 carry no HOA at all.

Are there single-story homes for sale in 64053?

12 single-story homes are for sale in 64053 today.

What schools serve 64053?

64053 is served primarily by Independence School District. Attendance boundaries can change year to year, so confirm the school for a specific address before you rely on it.

What is the most common flooring in 64053 homes?

Across the homes for sale in 64053, the flooring listed most often is carpet (5), wood (3).

What are the nearby places to 64053?

Buyers looking at 64053 also search Independence, Lee's Summit, Blue Springs, Raytown, Grandview. Each has its own page with live listings and the same market numbers.

Verify school attendance boundaries before relying on them — boundaries can change year-to-year.

① 64053 itself — the place you are on

Schools serving 64053

SchoolMedian list
School districts
Independence School DistrictMedian—
High schools
Van HornMedian—
Middle schools
NowlinMedian—
Elementary schools
FairmountMedian—
How we compute these
Median list.
The middle asking price among the homes for sale right now. Half are listed above it, half below.
For sale.
Homes listed as active right now. A live count, not a monthly average.

Newly listed in 64053

AddressPrice
822 S Hardy AvenuePrice$180,000

Recently went under contract in 64053

AddressList price
8716 E Roberts StreetList price$78,000
8841 E Winner RoadList price$110,000
227 S Ash AvenueList price$160,000
10557 E Lake DriveList price$177,500
10120 GOLF AvenueList price$129,900
620 S Hardy AvenueList price$150,000
10033 E Wilson RoadList price$60,000
534 S Huttig AvenueList price$204,999
121 N ASH AvenueList price$39,900
705 S Fairview AvenueList price$182,500
549 S Huttig AvenueList price$175,000
144 N Hardy AvenueList price$80,000
How we compute these
Under contract.
Homes with an accepted contract that have not closed yet. A live count.
Days to contract.
The middle number of days between a home being listed and going under contract, over the last 90 days of closings. It is not days-to-close, and it is not how long today's listings have been sitting. Newly built homes are excluded, because a build finishing is not a market moving.

Homes by feature in 64053

FeatureFor sale
No HOA22
Homes with a public sewerFor sale19
Built before 196018
Under 1/4 acre17
Homes with public waterFor sale17
Under 1,500 sq ft13
Single story12
Two or more storiesFor sale10
Homes with off-street parkingFor sale8
2 bedrooms7
3 bedrooms7
Homes with a full basementFor sale7
How we compute these
For sale.
Homes listed as active right now. A live count, not a monthly average.
② Its neighborhoods — one step out

Nearby neighborhoods to Kansas City

NeighborhoodMedian sale
Ruskin Heights$155,000
Marlborough Heights$165,500
Armour Hills$475,000
Ruskin Hills$171,500
Red Bridge$350,000
Terrace Lake Gardens$195,000
How we compute these
Market.
Market type is set by months of supply — how long it would take to sell every home for sale at the current pace. Under ~4 months favors sellers (low inventory, faster sales, homes near or above asking); over ~6 favors buyers (more choice, more negotiating room). 4–6 is balanced.
Months supply.
How many months it would take to sell every home now for sale at the pace of the last 90 days: homes for sale ÷ (closings in the last 90 days ÷ 3).
For sale.
Homes listed as active right now. A live count, not a monthly average.
Days to contract.
The middle number of days between a home being listed and going under contract, over the last 90 days of closings. It is not days-to-close, and it is not how long today's listings have been sitting. Newly built homes are excluded, because a build finishing is not a market moving.
Coming soon.
Homes announced but not yet accepting showings. A live count.
Under contract.
Homes with an accepted contract that have not closed yet. A live count.
③ Nearby cities — two steps out

Search homes nearby 64053

PlaceMedian list
Kansas City$260,000
Independence$225,000
Lee's Summit$528,500
Blue Springs$399,900
Raytown$237,500
Grandview$259,900
How we compute these
Market.
Market type is set by months of supply — how long it would take to sell every home for sale at the current pace. Under ~4 months favors sellers (low inventory, faster sales, homes near or above asking); over ~6 favors buyers (more choice, more negotiating room). 4–6 is balanced.
Months supply.
How many months it would take to sell every home now for sale at the pace of the last 90 days: homes for sale ÷ (closings in the last 90 days ÷ 3).
Median list.
The middle asking price among the homes for sale right now. Half are listed above it, half below.
Days to contract.
The middle number of days between a home being listed and going under contract, over the last 90 days of closings. It is not days-to-close, and it is not how long today's listings have been sitting. Newly built homes are excluded, because a build finishing is not a market moving.
For sale.
Homes listed as active right now. A live count, not a monthly average.
Coming soon.
Homes announced but not yet accepting showings. A live count.
Under contract.
Homes with an accepted contract that have not closed yet. A live count.
④ Zip codes, every city, then wider — widest

Nearby ZIP codes

PlaceMedian list
64119$244,200
64114$295,000
64131$228,000
64134$178,000
64113$499,000
64111$330,000
How we compute these
Market.
Market type is set by months of supply — how long it would take to sell every home for sale at the current pace. Under ~4 months favors sellers (low inventory, faster sales, homes near or above asking); over ~6 favors buyers (more choice, more negotiating room). 4–6 is balanced.
Months supply.
How many months it would take to sell every home now for sale at the pace of the last 90 days: homes for sale ÷ (closings in the last 90 days ÷ 3).
Median list.
The middle asking price among the homes for sale right now. Half are listed above it, half below.
Days to contract.
The middle number of days between a home being listed and going under contract, over the last 90 days of closings. It is not days-to-close, and it is not how long today's listings have been sitting. Newly built homes are excluded, because a build finishing is not a market moving.
For sale.
Homes listed as active right now. A live count, not a monthly average.
Coming soon.
Homes announced but not yet accepting showings. A live count.
Under contract.
Homes with an accepted contract that have not closed yet. A live count.

Search homes for sale in every city we cover

CityMedian list
Archie$275,000
AvondaleMedian—
Basehor$468,500
Belton$350,000
BirminghamMedian—
Blue Springs$399,900
How we compute these
Market.
Market type is set by months of supply — how long it would take to sell every home for sale at the current pace. Under ~4 months favors sellers (low inventory, faster sales, homes near or above asking); over ~6 favors buyers (more choice, more negotiating room). 4–6 is balanced.
Months supply.
How many months it would take to sell every home now for sale at the pace of the last 90 days: homes for sale ÷ (closings in the last 90 days ÷ 3).
Median list.
The middle asking price among the homes for sale right now. Half are listed above it, half below.
Days to contract.
The middle number of days between a home being listed and going under contract, over the last 90 days of closings. It is not days-to-close, and it is not how long today's listings have been sitting. Newly built homes are excluded, because a build finishing is not a market moving.
For sale.
Homes listed as active right now. A live count, not a monthly average.
Coming soon.
Homes announced but not yet accepting showings. A live count.
Under contract.
Homes with an accepted contract that have not closed yet. A live count.

Search for homes in popular markets

MarketFor sale
Heritage Ranch28
Canyon Lakes27
Seven Bridges26
Garrett Ranch25
Ruskin Heights22
Tomahawk Valley22
How we compute these
Market.
Market type is set by months of supply — how long it would take to sell every home for sale at the current pace. Under ~4 months favors sellers (low inventory, faster sales, homes near or above asking); over ~6 favors buyers (more choice, more negotiating room). 4–6 is balanced.
For sale.
Homes listed as active right now. A live count, not a monthly average.

Or go wider still county, metro and state

PlaceMedian list
Jackson County, MO$275,000
Clay County, MO$382,000
Cass County, MO$364,950
Platte County, MO$499,000
Johnson County, KS$621,230
Wyandotte County, KS$249,000
Leavenworth County, KS$280,000
Miami County, KS$325,000
Kansas City metroMedian—
How we compute these
Market.
Market type is set by months of supply — how long it would take to sell every home for sale at the current pace. Under ~4 months favors sellers (low inventory, faster sales, homes near or above asking); over ~6 favors buyers (more choice, more negotiating room). 4–6 is balanced.
Months supply.
How many months it would take to sell every home now for sale at the pace of the last 90 days: homes for sale ÷ (closings in the last 90 days ÷ 3).
Median list.
The middle asking price among the homes for sale right now. Half are listed above it, half below.
Days to contract.
The middle number of days between a home being listed and going under contract, over the last 90 days of closings. It is not days-to-close, and it is not how long today's listings have been sitting. Newly built homes are excluded, because a build finishing is not a market moving.
For sale.
Homes listed as active right now. A live count, not a monthly average.
Coming soon.
Homes announced but not yet accepting showings. A live count.
Under contract.
Homes with an accepted contract that have not closed yet. A live count.