
Cates Addition, Kansas City MO Real Estate & Homes For Sale
· 3 homes for sale in Cates Addition3 homes for sale in Cates Addition · Sorted by Newest Listed
Real estate in Cates Addition, Kansas City, Missouri
Cates Addition, Kansas City has 3 homes for sale right now, with a median list price of $335,000. These homes were built in 1890. They are 1,800 square feet.
Housing market trends in Cates Addition, Kansas City, Missouri
As of Oct 22, 2026, Cates Addition, Kansas City: 3 homes for sale · 3 new in the last 7 days · median asking $335,000.
3
Homes for sale in Cates Addition
$335,000
Median list price
No closed sales since April 2026.
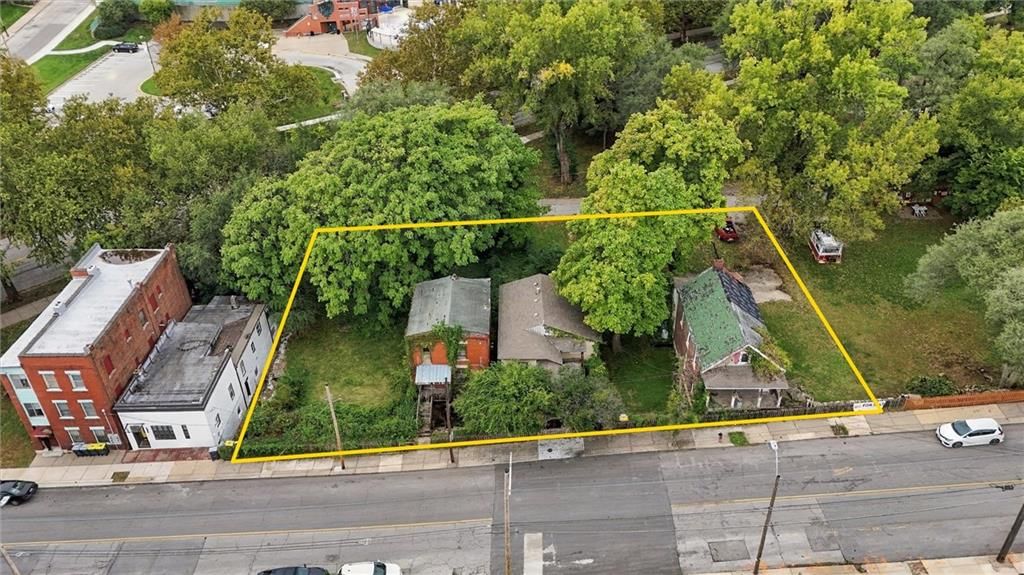
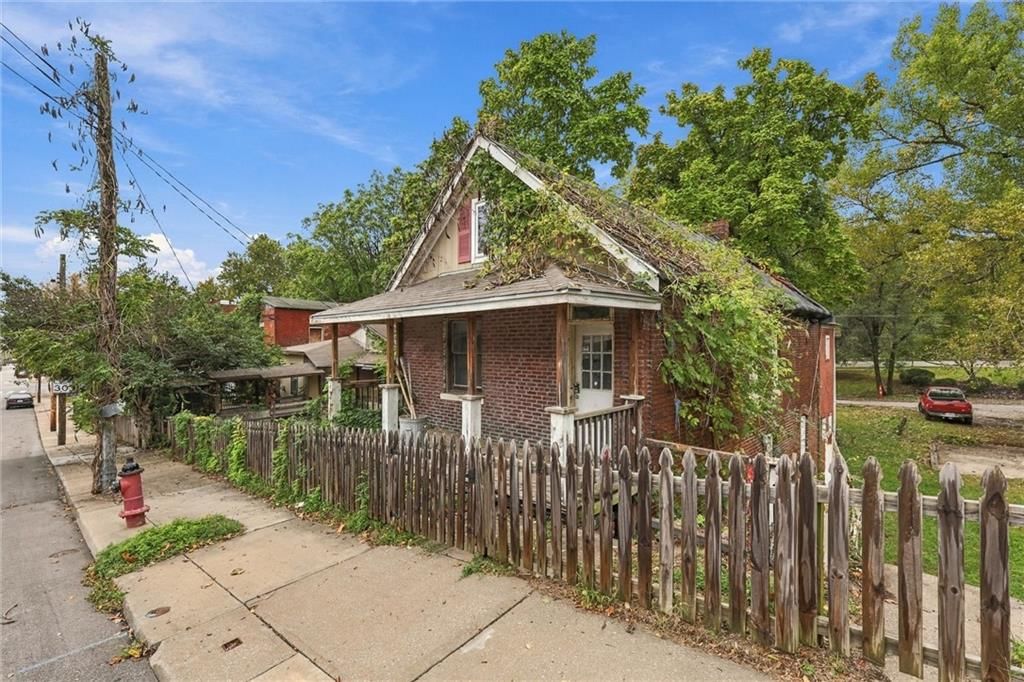
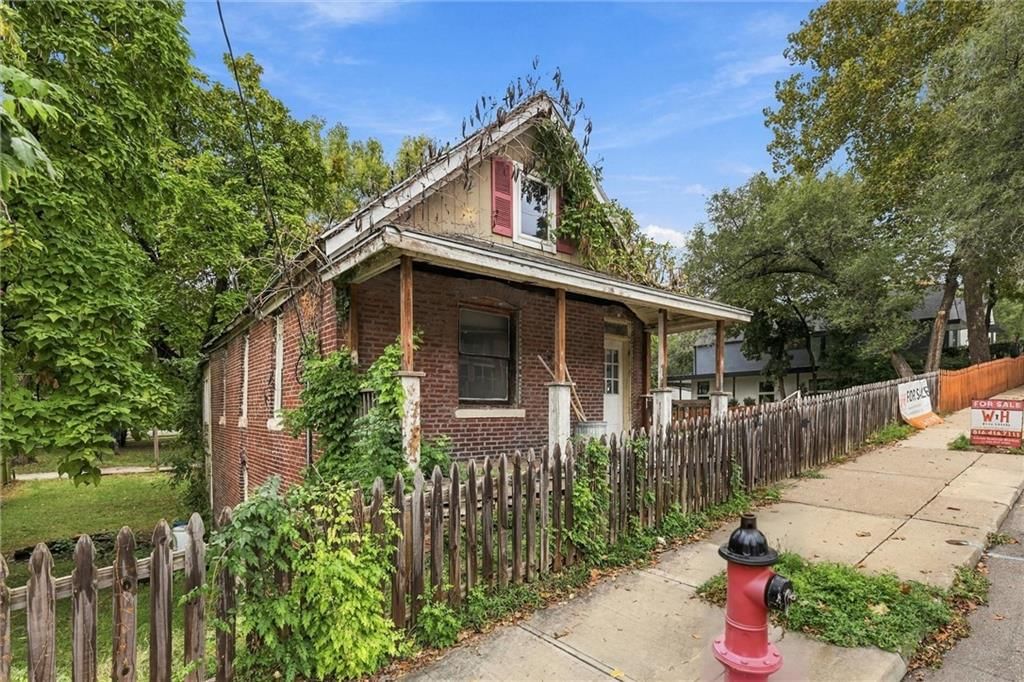
18 photos
5 days
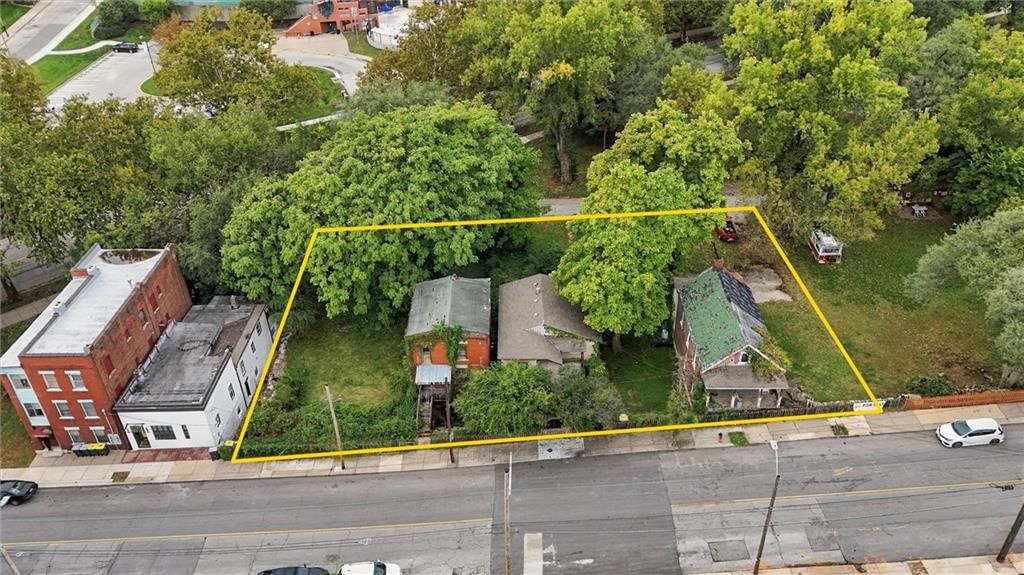
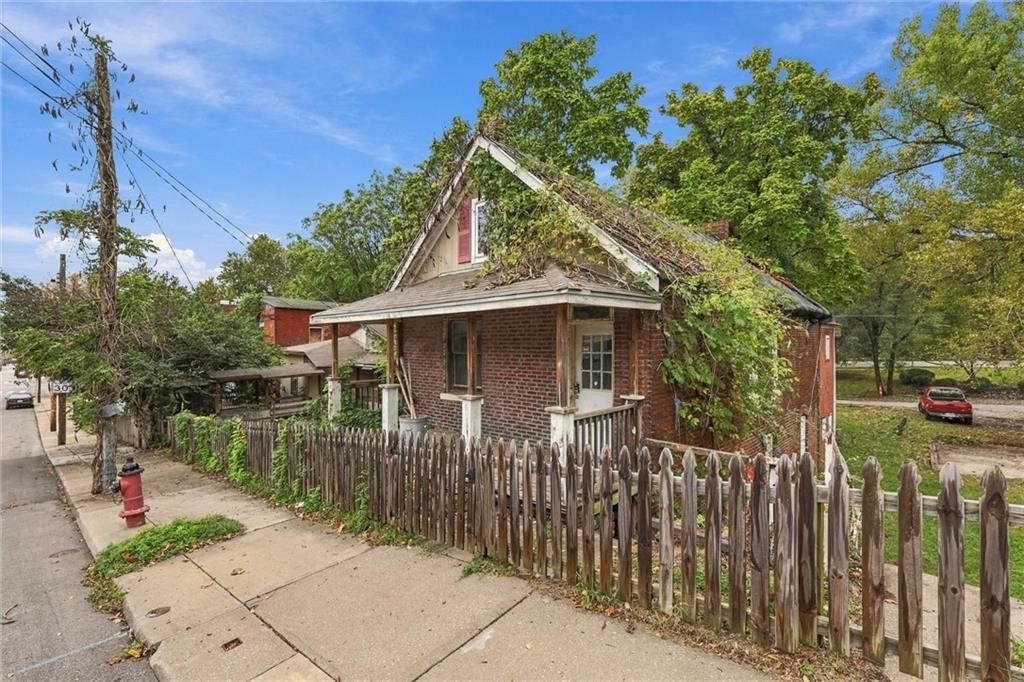
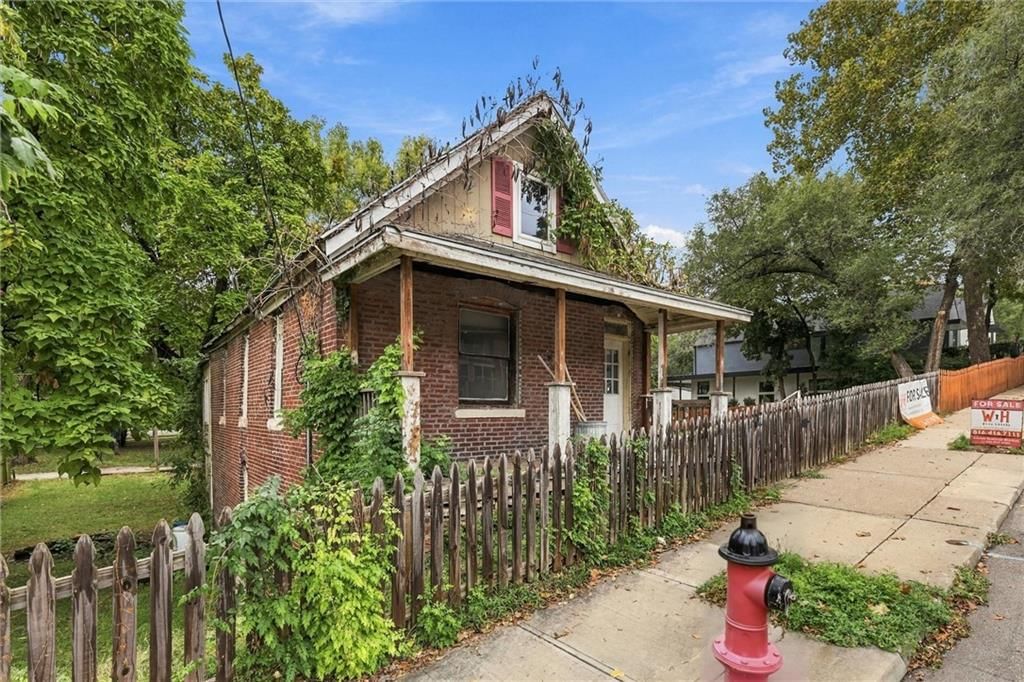
18 photos
5 days
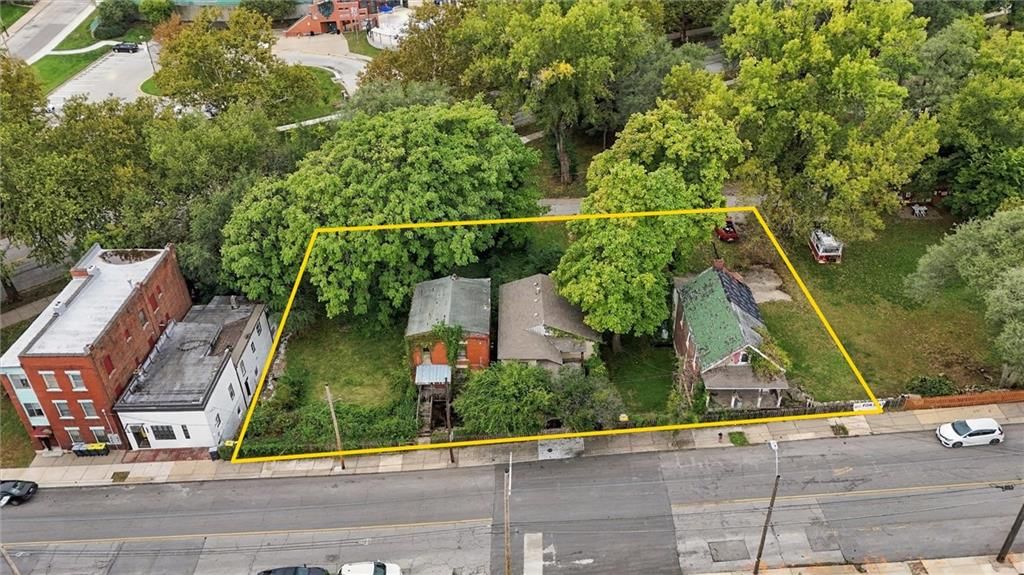
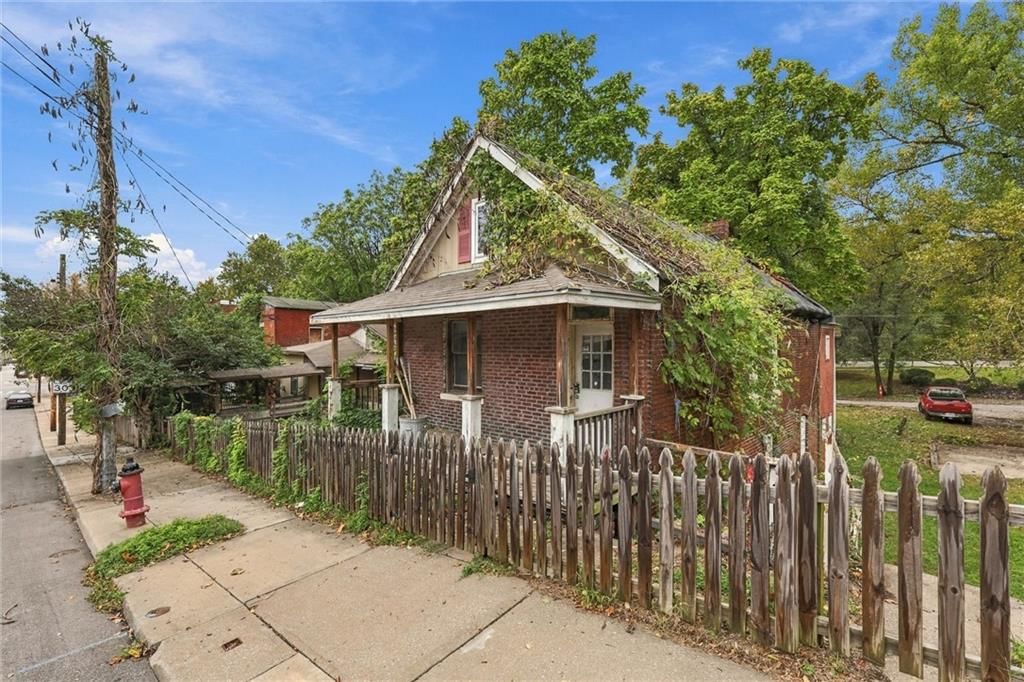
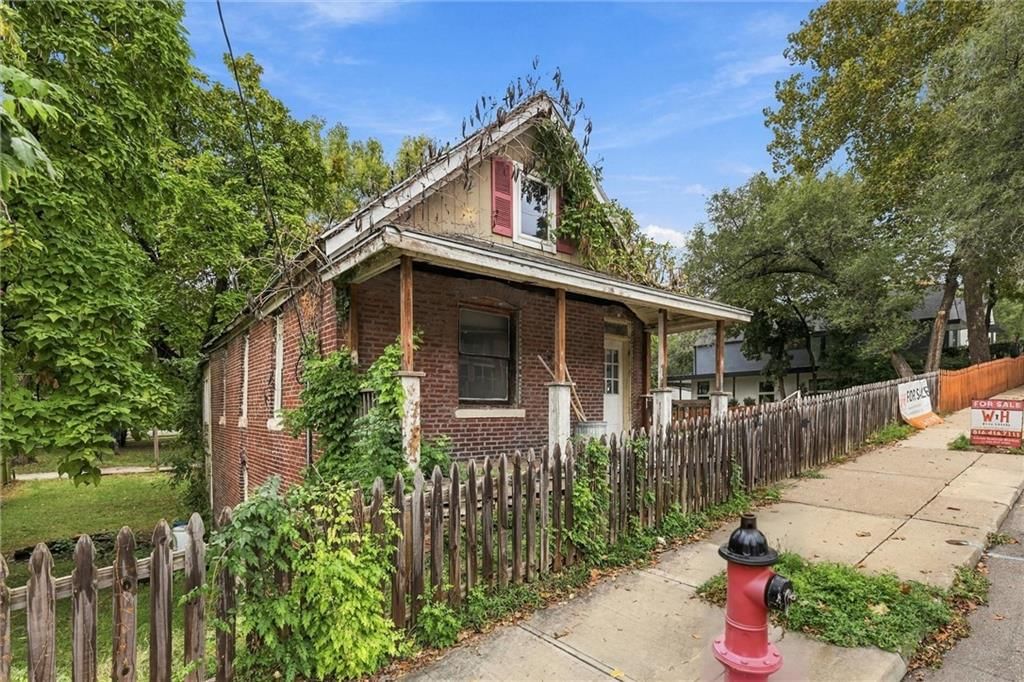
18 photos
5 days
② Its neighborhoods — one step out
Nearby neighborhoods to Cates Addition
| Neighborhood | Market (Market type is set by months of supply — how long it would take to sell every home for sale at the current pace. Under ~4 months favors sellers (low inventory, faster sales, homes near or above asking); over ~6 favors buyers (more choice, more negotiating room). 4–6 is balanced.) | Months supply | For sale | Median sale | Sell-to-list | Days to contract | Coming soon | Under contract |
|---|---|---|---|---|---|---|---|---|
| Ruskin Heights | Seller's | 3 mo | 16 | Median$150,000 | 100% | 22d | 0 | 14 |
| Marlborough Heights | Seller's | 3.7 mo | 16 | Median$165,500 | 101% | 36d | 0 | 11 |
| Armour Hills | Strong Seller's | 0.9 mo | 4 | Median$478,000 | 104% | 10d | 3 | 4 |
| Ruskin Hills | Seller's | 3.6 mo | 11 | Median$173,000 | 102% | 30d | 0 | 1 |
| Red Bridge | Seller's | 3.2 mo | 9 | Median$352,500 | 101% | 15d | 3 | 4 |
How we compute these
- Market.
- Market type is set by months of supply — how long it would take to sell every home for sale at the current pace. Under ~4 months favors sellers (low inventory, faster sales, homes near or above asking); over ~6 favors buyers (more choice, more negotiating room). 4–6 is balanced.
- Months supply.
- How many months it would take to sell every home now for sale at the pace of the last 90 days: homes for sale ÷ (closings in the last 90 days ÷ 3).
- For sale.
- Homes listed as active right now. A live count, not a monthly average.
- Days to contract.
- The middle number of days between a home being listed and going under contract, over the last 90 days of closings. It is not days-to-close, and it is not how long today's listings have been sitting. Newly built homes are excluded, because a build finishing is not a market moving.
- Coming soon.
- Homes announced but not yet accepting showings. A live count.
- Under contract.
- Homes with an accepted contract that have not closed yet. A live count.
③ Nearby cities — two steps out
Search homes nearby Cates Addition
| Place | Market (Market type is set by months of supply — how long it would take to sell every home for sale at the current pace. Under ~4 months favors sellers (low inventory, faster sales, homes near or above asking); over ~6 favors buyers (more choice, more negotiating room). 4–6 is balanced.) | Months supply | Median list | Sell-to-list | Days to contract | For sale | Coming soon | Under contract |
|---|---|---|---|---|---|---|---|---|
| Kansas City | Seller's | 4 mo | Median$265,000 | 100% | 21d | 2,126 | 110 | 831 |
| Independence | Seller's | 3.2 mo | Median$225,000 | 99% | 20d | 421 | 21 | 167 |
| Lee's Summit | Seller's | 2.8 mo | Median$500,000 | 98% | 20d | 399 | 27 | 208 |
| Blue Springs | Seller's | 2.6 mo | Median$390,000 | 99% | 18d | 195 | 6 | 124 |
| Raytown | Seller's | 3.2 mo | Median$215,000 | 97% | 23d | 115 | 8 | 34 |
How we compute these
- Market.
- Market type is set by months of supply — how long it would take to sell every home for sale at the current pace. Under ~4 months favors sellers (low inventory, faster sales, homes near or above asking); over ~6 favors buyers (more choice, more negotiating room). 4–6 is balanced.
- Months supply.
- How many months it would take to sell every home now for sale at the pace of the last 90 days: homes for sale ÷ (closings in the last 90 days ÷ 3).
- Median list.
- The middle asking price among the homes for sale right now. Half are listed above it, half below.
- Days to contract.
- The middle number of days between a home being listed and going under contract, over the last 90 days of closings. It is not days-to-close, and it is not how long today's listings have been sitting. Newly built homes are excluded, because a build finishing is not a market moving.
- For sale.
- Homes listed as active right now. A live count, not a monthly average.
- Coming soon.
- Homes announced but not yet accepting showings. A live count.
- Under contract.
- Homes with an accepted contract that have not closed yet. A live count.
④ Zip codes
Nearby ZIP codes
| Place | Market (Market type is set by months of supply — how long it would take to sell every home for sale at the current pace. Under ~4 months favors sellers (low inventory, faster sales, homes near or above asking); over ~6 favors buyers (more choice, more negotiating room). 4–6 is balanced.) | Months supply | Median list | Sell-to-list | Days to contract | For sale | Coming soon | Under contract |
|---|---|---|---|---|---|---|---|---|
| 64119 | Seller's | 2.4 mo | Median$264,950 | 99% | 19d | 94 | 7 | 37 |
| 64114 | Seller's | 2.9 mo | Median$295,000 | 100% | 14d | 104 | 12 | 53 |
| 64131 | Seller's | 2.4 mo | Median$230,000 | 98% | 21d | 58 | 6 | 37 |
| 64134 | Seller's ▲ | 3.5 mo | Median$191,000 | 99% | 24d | 85 | 4 | 38 |
How we compute these
- Market.
- Market type is set by months of supply — how long it would take to sell every home for sale at the current pace. Under ~4 months favors sellers (low inventory, faster sales, homes near or above asking); over ~6 favors buyers (more choice, more negotiating room). 4–6 is balanced.
- Months supply.
- How many months it would take to sell every home now for sale at the pace of the last 90 days: homes for sale ÷ (closings in the last 90 days ÷ 3).
- Median list.
- The middle asking price among the homes for sale right now. Half are listed above it, half below.
- Days to contract.
- The middle number of days between a home being listed and going under contract, over the last 90 days of closings. It is not days-to-close, and it is not how long today's listings have been sitting. Newly built homes are excluded, because a build finishing is not a market moving.
- For sale.
- Homes listed as active right now. A live count, not a monthly average.
- Coming soon.
- Homes announced but not yet accepting showings. A live count.
- Under contract.
- Homes with an accepted contract that have not closed yet. A live count.