
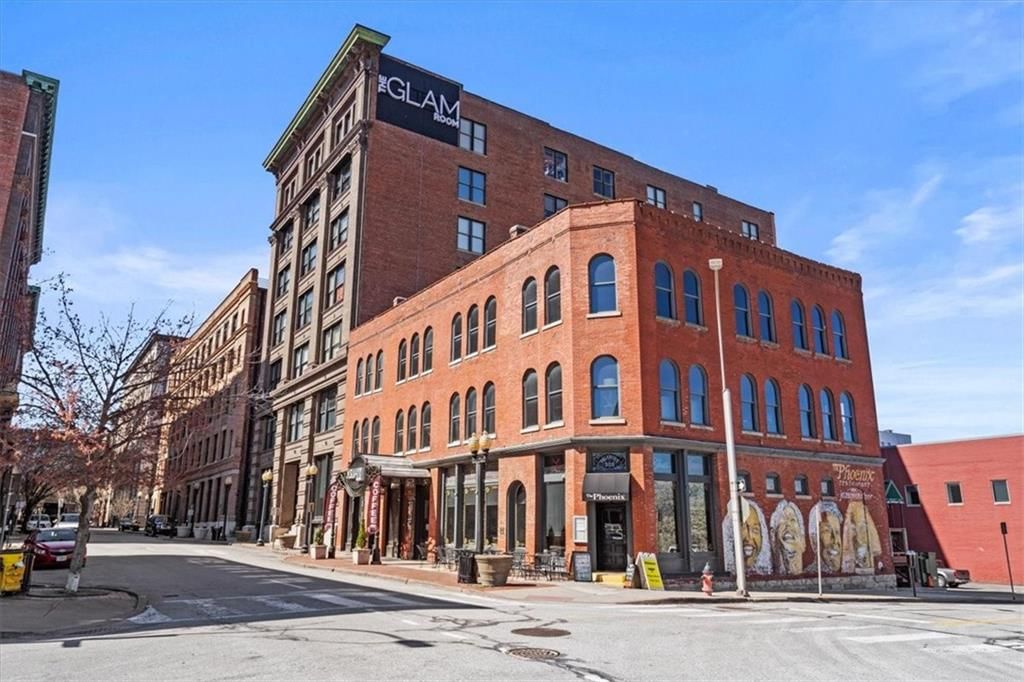
64105 (Kansas City, MO) Real Estate & Homes For Sale
· 39 homes for sale in 64105HouseLoop Vision identified 11 homes for sale in 64105 with white kitchen cabinets, 1 with a freestanding tub, 23 with a home gym, 3 with a big backyard, 7 with a finished basement and 24 with a kitchen island, plus 4 more features. See what HouseLoop Vision found
39 homes for sale in 64105 · Sorted by Newest Listed
Real estate in 64105 in Kansas City, Missouri
Kansas City 64105 has about 4,632 households and a median household income of $67,235. Roughly 14% of homes are owner-occupied, the median owner's home value is $251,400, 72% of adults hold a bachelor's degree or higher. The average commute runs 20.3 minutes. About 6,312 people live in Kansas City 64105, per the U.S. Census Bureau's American Community Survey 5-year estimate (2020–2024).
Kansas City 64105 has 39 homes for sale right now, 1 of them coming soon, with a median list price of $180,000. These homes were built between 1877 and 2018. They range from 517 to 6,461 square feet.
Housing market trends in 64105 in Kansas City, Missouri
As of Oct 24, 2026, Kansas City 64105: 39 homes for sale · 3 new in the last 7 days · median asking $180,000 · 18 price reductions · a median of 100 days to contract. 4 homes closed in the last 30 days, at a median of $256,335.
| Measure | Jul–Sep 2026 | Apr–Jun 2026 | Jul–Sep 2025 |
|---|---|---|---|
| Median sale price | $256,335 | $265,000 | $244,750 |
| Median price per sq ft | $299 | $252 | $250 |
| Median days to contract | 100 | 43 | 66 |
| Homes sold, three months | 8 | 13 | 18 |
| New listings | 26 | 27 | 17 |
| Went under contract | 9 | 14 | 3 |
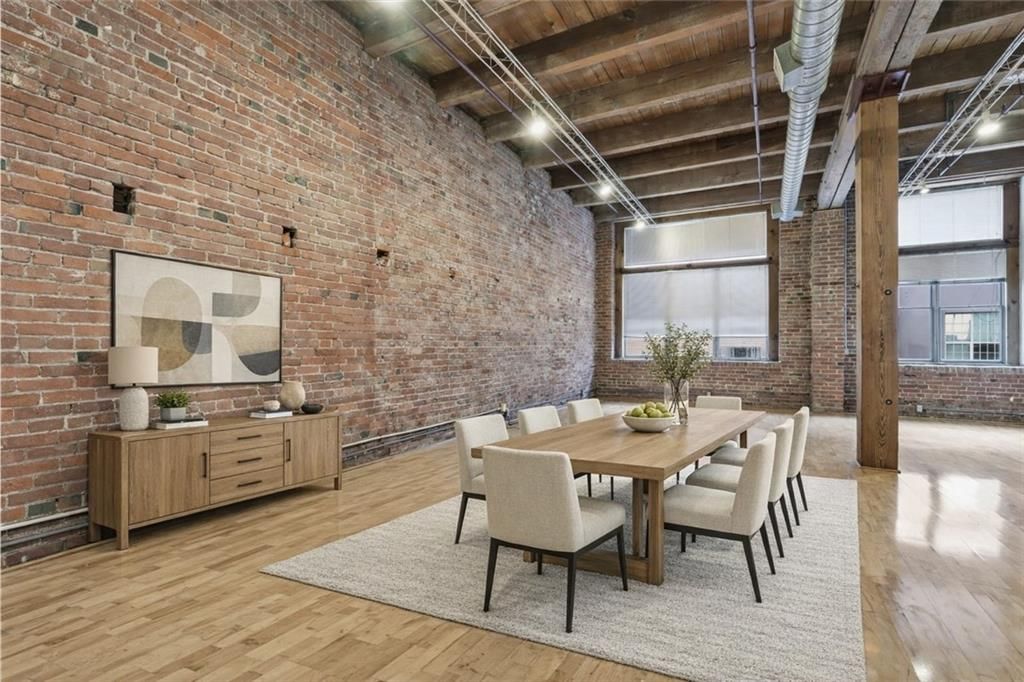
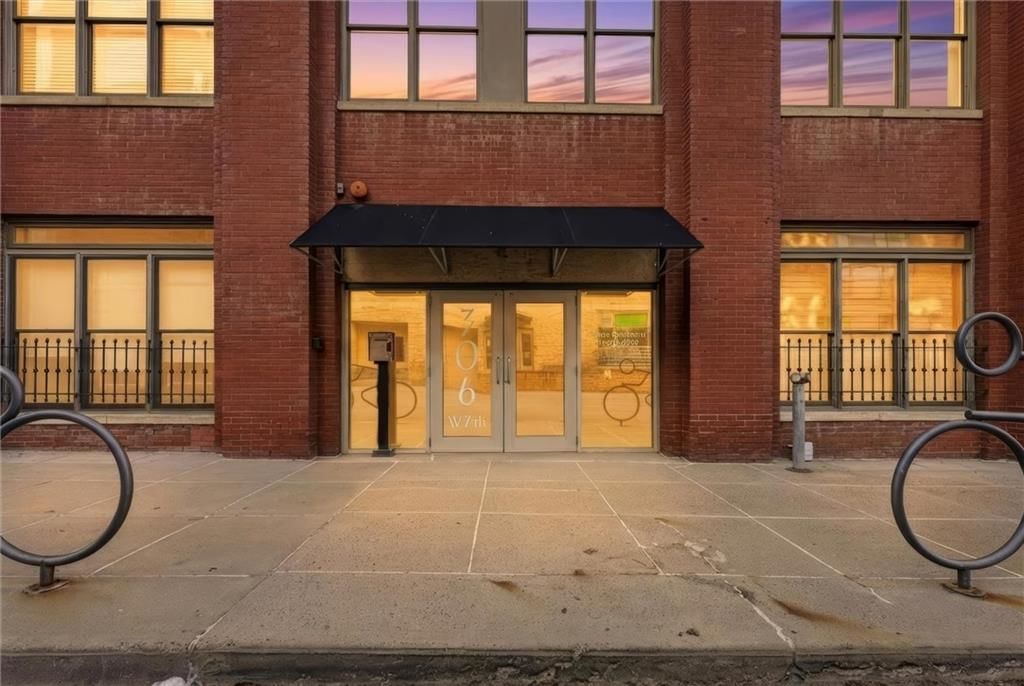
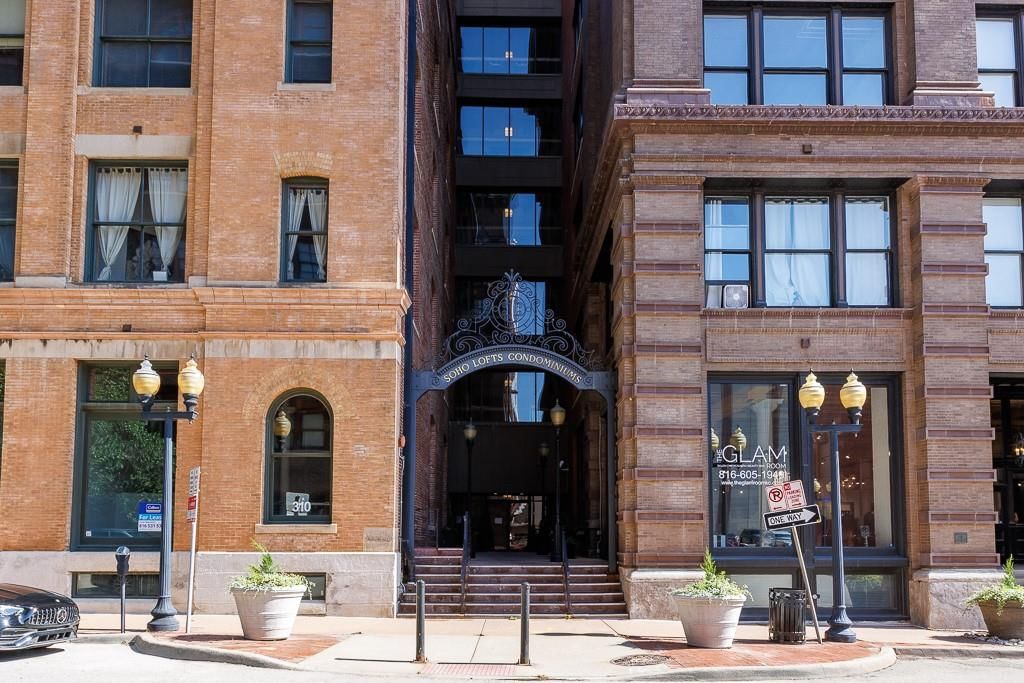
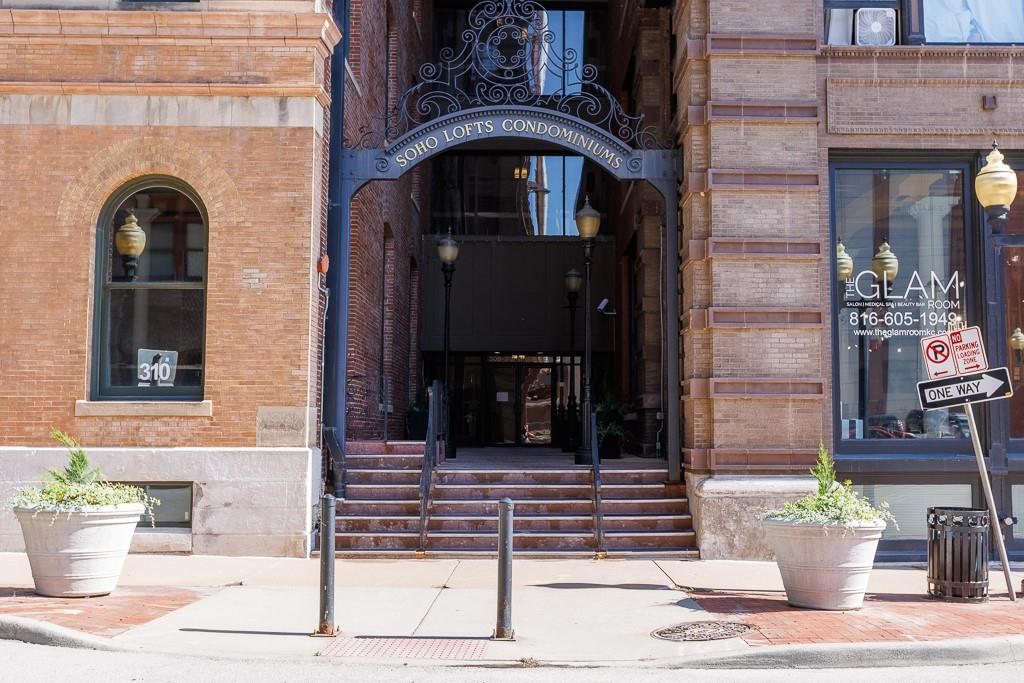
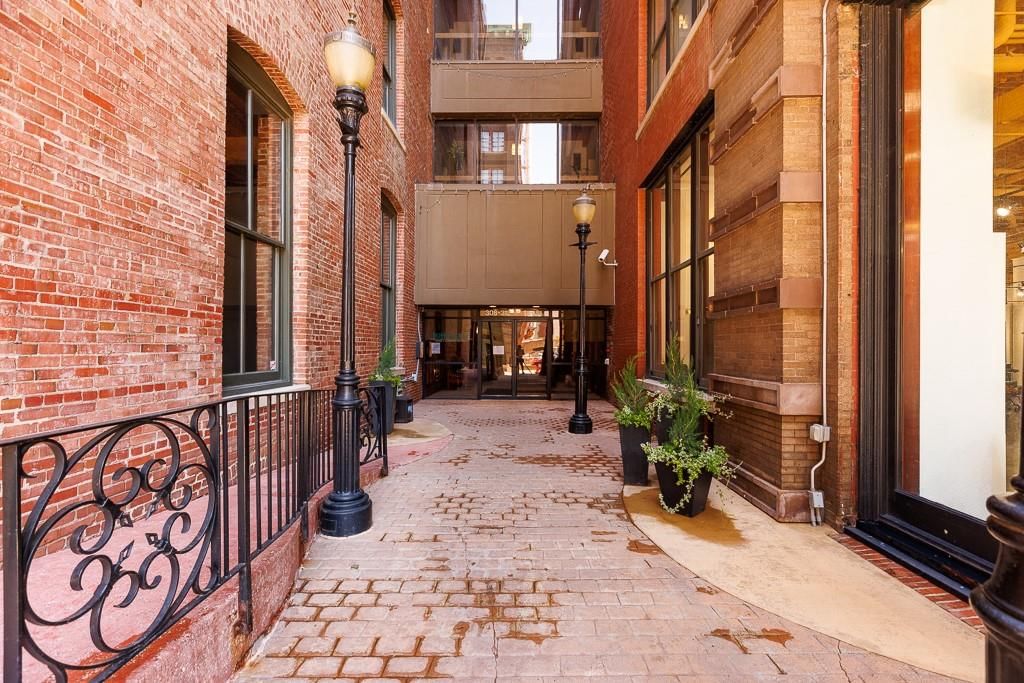
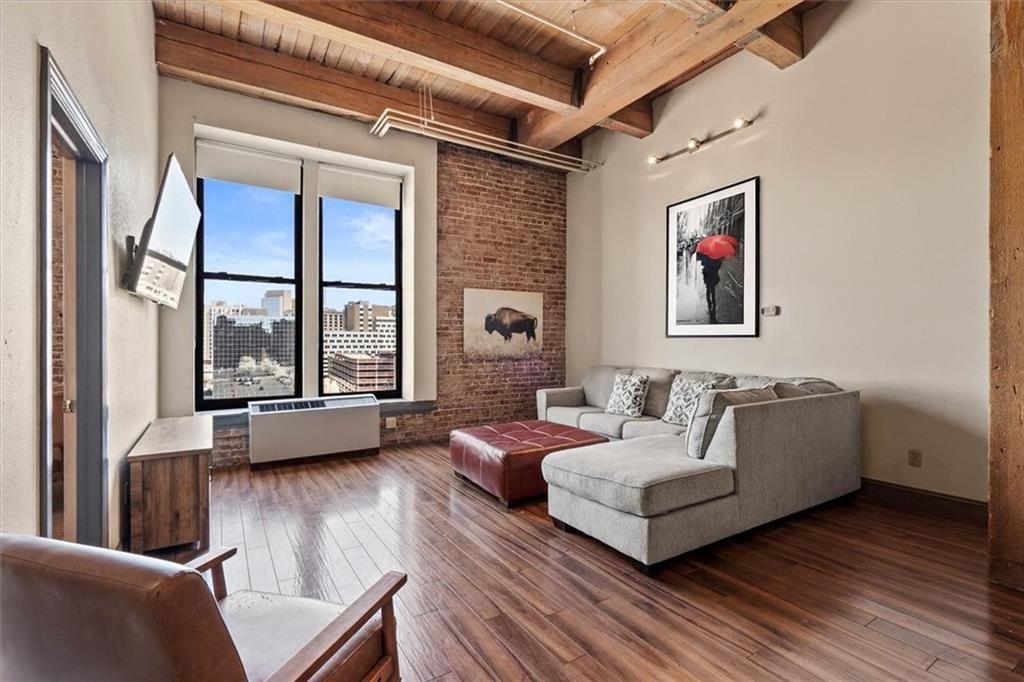
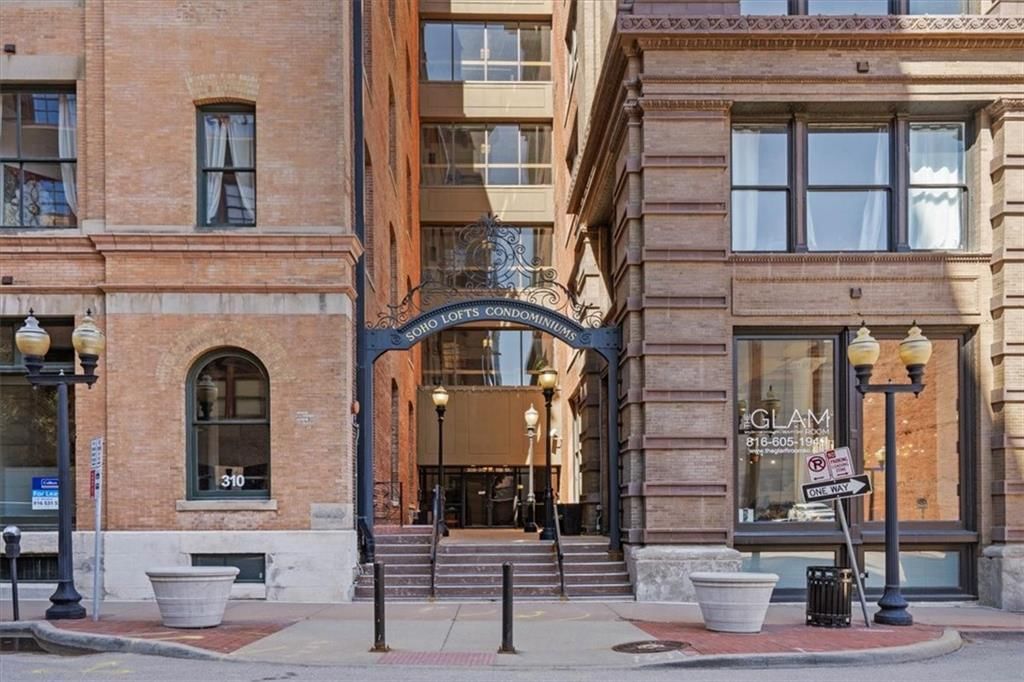
HouseLoop Vision in 64105
As of Oct 24, 2026
HouseLoop Vision identified 11 homes for sale in 64105 with white kitchen cabinets, 1 with a freestanding tub, 23 with a home gym, 3 with a big backyard, 7 with a finished basement and 24 with a kitchen island, plus 4 more features.
HouseLoop Vision has looked at the photos of all 39 homes for sale in 64105.
| HouseLoop Vision feature | Homes for sale | Where HouseLoop Vision saw it |
|---|---|---|
| White kitchen cabinets | 11 | 912 Baltimore Avenue #802 (photo 14) |
| Freestanding tub | 1 | |
| Home gym | 23 | 200 Main Street #510 (photo 32) |
| Big backyard | 3 | |
| Finished basement | 7 | |
| Kitchen island | 24 | 504 W 10th Street #504 (photo 6) |
| Two-story living room | 12 | |
| Fenced yard | 9 | |
| Hardwood floors | 23 | |
| Fireplace | 3 |
Key HouseLoop Vision features
- White kitchen cabinets
- Freestanding tub
- Home gym
- Big backyard
- Finished basement
- Kitchen island
- Two-story living room
- Fenced yard
- Hardwood floors
- Fireplace
Questions buyers ask about 64105
- How many homes for sale in 64105 have white kitchen cabinets?
- HouseLoop Vision identified 11 homes for sale in 64105 with white kitchen cabinets. One is 912 Baltimore Avenue #802 (photo 14).
- How many homes for sale in 64105 have a freestanding tub?
- HouseLoop Vision identified 1 home for sale in 64105 with a freestanding tub.
- How many homes for sale in 64105 have a home gym?
- HouseLoop Vision identified 23 homes for sale in 64105 with a home gym. One is 200 Main Street #510 (photo 32).
- How many homes for sale in 64105 have a big backyard?
- HouseLoop Vision identified 3 homes for sale in 64105 with a big backyard.
- How many homes for sale in 64105 have a finished basement?
- HouseLoop Vision identified 7 homes for sale in 64105 with a finished basement.
Schools serving 64105
| School | Median list | For sale |
|---|---|---|
| School districts | ||
| Kansas City MO School District | Median— | — |
| High schools | ||
| Northeast | Median— | — |
| Middle schools | ||
| Northeast | Median— | — |
| Elementary schools | ||
| Primitivo Garcia | Median— | — |
How we compute these
- Median list.
- The middle asking price among the homes for sale right now. Half are listed above it, half below.
- For sale.
- Homes listed as active right now. A live count, not a monthly average.
Homes by feature in 64105
| Feature | For sale |
|---|---|
| Homes with a public sewer | For sale39 |
| Homes with public water | For sale38 |
| Under 1,500 sq ft | For sale36 |
| Under 1/4 acre | For sale34 |
How we compute these
- For sale.
- Homes listed as active right now. A live count, not a monthly average.
Nearby neighborhoods to Kansas City
| Neighborhood | Market (Market type is set by months of supply — how long it would take to sell every home for sale at the current pace. Under ~4 months favors sellers (low inventory, faster sales, homes near or above asking); over ~6 favors buyers (more choice, more negotiating room). 4–6 is balanced.) | Months supply | For sale | Median sale | Sell-to-list | Days to contract | Coming soon | Under contract |
|---|---|---|---|---|---|---|---|---|
| Ruskin Heights | Seller's | 2.9 mo | 15 | Median$150,000 | 100% | 22d | 0 | 14 |
| Marlborough Heights | Seller's | 3.6 mo | 16 | Median$165,500 | 101% | 34d | 1 | 9 |
| Armour Hills | Strong Seller's | 1.4 mo | 6 | Median$479,500 | 104% | 10d | 2 | 3 |
| Ruskin Hills | Seller's | 3.2 mo | 10 | Median$173,000 | 102% | 30d | 0 | 2 |
| Red Bridge | Seller's ▲ | 3.1 mo | 9 | Median$355,000 | 101% | 14d | 2 | 4 |
How we compute these
- Market.
- Market type is set by months of supply — how long it would take to sell every home for sale at the current pace. Under ~4 months favors sellers (low inventory, faster sales, homes near or above asking); over ~6 favors buyers (more choice, more negotiating room). 4–6 is balanced.
- Months supply.
- How many months it would take to sell every home now for sale at the pace of the last 90 days: homes for sale ÷ (closings in the last 90 days ÷ 3).
- For sale.
- Homes listed as active right now. A live count, not a monthly average.
- Days to contract.
- The middle number of days between a home being listed and going under contract, over the last 90 days of closings. It is not days-to-close, and it is not how long today's listings have been sitting. Newly built homes are excluded, because a build finishing is not a market moving.
- Coming soon.
- Homes announced but not yet accepting showings. A live count.
- Under contract.
- Homes with an accepted contract that have not closed yet. A live count.
Search homes nearby 64105
| Place | Market (Market type is set by months of supply — how long it would take to sell every home for sale at the current pace. Under ~4 months favors sellers (low inventory, faster sales, homes near or above asking); over ~6 favors buyers (more choice, more negotiating room). 4–6 is balanced.) | Months supply | Median list | Sell-to-list | Days to contract | For sale | Coming soon | Under contract |
|---|---|---|---|---|---|---|---|---|
| Kansas City | Seller's | 4 mo | Median$265,000 | 100% | 21d | 2,245 | 95 | 813 |
| Independence | Seller's | 3.3 mo | Median$224,900 | 99% | 20d | 449 | 15 | 160 |
| Lee's Summit | Seller's | 3 mo | Median$499,000 | 98% | 20d | 445 | 27 | 196 |
| Blue Springs | Seller's | 2.6 mo | Median$394,900 | 99% | 18d | 203 | 8 | 118 |
| Raytown | Seller's | 3.4 mo | Median$215,000 | 97% | 23d | 126 | 7 | 35 |
How we compute these
- Market.
- Market type is set by months of supply — how long it would take to sell every home for sale at the current pace. Under ~4 months favors sellers (low inventory, faster sales, homes near or above asking); over ~6 favors buyers (more choice, more negotiating room). 4–6 is balanced.
- Months supply.
- How many months it would take to sell every home now for sale at the pace of the last 90 days: homes for sale ÷ (closings in the last 90 days ÷ 3).
- Median list.
- The middle asking price among the homes for sale right now. Half are listed above it, half below.
- Days to contract.
- The middle number of days between a home being listed and going under contract, over the last 90 days of closings. It is not days-to-close, and it is not how long today's listings have been sitting. Newly built homes are excluded, because a build finishing is not a market moving.
- For sale.
- Homes listed as active right now. A live count, not a monthly average.
- Coming soon.
- Homes announced but not yet accepting showings. A live count.
- Under contract.
- Homes with an accepted contract that have not closed yet. A live count.
Nearby ZIP codes
| Place | Market (Market type is set by months of supply — how long it would take to sell every home for sale at the current pace. Under ~4 months favors sellers (low inventory, faster sales, homes near or above asking); over ~6 favors buyers (more choice, more negotiating room). 4–6 is balanced.) | Months supply | Median list | Sell-to-list | Days to contract | For sale | Coming soon | Under contract |
|---|---|---|---|---|---|---|---|---|
| 64119 | Seller's | 2.4 mo | Median$269,900 | 98% | 19d | 101 | 6 | 38 |
| 64114 | Seller's | 2.9 mo | Median$292,500 | 100% | 14d | 117 | 11 | 49 |
| 64131 | Seller's | 2.6 mo | Median$228,000 | 98% | 22d | 69 | 6 | 34 |
| 64134 | Seller's | 3.3 mo | Median$192,500 | 99% | 24d | 83 | 3 | 39 |
How we compute these
- Market.
- Market type is set by months of supply — how long it would take to sell every home for sale at the current pace. Under ~4 months favors sellers (low inventory, faster sales, homes near or above asking); over ~6 favors buyers (more choice, more negotiating room). 4–6 is balanced.
- Months supply.
- How many months it would take to sell every home now for sale at the pace of the last 90 days: homes for sale ÷ (closings in the last 90 days ÷ 3).
- Median list.
- The middle asking price among the homes for sale right now. Half are listed above it, half below.
- Days to contract.
- The middle number of days between a home being listed and going under contract, over the last 90 days of closings. It is not days-to-close, and it is not how long today's listings have been sitting. Newly built homes are excluded, because a build finishing is not a market moving.
- For sale.
- Homes listed as active right now. A live count, not a monthly average.
- Coming soon.
- Homes announced but not yet accepting showings. A live count.
- Under contract.
- Homes with an accepted contract that have not closed yet. A live count.