
Homes with a Golf Course for Sale in Raymore, MO
27 homes for sale in Raymore · Sorted by Newest Listed

801 Bridgeshire Drive, Raymore, MO
New · 2h ago

1407 Upton Court, Raymore, MO
New · 3h ago


502 Bentwater Drive, Raymore, MO
New · 2d ago


1016 Bridgeshire Drive, Raymore, MO
New · 4d ago


511 Hampstead Drive, Raymore, MO
New · 6d ago


1210 Metfield Lane, Raymore, MO


1525 Portsmouth Lane, Raymore, MO


1521 Portsmouth Lane, Raymore, MO


1115 Metfield Lane, Raymore, MO


1509 Portsmouth Lane, Raymore, MO

1607 Portsmouth Lane, Raymore, MO


1615 Portsmouth Lane, Raymore, MO

1401 Upton Court, Raymore, MO


1413 Newport Lane, Raymore, MO

509 Turnbridge Drive, Raymore, MO

511 Turnbridge Drive, Raymore, MO


1502 Cross Creek Drive, Raymore, MO
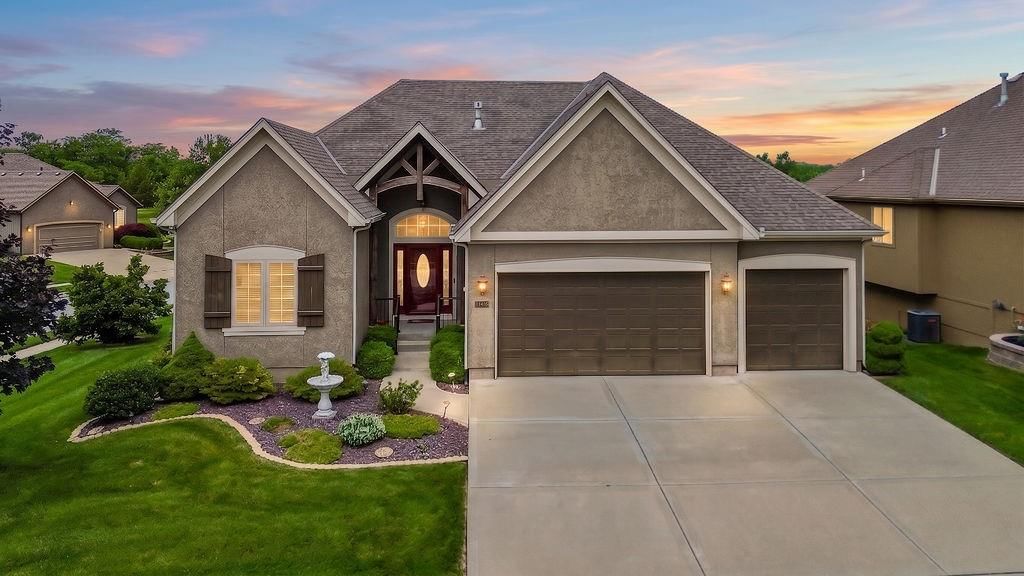


1422 Brompton Lane, Raymore, MO

1000 Rannoch Drive, Raymore, MO


500 Bentwater Drive, Raymore, MO


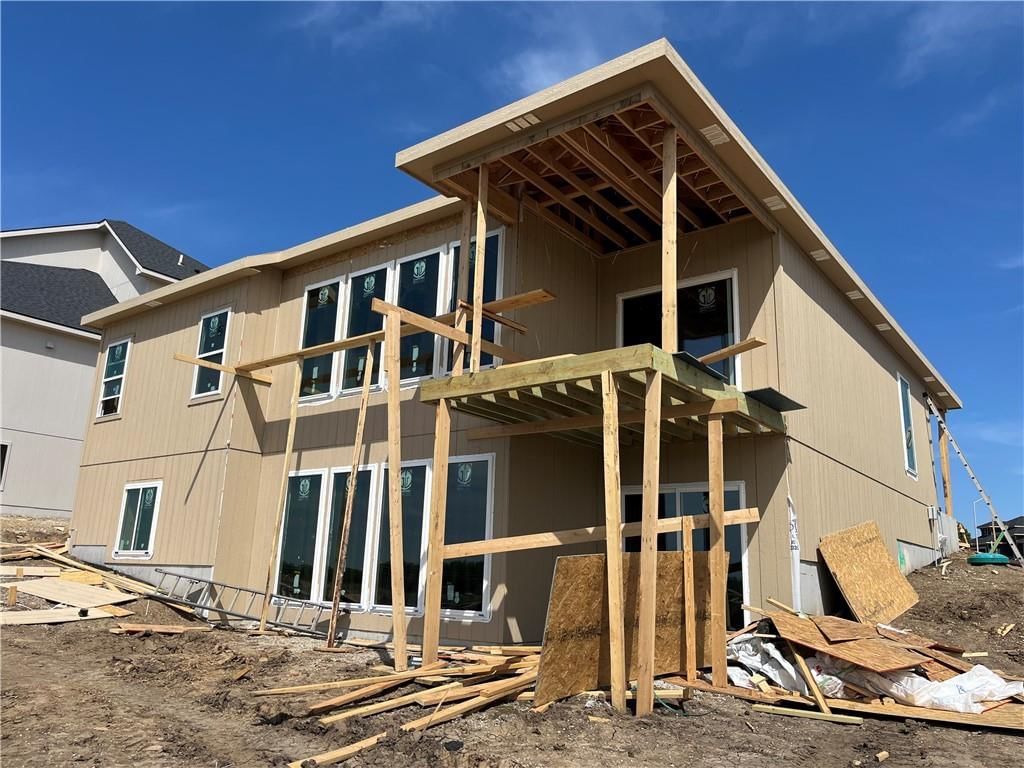
1622 Hanover Lane, Raymore, MO


1628 Hanover Lane, Raymore, MO


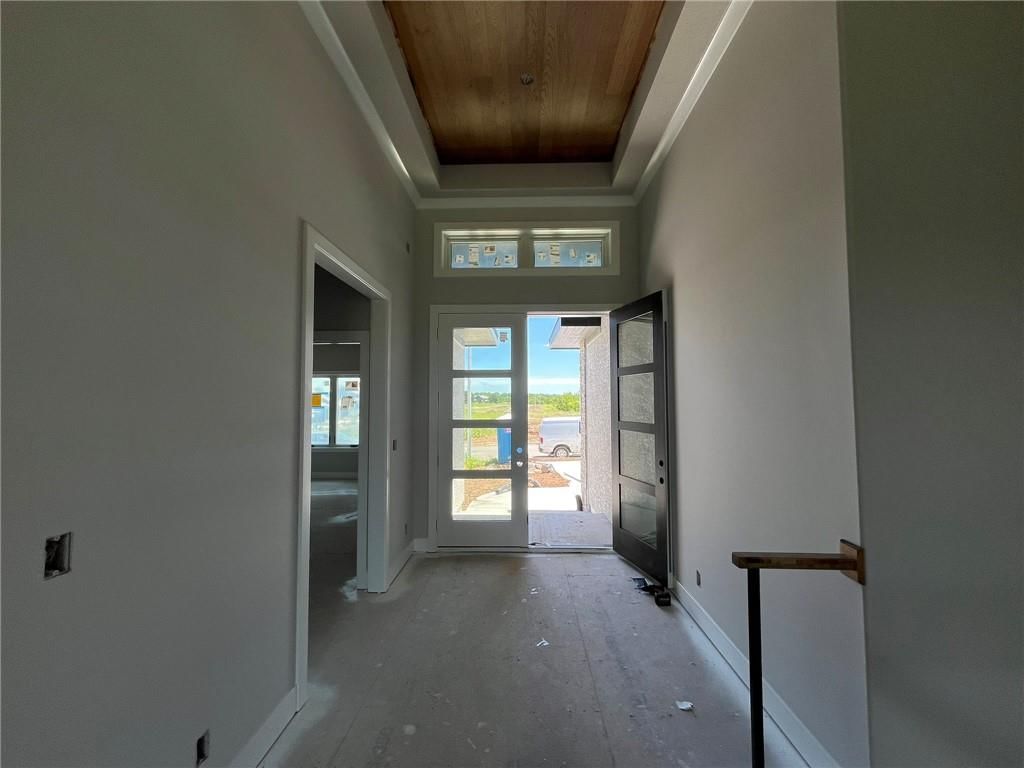
510 Bentwater Drive, Raymore, MO


517 Bentwater Drive, Raymore, MO
Start withthe numbers that matter to you
Real estate inRaymore, Missouri
Raymore is a solidly established suburban community of nearly 24,000 residents where the median age of 40.1 years, per the 2023 American Community Survey, reflects a population that has mostly moved past the young-family stage. The town's economic profile leans decidedly toward affluence: median household income stood at $103,158 as of 2023, and 78% of the 8,944 households are owner-occupied. That homeownership commitment shows in the housing stock—the median home value hit $318,000 in the 2023 Census estimate, though recent sales have pushed higher, with the median sale price running $401,500 over the last 30 days. Renters here pay a median of $1,283 monthly, making owner-occupation not just the norm but often the more practical long-term choice.
The buyer's market right now is reasonably active, with 51 homes sold in the past month and a median time on market of 33 days. Homes are selling at list price on average—the sell-to-list ratio came in at 100% over the last 30 days—which suggests realistic pricing and fair conditions for both sides. Year-to-date, 328 homes have closed, and the median sale price for the year sits at $393,385. New construction remains minimal: only 14 building permits were issued in the most recent survey period (July 2026), all single-family, indicating limited new supply.
Commuting from Raymore averages 26.4 minutes, making it accessible to the broader metro while maintaining its own identity as a bedroom community. Education levels are moderate for the Kansas City suburbs, with 37% of the 2023 population holding a bachelor's degree or higher. This is a neighborhood where people buy to stay, supported by the strong ownership rates and stable median age.
Sources — demographics: U.S. Census Bureau, American Community Survey 5-year estimates (2023) · listings, prices and days on market: Heartland MLS, as of September 11, 2026 · analysis and home values: HouseLoop
Housing market trendsin Raymore, Missouri
Raymore, MO: 172 homes for sale · 11 new in the last 7 days · median asking $399,945 · 60 price reductions · a median of 22 days to contract. 48 homes closed in the last 30 days, at a median of $385,000. At the pace of the last 90 days that is 3.42 months of supply.
| Measure | Aug 2026 |
|---|---|
| Median sale price | $397,950 |
| Median price per sq ft | $188 |
| Median days to contract | 23 |
| Sell-to-list ratio | 100% |
| Homes sold | 58 |
| New listings | 87 |
| Went under contract | 49 |
Real estateFAQs about Raymore
How many homes are for sale in Raymore?
How much does a home in Raymore cost?
What is the price per square foot in Raymore?
How fast do homes sell in Raymore?
How many homes have sold in Raymore in the past year?
When were the homes in Raymore built?
What are the newest homes for sale in Raymore?
How big are the homes for sale in Raymore?
How big are the lots in Raymore?
How many bedrooms do homes in Raymore have?
Do homes in Raymore have HOA fees?
Are there single-story homes for sale in Raymore?
Are there homes with a pool in Raymore?
What kind of garages do homes in Raymore have?
What schools serve Raymore?
What is the most common flooring in Raymore homes?
Schoolsserving Raymore
| School | Median list | |
|---|---|---|
| School districts | ||
| Raymore-Peculiar School District | $400,000 | |
| High schools | ||
| Raymore-Peculiar | $400,380 | |
| Middle schools | ||
| Raymore-Peculiar East | $400,000 | |
| Raymore-Peculiar | $397,500 | |
| Raymore-Peculiar South | Median— | |
| Eagle Glen | Median— | |
| Elementary schools | ||
| Creekmoor | $459,000 | |
| Timber Creek | $261,450 | |
| Eagle Glen | Median— | |
| Bridle Ridge | Median— | |
| Raymore | Median— | |
| Stonegate | Median— | |
How we compute these
- Median list.
- The middle asking price among the homes for sale right now. Half are listed above it, half below.
- For sale.
- Homes listed as active right now. A live count, not a monthly average.
Newly listedin Raymore, MO
| Address | Price |
|---|---|
| 1407 Upton Court | Price$1,199,000 |
| 1013 Camelback Trail | Price$400,762 |
| 1115 Sendera Trail | Price$470,069 |
| 1813 Halls Creek Avenue | Price$680,555 |
| 502 Bentwater Drive | Price$835,500 |
| 1016 Bridgeshire Drive | Price$775,000 |
| 300 Johnston Drive | Price$315,000 |
Recently went under contractin Raymore, MO
| Address | List price |
|---|---|
| 704 Raven Street | List price$370,000 |
| 1814 Woodward Circle | List price$599,900 |
| 119 Johnston Parkway | List price$239,000 |
| 1209 N Lyne Street | List price$30,000 |
| 1810 Halls Creek Avenue | List price$489,990 |
| 813 Glenn Circle | List price$448,480 |
| 1124 Metfield Lane | List price$925,000 |
| 1820 Woodward Circle | List price$419,990 |
| 1224 Kingsland Circle | List price$599,000 |
| 1208 Piedra River Trail | List price$265,168 |
| 1406 W Stone Boulevard | List price$245,000 |
| 203 Broadmoor Drive | List price$335,000 |
How we compute these
- Under contract.
- Homes with an accepted contract that have not closed yet. A live count.
- Days to contract.
- The middle number of days between a home being listed and going under contract, over the last 90 days of closings. It is not days-to-close, and it is not how long today's listings have been sitting. Newly built homes are excluded, because a build finishing is not a market moving.
Popular home searchesin Raymore
| Search | For sale |
|---|---|
| Open houses | 26 |
| Luxury homes | For sale4 |
| Just listed homes | 10 |
| Price-reduced homes | 59 |
| Coming soon homes | 10 |
| Homes under contract | 107 |
How we compute these
- For sale.
- Homes listed as active right now. A live count, not a monthly average.
Homes by pricein Raymore
How we compute these
- For sale.
- Homes listed as active right now. A live count, not a monthly average.
Homes by featurein Raymore
How we compute these
- For sale.
- Homes listed as active right now. A live count, not a monthly average.
Search by property typein Raymore
| Property type | Median sale |
|---|---|
| Single Family | $395,000 |
| Townhouse | Median— |
| Villa | Median— |
| Half Duplex | Median— |
| Lots / Land | $226,350 |
How we compute these
- Market.
- Market type is set by months of supply — how long it would take to sell every home for sale at the current pace. Under ~4 months favors sellers (low inventory, faster sales, homes near or above asking); over ~6 favors buyers (more choice, more negotiating room). 4–6 is balanced.
- Months supply.
- How many months it would take to sell every home now for sale at the pace of the last 90 days: homes for sale ÷ (closings in the last 90 days ÷ 3).
- For sale.
- Homes listed as active right now. A live count, not a monthly average.
- Days to contract.
- The middle number of days between a home being listed and going under contract, over the last 90 days of closings. It is not days-to-close, and it is not how long today's listings have been sitting. Newly built homes are excluded, because a build finishing is not a market moving.
- Coming soon.
- Homes announced but not yet accepting showings. A live count.
- Under contract.
- Homes with an accepted contract that have not closed yet. A live count.
Nearby neighborhoodsto Raymore
| Neighborhood | Median sale |
|---|---|
| Sky Vue Estates | $364,500 |
| Creekmoor - Cunningham | $827,749 |
How we compute these
- Market.
- Market type is set by months of supply — how long it would take to sell every home for sale at the current pace. Under ~4 months favors sellers (low inventory, faster sales, homes near or above asking); over ~6 favors buyers (more choice, more negotiating room). 4–6 is balanced.
- Months supply.
- How many months it would take to sell every home now for sale at the pace of the last 90 days: homes for sale ÷ (closings in the last 90 days ÷ 3).
- For sale.
- Homes listed as active right now. A live count, not a monthly average.
- Days to contract.
- The middle number of days between a home being listed and going under contract, over the last 90 days of closings. It is not days-to-close, and it is not how long today's listings have been sitting. Newly built homes are excluded, because a build finishing is not a market moving.
- Coming soon.
- Homes announced but not yet accepting showings. A live count.
- Under contract.
- Homes with an accepted contract that have not closed yet. A live count.
Search homesnearby Raymore
| Place | Median list |
|---|---|
| Raymore | $393,995 |
| Kansas City | $260,000 |
| Independence | $224,900 |
| Lee's Summit | $542,666 |
| Blue Springs | $400,420 |
| Raytown | $238,500 |
How we compute these
- Market.
- Market type is set by months of supply — how long it would take to sell every home for sale at the current pace. Under ~4 months favors sellers (low inventory, faster sales, homes near or above asking); over ~6 favors buyers (more choice, more negotiating room). 4–6 is balanced.
- Months supply.
- How many months it would take to sell every home now for sale at the pace of the last 90 days: homes for sale ÷ (closings in the last 90 days ÷ 3).
- Median list.
- The middle asking price among the homes for sale right now. Half are listed above it, half below.
- Days to contract.
- The middle number of days between a home being listed and going under contract, over the last 90 days of closings. It is not days-to-close, and it is not how long today's listings have been sitting. Newly built homes are excluded, because a build finishing is not a market moving.
- For sale.
- Homes listed as active right now. A live count, not a monthly average.
- Coming soon.
- Homes announced but not yet accepting showings. A live count.
- Under contract.
- Homes with an accepted contract that have not closed yet. A live count.
NearbyZIP codes
| Place | Median list |
|---|---|
| 64084 | $219,000 |
How we compute these
- Market.
- Market type is set by months of supply — how long it would take to sell every home for sale at the current pace. Under ~4 months favors sellers (low inventory, faster sales, homes near or above asking); over ~6 favors buyers (more choice, more negotiating room). 4–6 is balanced.
- Months supply.
- How many months it would take to sell every home now for sale at the pace of the last 90 days: homes for sale ÷ (closings in the last 90 days ÷ 3).
- Median list.
- The middle asking price among the homes for sale right now. Half are listed above it, half below.
- Days to contract.
- The middle number of days between a home being listed and going under contract, over the last 90 days of closings. It is not days-to-close, and it is not how long today's listings have been sitting. Newly built homes are excluded, because a build finishing is not a market moving.
- For sale.
- Homes listed as active right now. A live count, not a monthly average.
- Coming soon.
- Homes announced but not yet accepting showings. A live count.
- Under contract.
- Homes with an accepted contract that have not closed yet. A live count.
Search homes for salein every city we cover
How we compute these
- Market.
- Market type is set by months of supply — how long it would take to sell every home for sale at the current pace. Under ~4 months favors sellers (low inventory, faster sales, homes near or above asking); over ~6 favors buyers (more choice, more negotiating room). 4–6 is balanced.
- Months supply.
- How many months it would take to sell every home now for sale at the pace of the last 90 days: homes for sale ÷ (closings in the last 90 days ÷ 3).
- Median list.
- The middle asking price among the homes for sale right now. Half are listed above it, half below.
- Days to contract.
- The middle number of days between a home being listed and going under contract, over the last 90 days of closings. It is not days-to-close, and it is not how long today's listings have been sitting. Newly built homes are excluded, because a build finishing is not a market moving.
- For sale.
- Homes listed as active right now. A live count, not a monthly average.
- Coming soon.
- Homes announced but not yet accepting showings. A live count.
- Under contract.
- Homes with an accepted contract that have not closed yet. A live count.
Search for homesin popular markets
| Market | For sale |
|---|---|
| Heritage Ranch | 28 |
| Canyon Lakes | 25 |
| Garrett Ranch | 24 |
| Seven Bridges | 24 |
| Tomahawk Valley | 23 |
| Ruskin Heights | 22 |
How we compute these
- Market.
- Market type is set by months of supply — how long it would take to sell every home for sale at the current pace. Under ~4 months favors sellers (low inventory, faster sales, homes near or above asking); over ~6 favors buyers (more choice, more negotiating room). 4–6 is balanced.
- For sale.
- Homes listed as active right now. A live count, not a monthly average.
Or go wider stillcounty, metro and state
How we compute these
- Market.
- Market type is set by months of supply — how long it would take to sell every home for sale at the current pace. Under ~4 months favors sellers (low inventory, faster sales, homes near or above asking); over ~6 favors buyers (more choice, more negotiating room). 4–6 is balanced.
- Months supply.
- How many months it would take to sell every home now for sale at the pace of the last 90 days: homes for sale ÷ (closings in the last 90 days ÷ 3).
- Median list.
- The middle asking price among the homes for sale right now. Half are listed above it, half below.
- Days to contract.
- The middle number of days between a home being listed and going under contract, over the last 90 days of closings. It is not days-to-close, and it is not how long today's listings have been sitting. Newly built homes are excluded, because a build finishing is not a market moving.
- For sale.
- Homes listed as active right now. A live count, not a monthly average.
- Coming soon.
- Homes announced but not yet accepting showings. A live count.
- Under contract.
- Homes with an accepted contract that have not closed yet. A live count.