
Homes with a Finished Basement for Sale in Belton, MO
29 homes fit this search · Sorted by Newest Listed


1201 Mesa Drive, Belton, MO
New · 2d ago


419 E 166th Court, Belton, MO
New · 5d ago


7401 155 Street, Belton, MO
New · 5d ago

15906 Harold Drive, Belton, MO
New · 6d ago


702 Andy Court, Belton, MO


300 Hawthorne Court, Belton, MO


817 Shane Court, Belton, MO


912 Colbern Drive, Belton, MO


16109 Bluegrass Court, Belton, MO


801 Courtland Court, Belton, MO

7903 E 170th Street, Belton, MO


910 Sweet Cherry Place, Belton, MO


621 Solstice Circle, Belton, MO

212 Hillcrest Road, Belton, MO


16414 Hight Avenue, Belton, MO


16407 Harris Avenue, Belton, MO


715 Sunset Lane, Belton, MO


16912 E 170th Court, Belton, MO
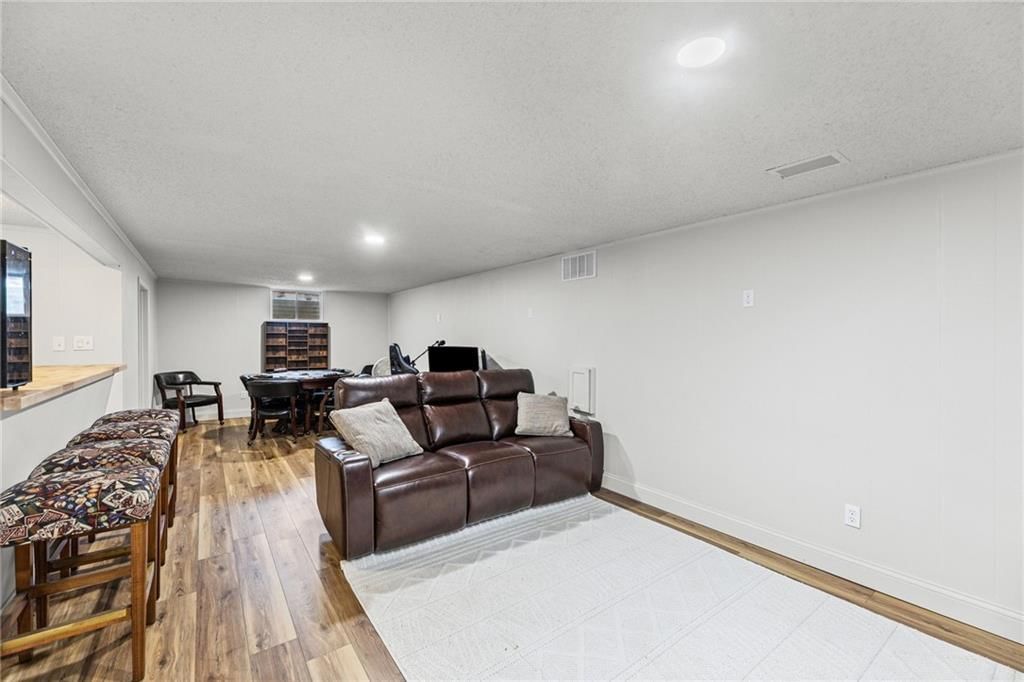


507 London Way, Belton, MO


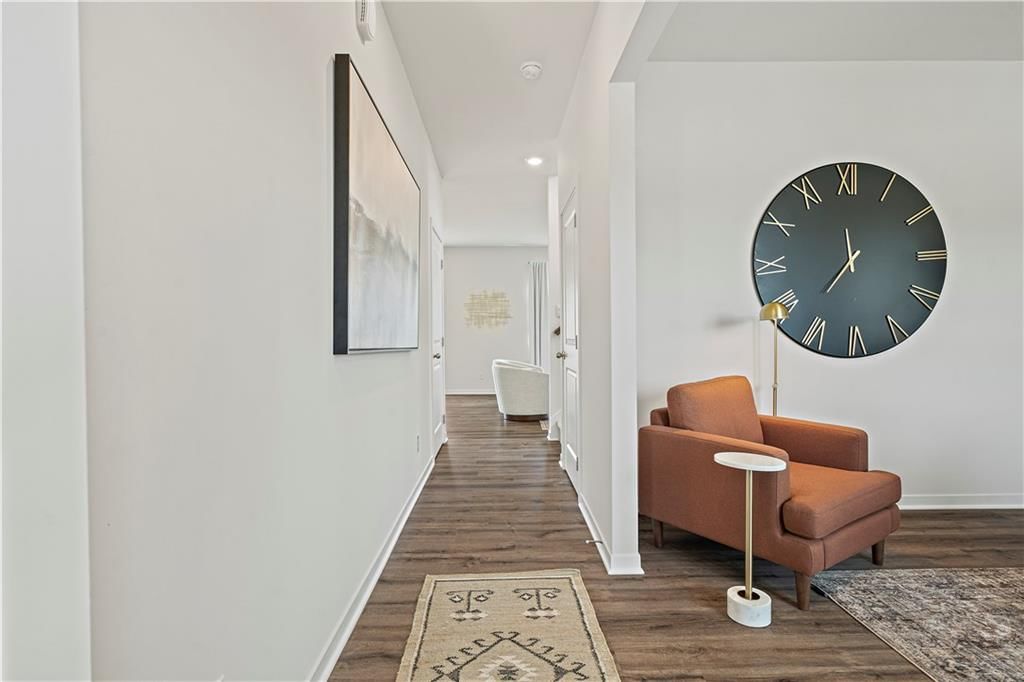
714 Solstice Circle, Belton, MO


721 Solstice Circle, Belton, MO


717 Samantha Lane, Belton, MO


700 Summer Dawn Circle, Belton, MO


17317 S Wheatland Drive, Belton, MO
About Homes with Finished Basement in Belton, MO
Belton, MO has 29 homes with finished basement for sale right now, with a median list price of $364,900 as of Sep 28 These homes with finished basement were built between 1963 and 2026, ranging from 1,407 to 6,043 square feet.
Homes with Finished Basement market trends Belton, MO
Belton, MO: 64 homes for sale · 7 new in the last 7 days · median asking $342,450 · 26 price reductions · a median of 21 days to contract. 29 homes closed in the last 30 days, at a median of $300,000. At the pace of the last 90 days that is 1.94 months of supply.
| Measure | Aug 2026 |
|---|---|
| Median sale price | $310,000 |
| Median price per sq ft | $166 |
| Median days to contract | 21 |
| Sell-to-list ratio | 100% |
| Homes sold | 30 |
| New listings | 46 |
| Went under contract | 30 |
Homes with Finished Basement FAQs Belton, MO
How many homes with finished basement are for sale in Belton, MO?
What is the median list price of homes with finished basement in Belton, MO?
Schools serving Belton
| School | Median list | |
|---|---|---|
| School districts | ||
| Belton School District | $349,950 | |
| Raymore-Peculiar School District | Median— | |
| High schools | ||
| Belton | $387,000 | |
| Raymore-Peculiar | Median— | |
| Middle schools | ||
| Belton | $332,500 | |
| Raymore-Peculiar South | Median— | |
| Elementary schools | ||
| Kentucky Trail | Median— | |
| Cambridge | Median— | |
| Gladden | Median— | |
How we compute these
- Median list.
- The middle asking price among the homes for sale right now. Half are listed above it, half below.
- For sale.
- Homes listed as active right now. A live count, not a monthly average.
Newly listed in Belton, MO
| Address | Price |
|---|---|
| 1201 Mesa Drive | Price$389,000 |
| 213 Park Avenue | Price$200,000 |
| 702 Mulberry Street | Price$239,000 |
| 305 Canterbury Lane | Price$330,000 |
| 419 E 166th Court | Price$539,000 |
| 304 E 164th Terrace | Price$199,900 |
| 3 Kendi Lane | Price$850,000 |
Recently went under contract in Belton, MO
| Address | List price |
|---|---|
| 16004 Valentine Avenue | List price$299,995 |
| 100 E South Avenue | List price$350,000 |
| 106 N Cleveland Avenue | List price$265,000 |
| 207 W North Avenue | List price$195,000 |
| 309 Canal Street | List price$224,000 |
| 705 Solstice Circle | List price$386,990 |
| 516 Emerson Drive | List price$289,900 |
| 801 Mulberry Street | List price$259,000 |
| 17226 Chula Vista Drive | List price$239,000 |
| 709 Solstice Circle | List price$389,990 |
| 509 Indian Trail | List price$189,900 |
| 730 E Cambridge Road | List price$425,000 |
How we compute these
- Under contract.
- Homes with an accepted contract that have not closed yet. A live count.
- Days to contract.
- The middle number of days between a home being listed and going under contract, over the last 90 days of closings. It is not days-to-close, and it is not how long today's listings have been sitting. Newly built homes are excluded, because a build finishing is not a market moving.
Popular home searches in Belton
| Search | For sale |
|---|---|
| Open houses | For sale1 |
| Luxury homes | 5 |
| Just listed homes | 8 |
| Price-reduced homes | 26 |
| Coming soon homes | 7 |
| Homes under contract | 41 |
How we compute these
- For sale.
- Homes listed as active right now. A live count, not a monthly average.
Homes by price in Belton
| Price range | For sale |
|---|---|
| Under $200,000 | For sale7 |
| Under $300,000 | 25 |
| Under $400,000 | 45 |
| Under $500,000 | 54 |
| Under $600,000 | 60 |
| Under $750,000 | 63 |
| Under $1,000,000 | 66 |
| $300,000 – $400,000 | 21 |
| $400,000 – $500,000 | 10 |
| $500,000 – $600,000 | For sale6 |
| $600,000 – $750,000 | For sale4 |
| $1M and above | 5 |
How we compute these
- For sale.
- Homes listed as active right now. A live count, not a monthly average.
Homes by feature in Belton
| Feature | For sale |
|---|---|
| Homes with public water | 66 |
| Homes with no HOA | 62 |
| Homes with a public sewer | 55 |
| Homes with 2+ full bathrooms | 51 |
| 2-car garage homes | 47 |
| Homes with an attached garage | 47 |
| Two or more stories | For sale45 |
| Homes with 3+ full bathrooms | 41 |
| Homes with carpet floors | 37 |
| Homes with a fireplace | 34 |
| Homes on under a quarter acre | 30 |
| Basement: Finished | For sale30 |
How we compute these
- For sale.
- Homes listed as active right now. A live count, not a monthly average.
Search by property type in Belton
| Property type | Median sale |
|---|---|
| Single Family | $305,000 |
| Half Duplex | Median— |
| Duplex | Median— |
| Quadruplex | Median— |
| Lots / Land | Median— |
How we compute these
- Market.
- Market type is set by months of supply — how long it would take to sell every home for sale at the current pace. Under ~4 months favors sellers (low inventory, faster sales, homes near or above asking); over ~6 favors buyers (more choice, more negotiating room). 4–6 is balanced.
- Months supply.
- How many months it would take to sell every home now for sale at the pace of the last 90 days: homes for sale ÷ (closings in the last 90 days ÷ 3).
- For sale.
- Homes listed as active right now. A live count, not a monthly average.
- Days to contract.
- The middle number of days between a home being listed and going under contract, over the last 90 days of closings. It is not days-to-close, and it is not how long today's listings have been sitting. Newly built homes are excluded, because a build finishing is not a market moving.
- Coming soon.
- Homes announced but not yet accepting showings. A live count.
- Under contract.
- Homes with an accepted contract that have not closed yet. A live count.
Nearby neighborhoods to Belton
| Neighborhood | Median sale |
|---|---|
| Traditions | $349,950 |
| Autumn Ridge | $383,990 |
| Lacy Estates | $236,500 |
| West Belton | $194,750 |
| Cimarron Trails | $181,000 |
| Pickering Place | $242,500 |
How we compute these
- Market.
- Market type is set by months of supply — how long it would take to sell every home for sale at the current pace. Under ~4 months favors sellers (low inventory, faster sales, homes near or above asking); over ~6 favors buyers (more choice, more negotiating room). 4–6 is balanced.
- Months supply.
- How many months it would take to sell every home now for sale at the pace of the last 90 days: homes for sale ÷ (closings in the last 90 days ÷ 3).
- For sale.
- Homes listed as active right now. A live count, not a monthly average.
- Days to contract.
- The middle number of days between a home being listed and going under contract, over the last 90 days of closings. It is not days-to-close, and it is not how long today's listings have been sitting. Newly built homes are excluded, because a build finishing is not a market moving.
- Coming soon.
- Homes announced but not yet accepting showings. A live count.
- Under contract.
- Homes with an accepted contract that have not closed yet. A live count.
Search homes nearby Belton
| Place | Median list |
|---|---|
| Belton | $364,900 |
| Raymore | $405,990 |
| Pleasant Hill | $269,950 |
| Harrisonville | $297,000 |
| Peculiar | $385,000 |
| Lee's Summit | $525,000 |
How we compute these
- Market.
- Market type is set by months of supply — how long it would take to sell every home for sale at the current pace. Under ~4 months favors sellers (low inventory, faster sales, homes near or above asking); over ~6 favors buyers (more choice, more negotiating room). 4–6 is balanced.
- Months supply.
- How many months it would take to sell every home now for sale at the pace of the last 90 days: homes for sale ÷ (closings in the last 90 days ÷ 3).
- Median list.
- The middle asking price among the homes for sale right now. Half are listed above it, half below.
- Days to contract.
- The middle number of days between a home being listed and going under contract, over the last 90 days of closings. It is not days-to-close, and it is not how long today's listings have been sitting. Newly built homes are excluded, because a build finishing is not a market moving.
- For sale.
- Homes listed as active right now. A live count, not a monthly average.
- Coming soon.
- Homes announced but not yet accepting showings. A live count.
- Under contract.
- Homes with an accepted contract that have not closed yet. A live count.
Nearby ZIP codes
| Place | Median list |
|---|---|
| 64012 | $413,990 |
| 64102 | $330,000 |
How we compute these
- Market.
- Market type is set by months of supply — how long it would take to sell every home for sale at the current pace. Under ~4 months favors sellers (low inventory, faster sales, homes near or above asking); over ~6 favors buyers (more choice, more negotiating room). 4–6 is balanced.
- Months supply.
- How many months it would take to sell every home now for sale at the pace of the last 90 days: homes for sale ÷ (closings in the last 90 days ÷ 3).
- Median list.
- The middle asking price among the homes for sale right now. Half are listed above it, half below.
- Days to contract.
- The middle number of days between a home being listed and going under contract, over the last 90 days of closings. It is not days-to-close, and it is not how long today's listings have been sitting. Newly built homes are excluded, because a build finishing is not a market moving.
- For sale.
- Homes listed as active right now. A live count, not a monthly average.
- Coming soon.
- Homes announced but not yet accepting showings. A live count.
- Under contract.
- Homes with an accepted contract that have not closed yet. A live count.
Search homes for sale in every city we cover
How we compute these
- Market.
- Market type is set by months of supply — how long it would take to sell every home for sale at the current pace. Under ~4 months favors sellers (low inventory, faster sales, homes near or above asking); over ~6 favors buyers (more choice, more negotiating room). 4–6 is balanced.
- Months supply.
- How many months it would take to sell every home now for sale at the pace of the last 90 days: homes for sale ÷ (closings in the last 90 days ÷ 3).
- Median list.
- The middle asking price among the homes for sale right now. Half are listed above it, half below.
- Days to contract.
- The middle number of days between a home being listed and going under contract, over the last 90 days of closings. It is not days-to-close, and it is not how long today's listings have been sitting. Newly built homes are excluded, because a build finishing is not a market moving.
- For sale.
- Homes listed as active right now. A live count, not a monthly average.
- Coming soon.
- Homes announced but not yet accepting showings. A live count.
- Under contract.
- Homes with an accepted contract that have not closed yet. A live count.
Search for homes in popular markets
| Market | For sale |
|---|---|
| Heritage Ranch | 29 |
| Canyon Lakes | 27 |
| Garrett Ranch | 24 |
| Seven Bridges | 24 |
| Tomahawk Valley | 22 |
| Woodlawn Estates | 21 |
How we compute these
- Market.
- Market type is set by months of supply — how long it would take to sell every home for sale at the current pace. Under ~4 months favors sellers (low inventory, faster sales, homes near or above asking); over ~6 favors buyers (more choice, more negotiating room). 4–6 is balanced.
- For sale.
- Homes listed as active right now. A live count, not a monthly average.
Or go wider still county, metro and state
How we compute these
- Market.
- Market type is set by months of supply — how long it would take to sell every home for sale at the current pace. Under ~4 months favors sellers (low inventory, faster sales, homes near or above asking); over ~6 favors buyers (more choice, more negotiating room). 4–6 is balanced.
- Months supply.
- How many months it would take to sell every home now for sale at the pace of the last 90 days: homes for sale ÷ (closings in the last 90 days ÷ 3).
- Median list.
- The middle asking price among the homes for sale right now. Half are listed above it, half below.
- Days to contract.
- The middle number of days between a home being listed and going under contract, over the last 90 days of closings. It is not days-to-close, and it is not how long today's listings have been sitting. Newly built homes are excluded, because a build finishing is not a market moving.
- For sale.
- Homes listed as active right now. A live count, not a monthly average.
- Coming soon.
- Homes announced but not yet accepting showings. A live count.
- Under contract.
- Homes with an accepted contract that have not closed yet. A live count.