
Kansas City 64116 Single-Story Homes for Sale
16 homes for sale in 64116 · Sorted by Newest Listed


1228 E 25th Avenue, Kansas City, MO


4026 N Tracy Avenue, Kansas City, MO


1111 NE 43rd Street, Kansas City, MO


2623 Vernon Street, North Kansas City, MO


3608 N Euclid Avenue, Kansas City, MO


1444 E 24th Avenue, North Kansas City, MO


2307 NE 37th Terrace, Kansas City, MO


4529 N Forest Avenue, Kansas City, MO


408 E 31st Avenue, North Kansas City, MO


4680 N OLIVE Street, Kansas City, MO


4552 N Locust Street, Kansas City, MO


606 NE 43rd Terrace, Kansas City, MO

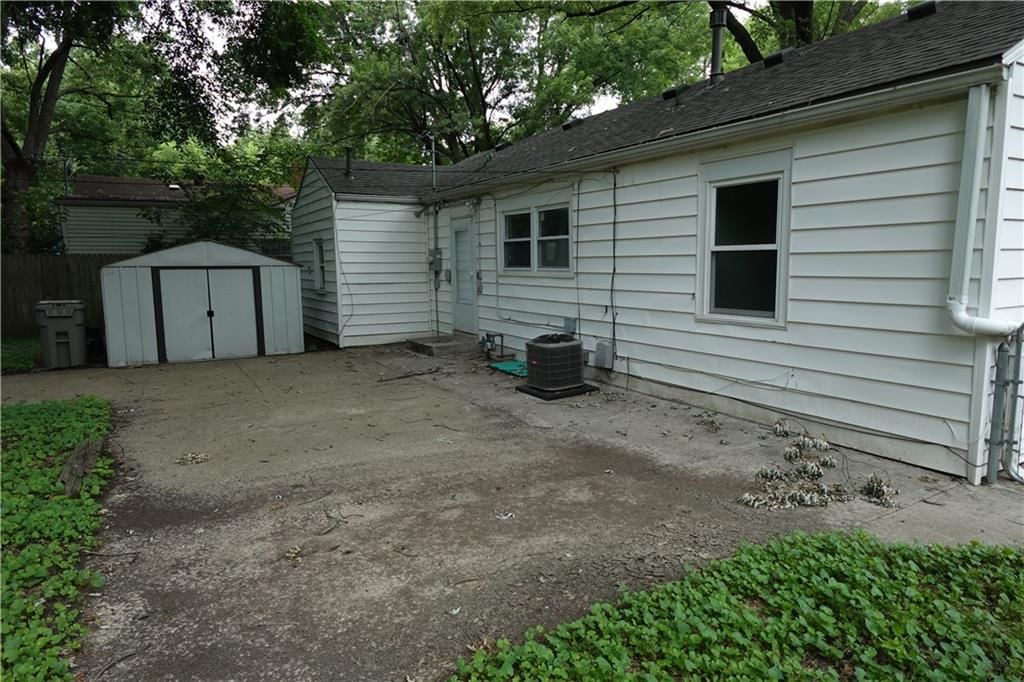

801 NE 46th Street, Kansas City, MO


2505 NE 38th Street, Kansas City, MO


4515 N Troost Avenue, Kansas City, MO

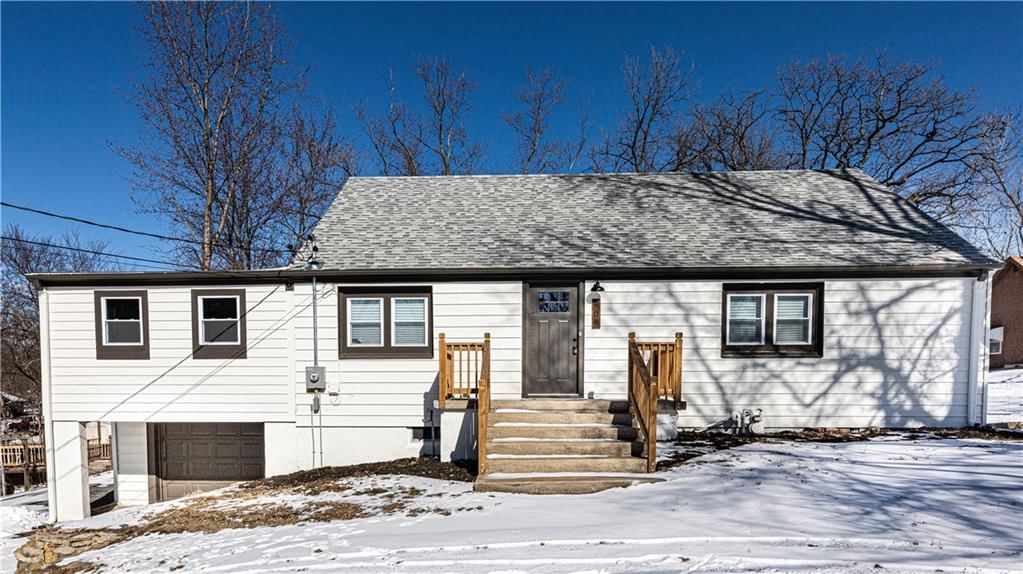
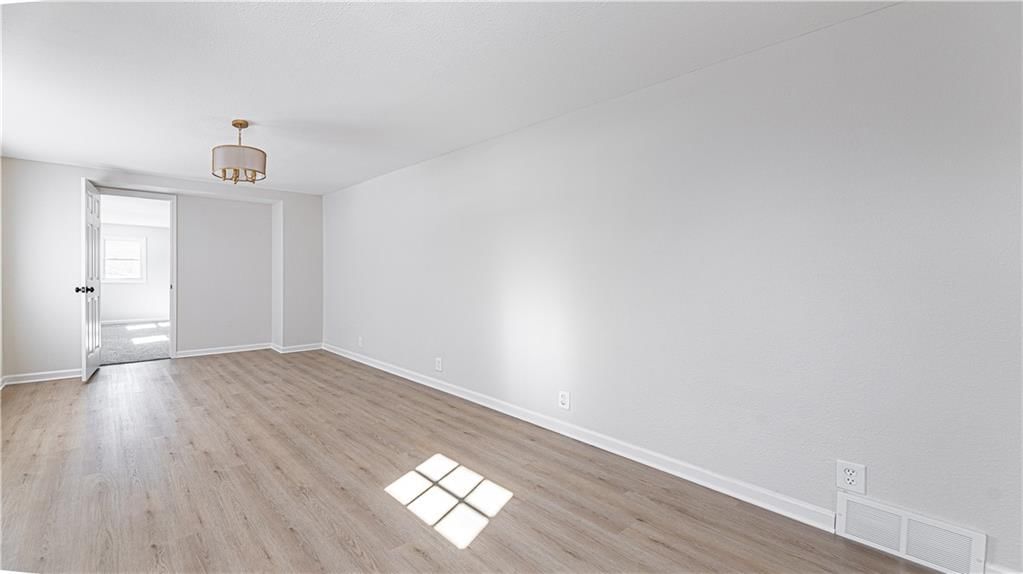
808 NE Russell Road, Kansas City, MO
About Single-Story Homes inKansas City 64116
Kansas City 64116 has 16 single-story homes for sale right now, with a median list price of $289,900 as of Sep 13 These single-story homes were built between 1940 and 2015, ranging from 688 to 2,328 square feet.
Single-Story Homes market trendsKansas City 64116
Kansas City 64116: 35 homes for sale · median asking $304,900 · 17 price reductions · a median of 17 days to contract. 15 homes closed in the last 30 days, at a median of $280,250. At the pace of the last 90 days that is 1.57 months of supply.
Single-Story Homes FAQsKansas City 64116
How many single-story homes are for sale in Kansas City 64116?
What is the median list price of single-story homes in Kansas City 64116?
Schoolsserving 64116
| School | Median list | |
|---|---|---|
| School districts | ||
| North Kansas City School District | Median— | |
| High schools | ||
| North Kansas City | Median— | |
| Middle schools | ||
| Northgate | Median— | |
| Eastgate | Median— | |
| Elementary schools | ||
| Briarcliff | Median— | |
| Crestview | Median— | |
How we compute these
- Median list.
- The middle asking price among the homes for sale right now. Half are listed above it, half below.
- For sale.
- Homes listed as active right now. A live count, not a monthly average.
Recently went under contractin 64116
| Address | List price |
|---|---|
| 711 NE 45th Street | List price$180,000 |
| 1007 E 22nd Avenue | List price$225,000 |
| 4501 NW Baltimore Court | List price$579,000 |
| 4248 NE Kelsey Road | List price$195,000 |
| 313 N Briarcliff Circle | List price$119,000 |
| 1225 43rd Street | List price$159,000 |
| 4546 Kelsey Road | List price$174,000 |
| 4522 N Mulberry Court | List price$995,000 |
| 4615 N Wyandotte Street | List price$525,000 |
| 908 NE 44th Street | List price$225,000 |
| 3704 N Woodland Avenue | List price$265,000 |
| 2509 NE 46th Terrace | List price$230,000 |
How we compute these
- Under contract.
- Homes with an accepted contract that have not closed yet. A live count.
- Days to contract.
- The middle number of days between a home being listed and going under contract, over the last 90 days of closings. It is not days-to-close, and it is not how long today's listings have been sitting. Newly built homes are excluded, because a build finishing is not a market moving.
Homes by featurein 64116
| Feature | For sale |
|---|---|
| Homes with public water | For sale34 |
| Homes with a public sewer | For sale32 |
| No HOA | 25 |
| 2+ full bathrooms | 24 |
| Homes with an attached garage | For sale23 |
| Under 1/4 acre | 22 |
| 3 bedrooms | 19 |
| Homes with wood floors | For sale19 |
| Two or more stories | For sale18 |
| Built before 1960 | 17 |
| Single story | 16 |
| 2+ car garage | 16 |
How we compute these
- For sale.
- Homes listed as active right now. A live count, not a monthly average.
Nearby neighborhoodsto Kansas City
| Neighborhood | Median sale |
|---|---|
| Ruskin Heights | $152,950 |
| Marlborough Heights | $162,000 |
| Armour Hills | $475,000 |
| Ruskin Hills | $167,750 |
| Red Bridge | $350,000 |
| Terrace Lake Gardens | $195,000 |
How we compute these
- Market.
- Market type is set by months of supply — how long it would take to sell every home for sale at the current pace. Under ~4 months favors sellers (low inventory, faster sales, homes near or above asking); over ~6 favors buyers (more choice, more negotiating room). 4–6 is balanced.
- Months supply.
- How many months it would take to sell every home now for sale at the pace of the last 90 days: homes for sale ÷ (closings in the last 90 days ÷ 3).
- For sale.
- Homes listed as active right now. A live count, not a monthly average.
- Days to contract.
- The middle number of days between a home being listed and going under contract, over the last 90 days of closings. It is not days-to-close, and it is not how long today's listings have been sitting. Newly built homes are excluded, because a build finishing is not a market moving.
- Coming soon.
- Homes announced but not yet accepting showings. A live count.
- Under contract.
- Homes with an accepted contract that have not closed yet. A live count.
Search homesnearby 64116
| Place | Median list |
|---|---|
| Kansas City | $265,000 |
| Independence | $220,000 |
| Lee's Summit | $527,500 |
| Blue Springs | $399,500 |
| Raytown | $238,500 |
| Grandview | $274,900 |
How we compute these
- Market.
- Market type is set by months of supply — how long it would take to sell every home for sale at the current pace. Under ~4 months favors sellers (low inventory, faster sales, homes near or above asking); over ~6 favors buyers (more choice, more negotiating room). 4–6 is balanced.
- Months supply.
- How many months it would take to sell every home now for sale at the pace of the last 90 days: homes for sale ÷ (closings in the last 90 days ÷ 3).
- Median list.
- The middle asking price among the homes for sale right now. Half are listed above it, half below.
- Days to contract.
- The middle number of days between a home being listed and going under contract, over the last 90 days of closings. It is not days-to-close, and it is not how long today's listings have been sitting. Newly built homes are excluded, because a build finishing is not a market moving.
- For sale.
- Homes listed as active right now. A live count, not a monthly average.
- Coming soon.
- Homes announced but not yet accepting showings. A live count.
- Under contract.
- Homes with an accepted contract that have not closed yet. A live count.
NearbyZIP codes
How we compute these
- Market.
- Market type is set by months of supply — how long it would take to sell every home for sale at the current pace. Under ~4 months favors sellers (low inventory, faster sales, homes near or above asking); over ~6 favors buyers (more choice, more negotiating room). 4–6 is balanced.
- Months supply.
- How many months it would take to sell every home now for sale at the pace of the last 90 days: homes for sale ÷ (closings in the last 90 days ÷ 3).
- Median list.
- The middle asking price among the homes for sale right now. Half are listed above it, half below.
- Days to contract.
- The middle number of days between a home being listed and going under contract, over the last 90 days of closings. It is not days-to-close, and it is not how long today's listings have been sitting. Newly built homes are excluded, because a build finishing is not a market moving.
- For sale.
- Homes listed as active right now. A live count, not a monthly average.
- Coming soon.
- Homes announced but not yet accepting showings. A live count.
- Under contract.
- Homes with an accepted contract that have not closed yet. A live count.
Search homes for salein every city we cover
How we compute these
- Market.
- Market type is set by months of supply — how long it would take to sell every home for sale at the current pace. Under ~4 months favors sellers (low inventory, faster sales, homes near or above asking); over ~6 favors buyers (more choice, more negotiating room). 4–6 is balanced.
- Months supply.
- How many months it would take to sell every home now for sale at the pace of the last 90 days: homes for sale ÷ (closings in the last 90 days ÷ 3).
- Median list.
- The middle asking price among the homes for sale right now. Half are listed above it, half below.
- Days to contract.
- The middle number of days between a home being listed and going under contract, over the last 90 days of closings. It is not days-to-close, and it is not how long today's listings have been sitting. Newly built homes are excluded, because a build finishing is not a market moving.
- For sale.
- Homes listed as active right now. A live count, not a monthly average.
- Coming soon.
- Homes announced but not yet accepting showings. A live count.
- Under contract.
- Homes with an accepted contract that have not closed yet. A live count.
Search for homesin popular markets
| Market | For sale |
|---|---|
| Heritage Ranch | 28 |
| Canyon Lakes | 25 |
| Garrett Ranch | 24 |
| Seven Bridges | 23 |
| Ruskin Heights | 23 |
| Tomahawk Valley | 23 |
How we compute these
- Market.
- Market type is set by months of supply — how long it would take to sell every home for sale at the current pace. Under ~4 months favors sellers (low inventory, faster sales, homes near or above asking); over ~6 favors buyers (more choice, more negotiating room). 4–6 is balanced.
- For sale.
- Homes listed as active right now. A live count, not a monthly average.
Or go wider stillcounty, metro and state
How we compute these
- Market.
- Market type is set by months of supply — how long it would take to sell every home for sale at the current pace. Under ~4 months favors sellers (low inventory, faster sales, homes near or above asking); over ~6 favors buyers (more choice, more negotiating room). 4–6 is balanced.
- Months supply.
- How many months it would take to sell every home now for sale at the pace of the last 90 days: homes for sale ÷ (closings in the last 90 days ÷ 3).
- Median list.
- The middle asking price among the homes for sale right now. Half are listed above it, half below.
- Days to contract.
- The middle number of days between a home being listed and going under contract, over the last 90 days of closings. It is not days-to-close, and it is not how long today's listings have been sitting. Newly built homes are excluded, because a build finishing is not a market moving.
- For sale.
- Homes listed as active right now. A live count, not a monthly average.
- Coming soon.
- Homes announced but not yet accepting showings. A live count.
- Under contract.
- Homes with an accepted contract that have not closed yet. A live count.