
Homes on a Cul-de-Sac for Sale in Shawnee, KS
45 homes fit this search · Sorted by Newest Listed


6026 Apache Drive, Shawnee, KS
New · 2d ago

21807 W 46th Terrace, Shawnee, KS
New · 4d ago


4508 Millridge Street, Shawnee, KS
New · 5d ago


5304 Mullen Road, Shawnee, KS
New · 5d ago


12714 W 49th Terrace, Shawnee, KS


6655 OAK RIDGE Drive, Shawnee, KS


20908 W 53rd Street, Shawnee, KS


22310 W 76th Street, Shawnee, KS


24625 W 60 Terrace, Shawnee, KS


24624 W 60th Terrace, Shawnee, KS


4927 Brockway Street, Shawnee, KS

5630 Legler Street, Shawnee, KS


5906 McCormick Drive, Shawnee, KS


5902 McCormick Drive, Shawnee, KS


23819 W 59th Terrace, Shawnee, KS


23903 Clear Creek Parkway, Shawnee, KS


24620 W 60th Terrace, Shawnee, KS


21324 W 51st Court, Shawnee, KS


6001 Lone Elm Road, Shawnee, KS


24615 W 60th Terrace, Shawnee, KS


6908 Millridge Street, Shawnee, KS


7560 Eicher Drive, Shawnee, KS


23416 W 71st Terrace, Shawnee, KS

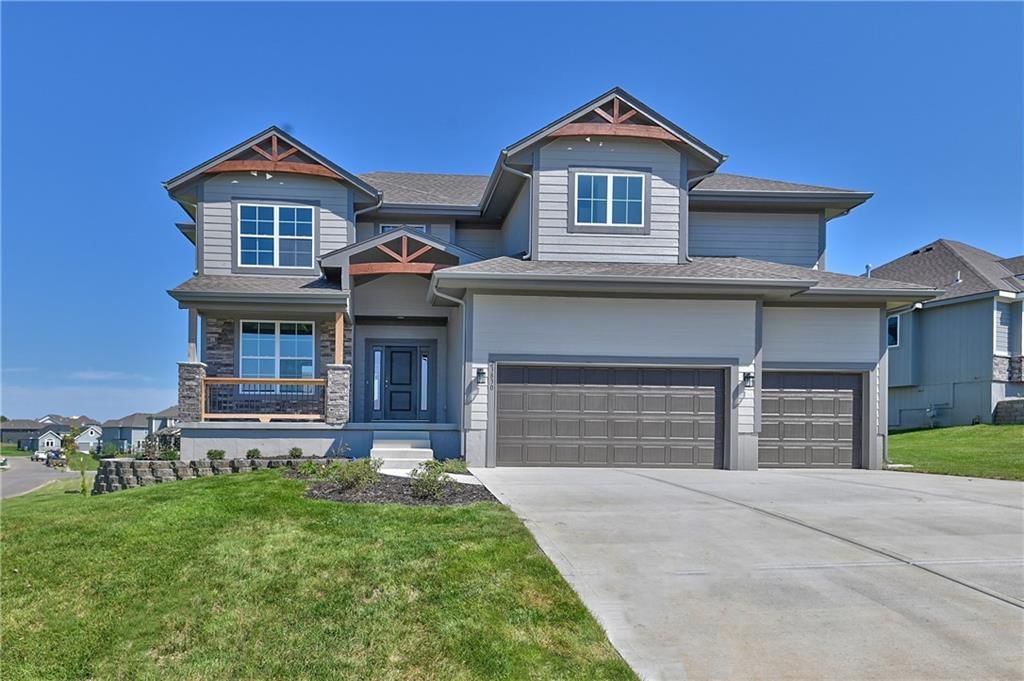
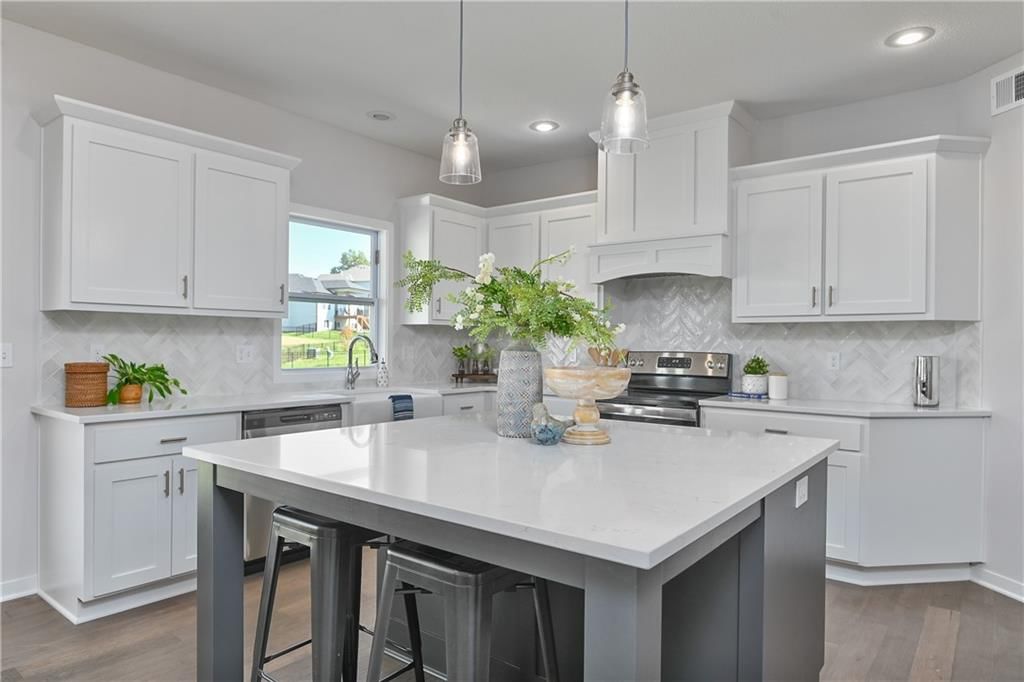
6012 Arapahoe Street, Shawnee, KS
About Homes with Cul-de-sac in Shawnee, KS
Shawnee, KS has 45 homes with cul-de-sac for sale right now, with a median list price of $554,975 as of Sep 30 These homes with cul-de-sac were built between 1977 and 2026, ranging from 1,674 to 6,023 square feet.
Homes with Cul-de-sac market trends Shawnee, KS
Shawnee, KS: 153 homes for sale · 6 new in the last 7 days · median asking $559,950 · 50 price reductions · a median of 16 days to contract. 74 homes closed in the last 30 days, at a median of $426,500. At the pace of the last 90 days that is 1.9 months of supply.
| Measure | Aug 2026 |
|---|---|
| Median sale price | $420,000 |
| Median price per sq ft | $200 |
| Median days to contract | 16 |
| Sell-to-list ratio | 101% |
| Homes sold | 85 |
| New listings | 103 |
| Went under contract | 78 |
Homes with Cul-de-sac FAQs Shawnee, KS
How many homes with cul-de-sac are for sale in Shawnee, KS?
What is the median list price of homes with cul-de-sac in Shawnee, KS?
Schools serving Shawnee
| School | Median list | |
|---|---|---|
| School districts | ||
| De Soto School District | $664,950 | |
| Shawnee Mission School District | $390,000 | |
| High schools | ||
| Mill Valley | $600,000 | |
| De Soto | $669,950 | |
| Shawnee Mission Northwest | $397,000 | |
| Shawnee Mission North | Median— | |
| Middle schools | ||
| Mill Creek | $699,950 | |
| Trailridge | $395,000 | |
| Hocker Grove | $360,000 | |
| Monticello Trails | $489,950 | |
| Elementary schools | ||
| Belmont | $709,950 | |
| Horizon | $875,000 | |
How we compute these
- Median list.
- The middle asking price among the homes for sale right now. Half are listed above it, half below.
- For sale.
- Homes listed as active right now. A live count, not a monthly average.
Newly listed in Shawnee, KS
| Address | Price |
|---|---|
| 6026 Apache Drive | Price$795,000 |
| 10930 W 65th Street | Price$419,995 |
| 5304 Mullen Road | Price$530,000 |
| 22218 W 57th Street | Price$775,000 |
| 6034 Apache Drive | Price$774,950 |
| 14118 W 61st Terrace | Price$455,000 |
Recently went under contract in Shawnee, KS
| Address | List price |
|---|---|
| 21425 W 47th Terrace | List price$500,000 |
| 16310 W 65th Street | List price$18 |
| 14303 W 58th Terrace | List price$600,000 |
| 10314 W 48th Street | List price$400,000 |
| 6812 haskins Street | List price$450,000 |
| 7106 Halsey Drive | List price$410,000 |
| 5725 Earnshaw Street | List price$348,000 |
| 7104 Melrose Lane | List price$284,950 |
| 21408 W 51st Terrace | List price$385,000 |
| 7943 Millridge Street | List price$1,224,960 |
| 5124 Noble Street | List price$425,000 |
| 7206 Noland Road | List price$759,900 |
How we compute these
- Under contract.
- Homes with an accepted contract that have not closed yet. A live count.
- Days to contract.
- The middle number of days between a home being listed and going under contract, over the last 90 days of closings. It is not days-to-close, and it is not how long today's listings have been sitting. Newly built homes are excluded, because a build finishing is not a market moving.
Popular home searches in Shawnee
| Search | For sale |
|---|---|
| Open houses | 23 |
| Luxury homes | 17 |
| Just listed homes | 14 |
| Price-reduced homes | 50 |
| Coming soon homes | 24 |
| Homes under contract | 107 |
How we compute these
- For sale.
- Homes listed as active right now. A live count, not a monthly average.
Homes by price in Shawnee
How we compute these
- For sale.
- Homes listed as active right now. A live count, not a monthly average.
Homes by feature in Shawnee
How we compute these
- For sale.
- Homes listed as active right now. A live count, not a monthly average.
Search by property type in Shawnee
| Property type | Median sale |
|---|---|
| Single Family | $445,000 |
| Townhouse | $322,500 |
| Villa | Median— |
| Condo / Loft | Median— |
| Duplex | Median— |
| Triplex | Median— |
| Lots / Land | $293,500 |
How we compute these
- Market.
- Market type is set by months of supply — how long it would take to sell every home for sale at the current pace. Under ~4 months favors sellers (low inventory, faster sales, homes near or above asking); over ~6 favors buyers (more choice, more negotiating room). 4–6 is balanced.
- Months supply.
- How many months it would take to sell every home now for sale at the pace of the last 90 days: homes for sale ÷ (closings in the last 90 days ÷ 3).
- For sale.
- Homes listed as active right now. A live count, not a monthly average.
- Days to contract.
- The middle number of days between a home being listed and going under contract, over the last 90 days of closings. It is not days-to-close, and it is not how long today's listings have been sitting. Newly built homes are excluded, because a build finishing is not a market moving.
- Coming soon.
- Homes announced but not yet accepting showings. A live count.
- Under contract.
- Homes with an accepted contract that have not closed yet. A live count.
Nearby neighborhoods to Shawnee
| Neighborhood | Median sale |
|---|---|
| Canyon Lakes | $725,000 |
| Shawnee Village | $255,000 |
| Bristol Highlands | $1,053,950 |
| Hillcrest Farm | $451,750 |
| Lakepointe | $467,500 |
| Lakeview Est | $549,500 |
How we compute these
- Market.
- Market type is set by months of supply — how long it would take to sell every home for sale at the current pace. Under ~4 months favors sellers (low inventory, faster sales, homes near or above asking); over ~6 favors buyers (more choice, more negotiating room). 4–6 is balanced.
- Months supply.
- How many months it would take to sell every home now for sale at the pace of the last 90 days: homes for sale ÷ (closings in the last 90 days ÷ 3).
- For sale.
- Homes listed as active right now. A live count, not a monthly average.
- Days to contract.
- The middle number of days between a home being listed and going under contract, over the last 90 days of closings. It is not days-to-close, and it is not how long today's listings have been sitting. Newly built homes are excluded, because a build finishing is not a market moving.
- Coming soon.
- Homes announced but not yet accepting showings. A live count.
- Under contract.
- Homes with an accepted contract that have not closed yet. A live count.
Search homes nearby Shawnee
| Place | Median list |
|---|---|
| Shawnee | $554,975 |
| Overland Park | $736,400 |
| Olathe | $632,900 |
| Lenexa | $651,500 |
| Leawood | $924,500 |
| Prairie Village | $1,110,000 |
How we compute these
- Market.
- Market type is set by months of supply — how long it would take to sell every home for sale at the current pace. Under ~4 months favors sellers (low inventory, faster sales, homes near or above asking); over ~6 favors buyers (more choice, more negotiating room). 4–6 is balanced.
- Months supply.
- How many months it would take to sell every home now for sale at the pace of the last 90 days: homes for sale ÷ (closings in the last 90 days ÷ 3).
- Median list.
- The middle asking price among the homes for sale right now. Half are listed above it, half below.
- Days to contract.
- The middle number of days between a home being listed and going under contract, over the last 90 days of closings. It is not days-to-close, and it is not how long today's listings have been sitting. Newly built homes are excluded, because a build finishing is not a market moving.
- For sale.
- Homes listed as active right now. A live count, not a monthly average.
- Coming soon.
- Homes announced but not yet accepting showings. A live count.
- Under contract.
- Homes with an accepted contract that have not closed yet. A live count.
Nearby ZIP codes
| Place | Median list |
|---|---|
| 66203 | $347,000 |
| 66226 | $664,950 |
| 66218 | $610,000 |
| 66216 | $411,900 |
| 66225 | Median— |
| 66217 | $615,000 |
How we compute these
- Market.
- Market type is set by months of supply — how long it would take to sell every home for sale at the current pace. Under ~4 months favors sellers (low inventory, faster sales, homes near or above asking); over ~6 favors buyers (more choice, more negotiating room). 4–6 is balanced.
- Months supply.
- How many months it would take to sell every home now for sale at the pace of the last 90 days: homes for sale ÷ (closings in the last 90 days ÷ 3).
- Median list.
- The middle asking price among the homes for sale right now. Half are listed above it, half below.
- Days to contract.
- The middle number of days between a home being listed and going under contract, over the last 90 days of closings. It is not days-to-close, and it is not how long today's listings have been sitting. Newly built homes are excluded, because a build finishing is not a market moving.
- For sale.
- Homes listed as active right now. A live count, not a monthly average.
- Coming soon.
- Homes announced but not yet accepting showings. A live count.
- Under contract.
- Homes with an accepted contract that have not closed yet. A live count.
Search homes for sale in every city we cover
How we compute these
- Market.
- Market type is set by months of supply — how long it would take to sell every home for sale at the current pace. Under ~4 months favors sellers (low inventory, faster sales, homes near or above asking); over ~6 favors buyers (more choice, more negotiating room). 4–6 is balanced.
- Months supply.
- How many months it would take to sell every home now for sale at the pace of the last 90 days: homes for sale ÷ (closings in the last 90 days ÷ 3).
- Median list.
- The middle asking price among the homes for sale right now. Half are listed above it, half below.
- Days to contract.
- The middle number of days between a home being listed and going under contract, over the last 90 days of closings. It is not days-to-close, and it is not how long today's listings have been sitting. Newly built homes are excluded, because a build finishing is not a market moving.
- For sale.
- Homes listed as active right now. A live count, not a monthly average.
- Coming soon.
- Homes announced but not yet accepting showings. A live count.
- Under contract.
- Homes with an accepted contract that have not closed yet. A live count.
Search for homes in popular markets
| Market | For sale |
|---|---|
| Heritage Ranch | 29 |
| Canyon Lakes | 27 |
| Seven Bridges | 26 |
| Garrett Ranch | 24 |
| Tomahawk Valley | 22 |
| Woodlawn Estates | 21 |
How we compute these
- Market.
- Market type is set by months of supply — how long it would take to sell every home for sale at the current pace. Under ~4 months favors sellers (low inventory, faster sales, homes near or above asking); over ~6 favors buyers (more choice, more negotiating room). 4–6 is balanced.
- For sale.
- Homes listed as active right now. A live count, not a monthly average.
Or go wider still county, metro and state
How we compute these
- Market.
- Market type is set by months of supply — how long it would take to sell every home for sale at the current pace. Under ~4 months favors sellers (low inventory, faster sales, homes near or above asking); over ~6 favors buyers (more choice, more negotiating room). 4–6 is balanced.
- Months supply.
- How many months it would take to sell every home now for sale at the pace of the last 90 days: homes for sale ÷ (closings in the last 90 days ÷ 3).
- Median list.
- The middle asking price among the homes for sale right now. Half are listed above it, half below.
- Days to contract.
- The middle number of days between a home being listed and going under contract, over the last 90 days of closings. It is not days-to-close, and it is not how long today's listings have been sitting. Newly built homes are excluded, because a build finishing is not a market moving.
- For sale.
- Homes listed as active right now. A live count, not a monthly average.
- Coming soon.
- Homes announced but not yet accepting showings. A live count.
- Under contract.
- Homes with an accepted contract that have not closed yet. A live count.