
Little Village, Kansas City MO Real Estate & Homes For Sale
· 1 home for sale in Little Village1 home for sale in Little Village · Sorted by Newest Listed
Real estate in Little Village, Kansas City, Missouri
Little Village, Kansas City has 1 home for sale right now, with a median list price of $105,000. These homes were built in 1945. They are 1,324 square feet.
Housing market trends in Little Village, Kansas City, Missouri
1
Homes for sale in Little Village
$105,000
Median list price
| Measure | Nov 2025–Oct 2026 | Oct 2025–Sep 2026 | Nov 2024–Oct 2025 |
|---|---|---|---|
| Median sale price | $246,750 | $231,750 | $251,000 |
| Median price per sq ft | $185 | $191 | $187 |
| Median days to contract | 24 | 18 | 12 |
| Sell-to-list ratio | 100% | — | 100% |
| Homes sold | 10 | 8 | 12 |
| New listings | 10 | 11 | 12 |
| Went under contract | 10 | 10 | 12 |
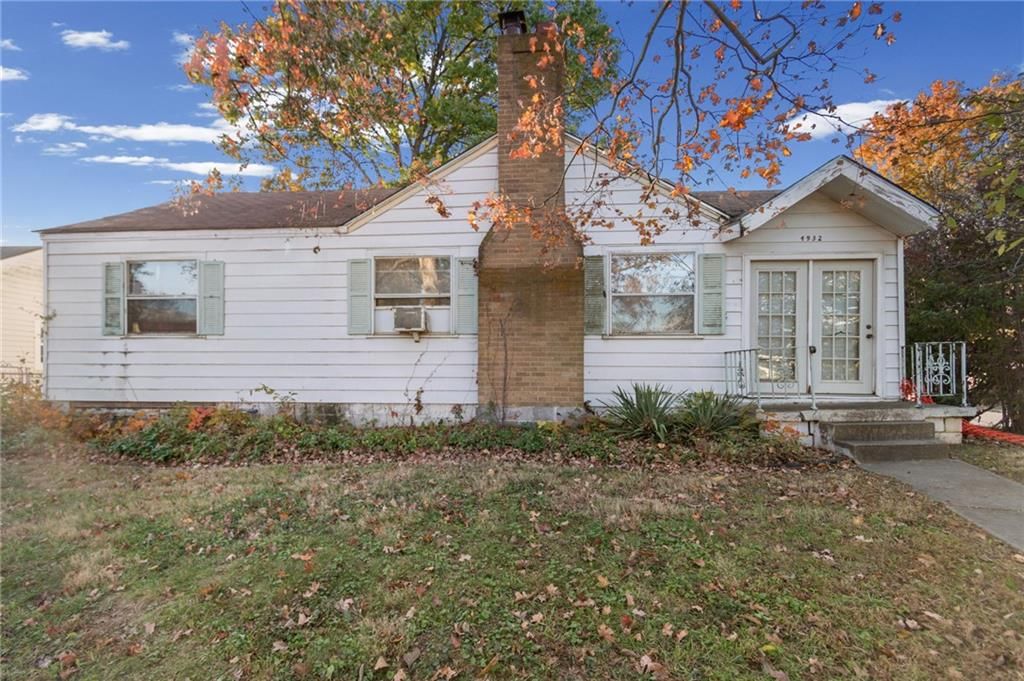
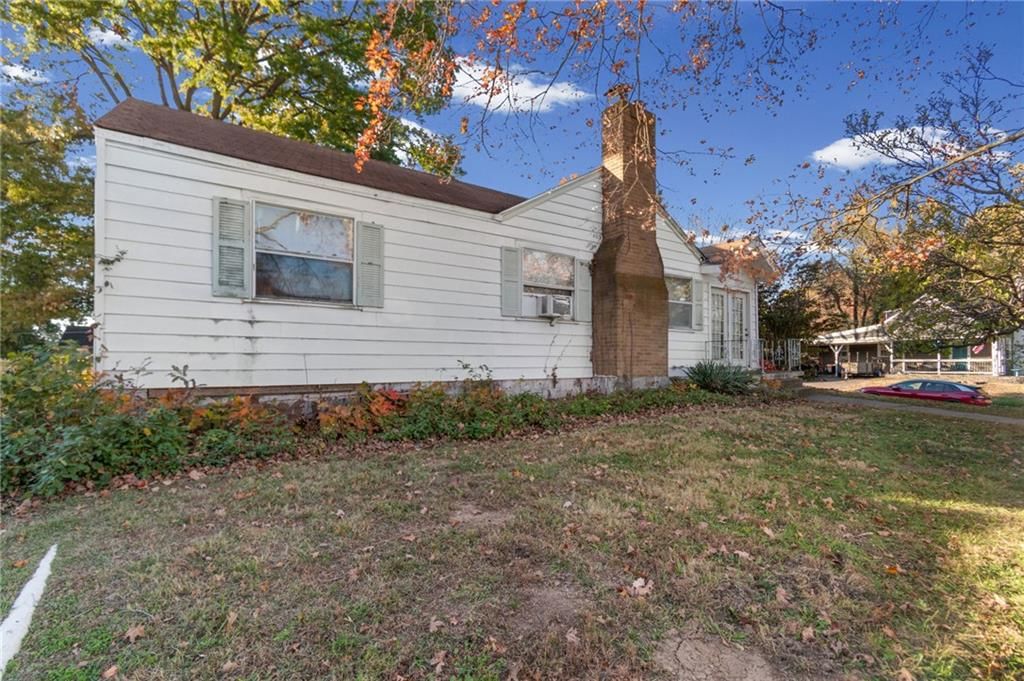
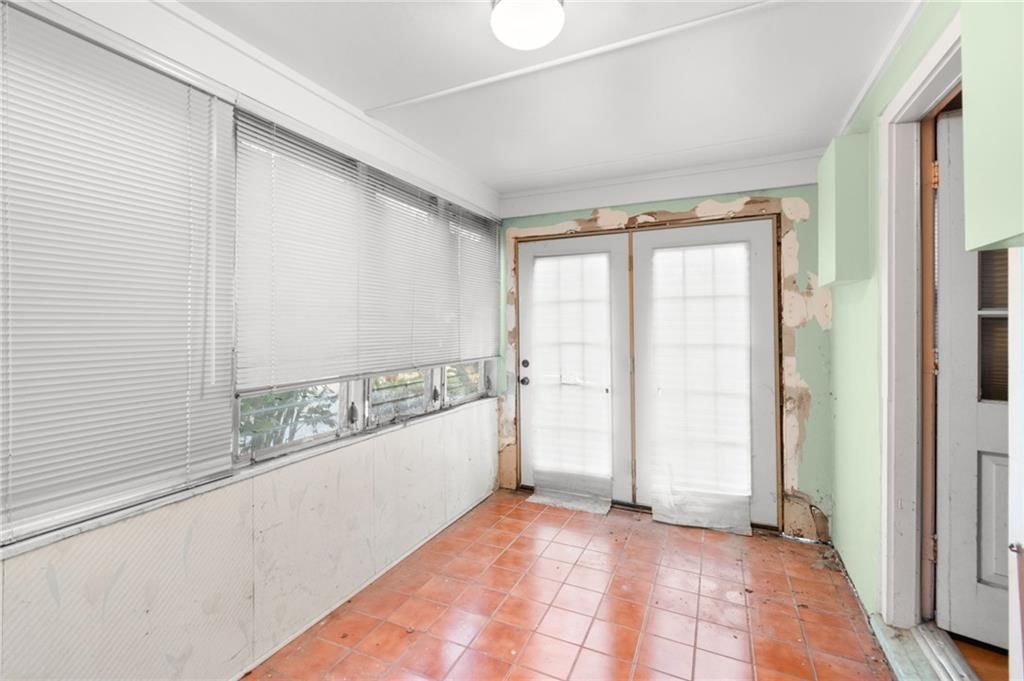
35 photos
New · 21h ago
② Its neighborhoods — one step out
Nearby neighborhoods to Little Village
| Neighborhood | Market (Market type is set by months of supply — how long it would take to sell every home for sale at the current pace. Under ~4 months favors sellers (low inventory, faster sales, homes near or above asking); over ~6 favors buyers (more choice, more negotiating room). 4–6 is balanced.) | Months supply | For sale | Median sale | Sell-to-list | Days to contract | Coming soon | Under contract |
|---|---|---|---|---|---|---|---|---|
| Gracemor | Strong Seller's | 0.4 mo | 1 | Median$240,000 | 100% | 13d | 0 | 1 |
| Somerbrook | Strong Seller's | 0.6 mo | 2 | Median$462,174 | 100% | 22d | 0 | 13 |
| Staley Farms | Seller's ▲ | 2.9 mo | 10 | Median$720,000 | 97% | 37d | 0 | 11 |
| Crestview | Strong Seller's | 1.8 mo | 4 | Median$175,000 | 100% | 39d | 1 | 3 |
| Sherwood Estates | Strong Seller's | 0.5 mo | 1 | Median$294,500 | 98% | 22d | 0 | 1 |
How we compute these
- Market.
- Market type is set by months of supply — how long it would take to sell every home for sale at the current pace. Under ~4 months favors sellers (low inventory, faster sales, homes near or above asking); over ~6 favors buyers (more choice, more negotiating room). 4–6 is balanced.
- Months supply.
- How many months it would take to sell every home now for sale at the pace of the last 90 days: homes for sale ÷ (closings in the last 90 days ÷ 3).
- For sale.
- Homes listed as active right now. A live count, not a monthly average.
- Days to contract.
- The middle number of days between a home being listed and going under contract, over the last 90 days of closings. It is not days-to-close, and it is not how long today's listings have been sitting. Newly built homes are excluded, because a build finishing is not a market moving.
- Coming soon.
- Homes announced but not yet accepting showings. A live count.
- Under contract.
- Homes with an accepted contract that have not closed yet. A live count.
③ Nearby cities — two steps out
Search homes nearby Little Village
| Place | Market (Market type is set by months of supply — how long it would take to sell every home for sale at the current pace. Under ~4 months favors sellers (low inventory, faster sales, homes near or above asking); over ~6 favors buyers (more choice, more negotiating room). 4–6 is balanced.) | Months supply | Median list | Sell-to-list | Days to contract | For sale | Coming soon | Under contract |
|---|---|---|---|---|---|---|---|---|
| Kansas City | Seller's | 3.9 mo | Median$259,000 | 98% | 21d | 2,170 | 81 | 767 |
| Liberty | Seller's | 2.6 mo | Median$438,950 | 97% | 24d | 101 | 6 | 46 |
| Gladstone | Seller's | 2.1 mo | Median$264,950 | 97% | 15d | 50 | 3 | 30 |
| Kearney | Balanced | 4.2 mo | Median$492,000 | 98% | 24d | 103 | 4 | 33 |
| Smithville | Balanced | 4.4 mo | Median$333,750 | 97% | 22d | 90 | 2 | 21 |
How we compute these
- Market.
- Market type is set by months of supply — how long it would take to sell every home for sale at the current pace. Under ~4 months favors sellers (low inventory, faster sales, homes near or above asking); over ~6 favors buyers (more choice, more negotiating room). 4–6 is balanced.
- Months supply.
- How many months it would take to sell every home now for sale at the pace of the last 90 days: homes for sale ÷ (closings in the last 90 days ÷ 3).
- Median list.
- The middle asking price among the homes for sale right now. Half are listed above it, half below.
- Days to contract.
- The middle number of days between a home being listed and going under contract, over the last 90 days of closings. It is not days-to-close, and it is not how long today's listings have been sitting. Newly built homes are excluded, because a build finishing is not a market moving.
- For sale.
- Homes listed as active right now. A live count, not a monthly average.
- Coming soon.
- Homes announced but not yet accepting showings. A live count.
- Under contract.
- Homes with an accepted contract that have not closed yet. A live count.
④ Zip codes
Nearby ZIP codes
| Place | Market (Market type is set by months of supply — how long it would take to sell every home for sale at the current pace. Under ~4 months favors sellers (low inventory, faster sales, homes near or above asking); over ~6 favors buyers (more choice, more negotiating room). 4–6 is balanced.) | Months supply | Median list | Sell-to-list | Days to contract | For sale | Coming soon | Under contract |
|---|---|---|---|---|---|---|---|---|
| 64119 | Seller's | 2.3 mo | Median$269,900 | 99% | 20d | 95 | 3 | 44 |
| 64157 | Seller's | 2.8 mo | Median$500,000 | 98% | 18d | 95 | 7 | 45 |
| 64151 | Seller's | 2.6 mo | Median$398,950 | 99% | 19d | 81 | 7 | 37 |
| 64154 | Seller's | 3.3 mo | Median$450,000 | 101% | 20d | 64 | 1 | 32 |
How we compute these
- Market.
- Market type is set by months of supply — how long it would take to sell every home for sale at the current pace. Under ~4 months favors sellers (low inventory, faster sales, homes near or above asking); over ~6 favors buyers (more choice, more negotiating room). 4–6 is balanced.
- Months supply.
- How many months it would take to sell every home now for sale at the pace of the last 90 days: homes for sale ÷ (closings in the last 90 days ÷ 3).
- Median list.
- The middle asking price among the homes for sale right now. Half are listed above it, half below.
- Days to contract.
- The middle number of days between a home being listed and going under contract, over the last 90 days of closings. It is not days-to-close, and it is not how long today's listings have been sitting. Newly built homes are excluded, because a build finishing is not a market moving.
- For sale.
- Homes listed as active right now. A live count, not a monthly average.
- Coming soon.
- Homes announced but not yet accepting showings. A live count.
- Under contract.
- Homes with an accepted contract that have not closed yet. A live count.