
64012 (Belton, MO) Real Estate & Homes For Sale
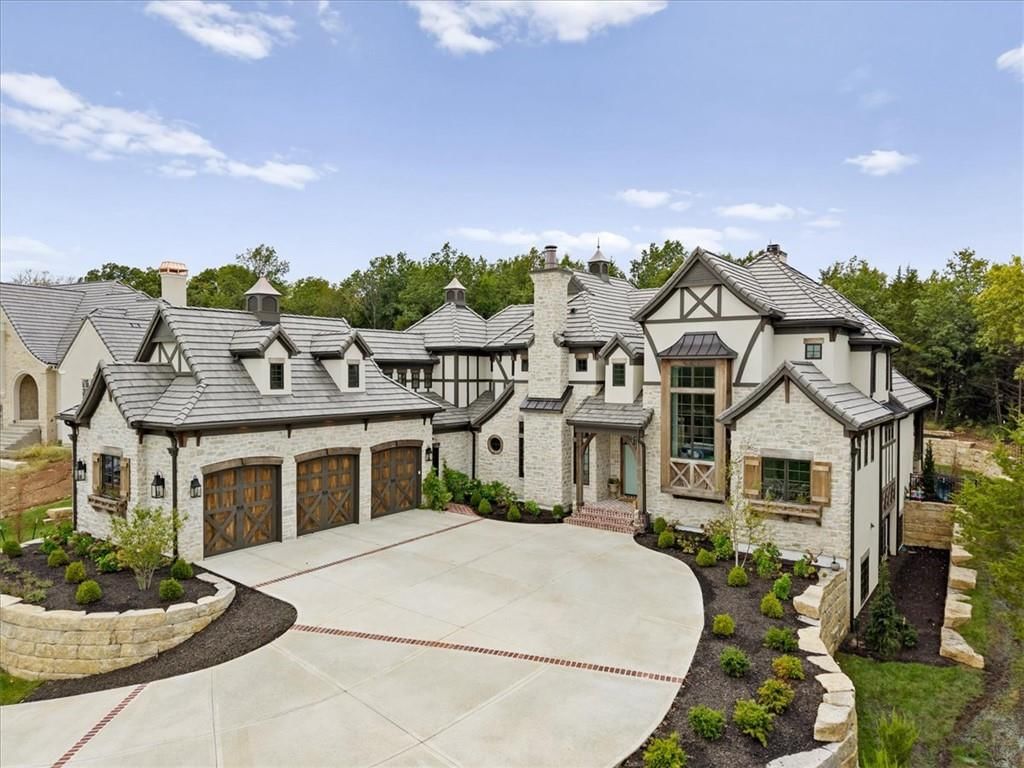
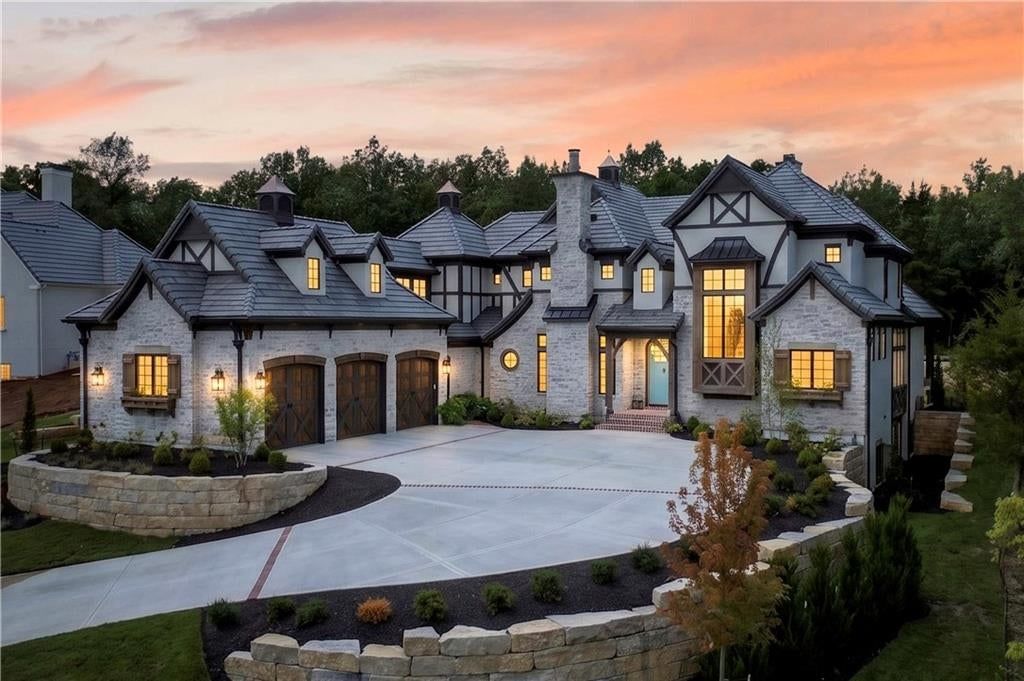
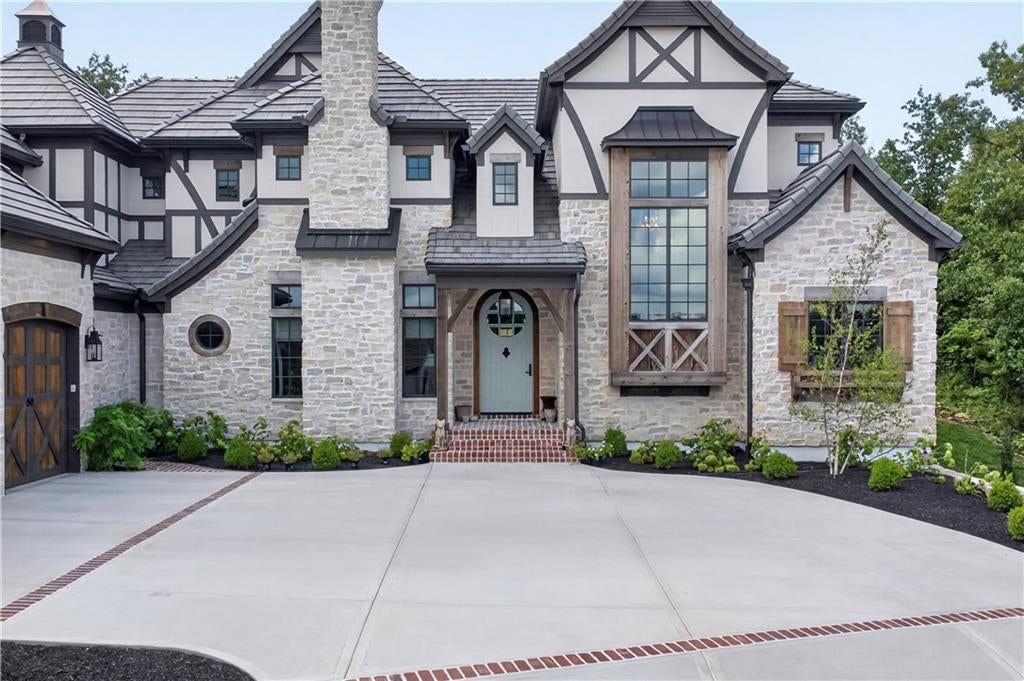
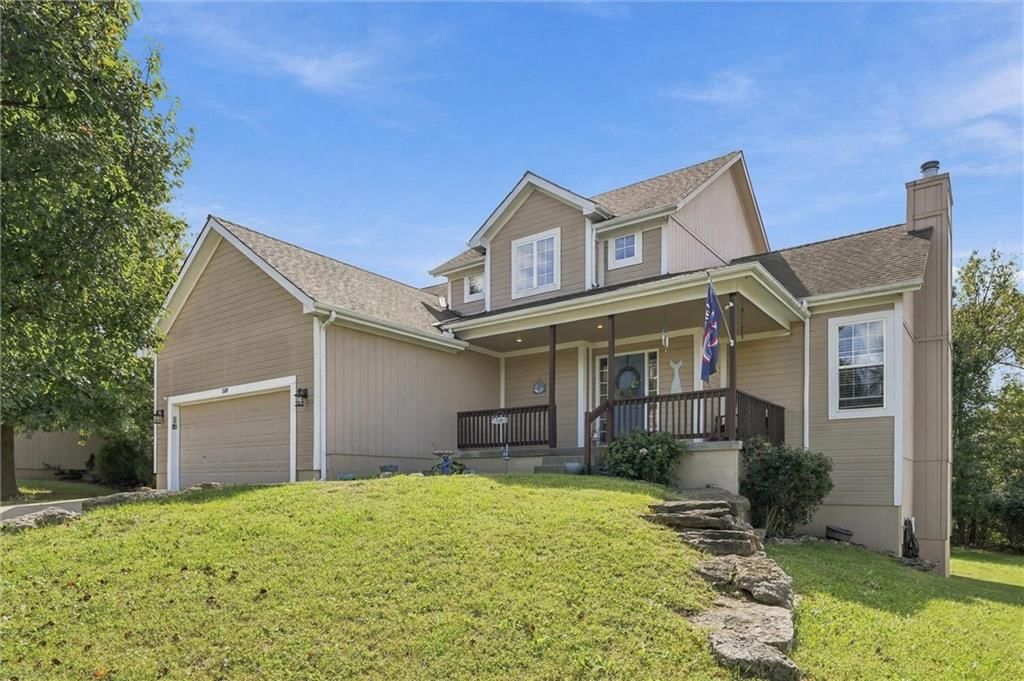
· 88 homes for sale in 64012HouseLoop Vision identified 35 homes for sale in 64012 with white kitchen cabinets, 13 with a freestanding tub, 6 with a pool, 5 with a home gym, 64 with a big backyard and 32 with a finished basement, plus 4 more features. See what HouseLoop Vision found
88 homes for sale in 64012 · Sorted by Newest Listed
Real estate in 64012 in Belton, Missouri
Belton 64012 has about 12,411 households and a median household income of $71,814. Roughly 65% of homes are owner-occupied, the median owner's home value is $221,200, 28% of adults hold a bachelor's degree or higher. The average commute runs 25.3 minutes. About 29,304 people live in Belton 64012, per the U.S. Census Bureau's American Community Survey 5-year estimate (2020–2024).
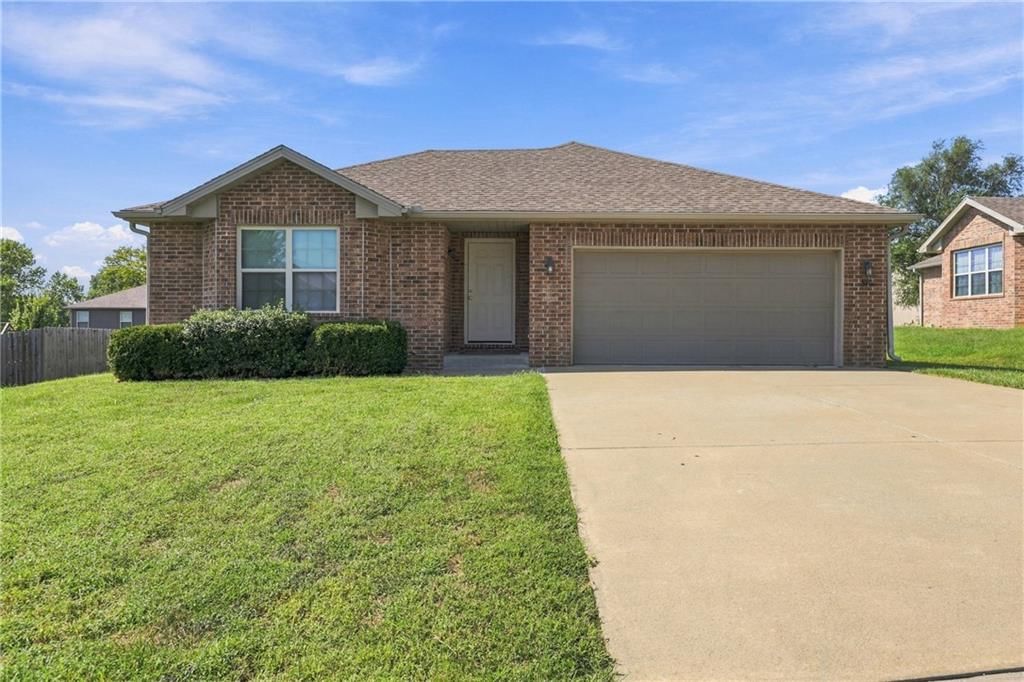
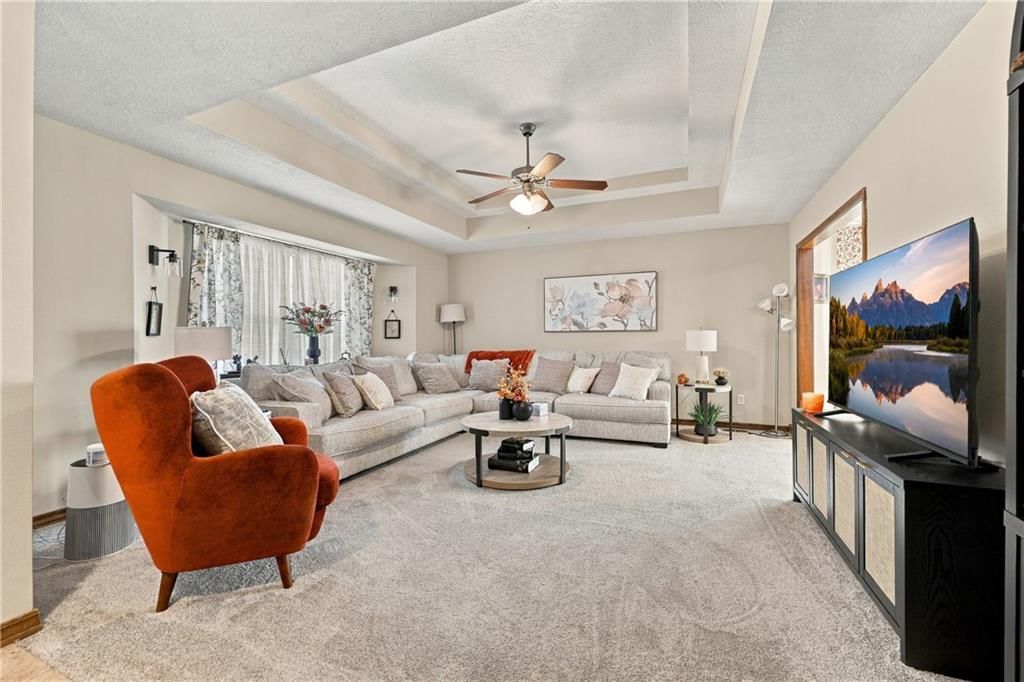
Belton 64012 has 88 homes for sale right now, 1 of them coming soon, with a median list price of $377,245. These homes were built between 1900 and 2026. They range from 853 to 9,677 square feet.
Housing market trends in 64012 in Belton, Missouri
| Measure | Aug–Oct 2026 | May–Jul 2026 | Aug–Oct 2025 |
|---|---|---|---|
| Median sale price | $305,500 | $300,000 | $310,000 |
| Median price per sq ft | $173 | $178 | $181 |
| Median days to contract | 20 | 19 | 25 |
| Sell-to-list ratio | 100% | 100% | 100% |
| Homes sold, three months | 100 | 107 | 77 |
| New listings | 131 | 134 | 92 |
| Went under contract | 95 | 120 | 81 |
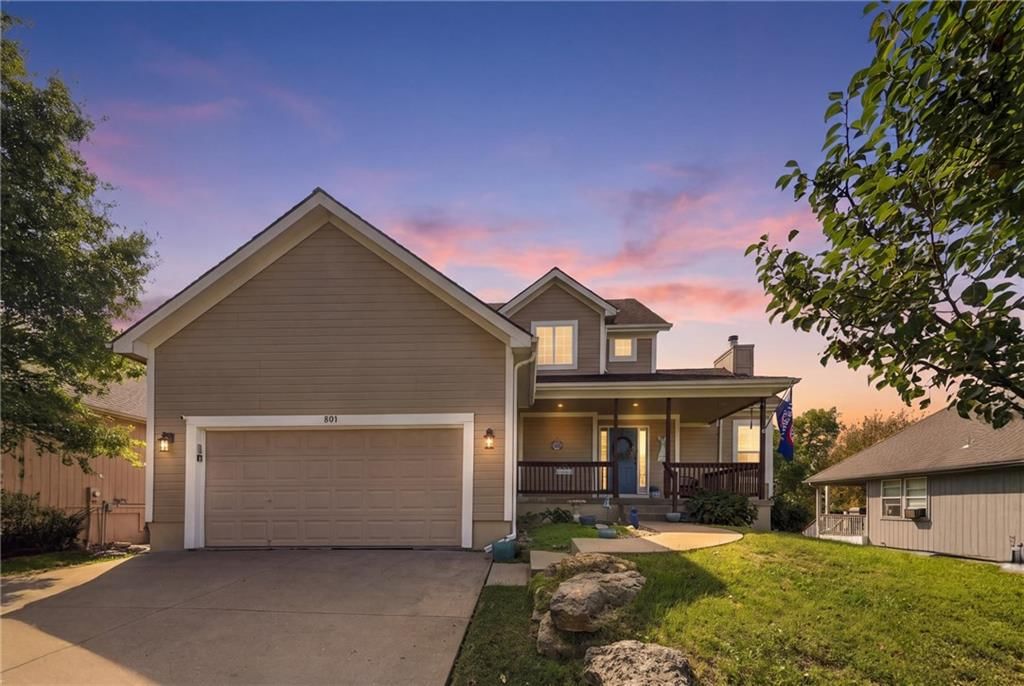
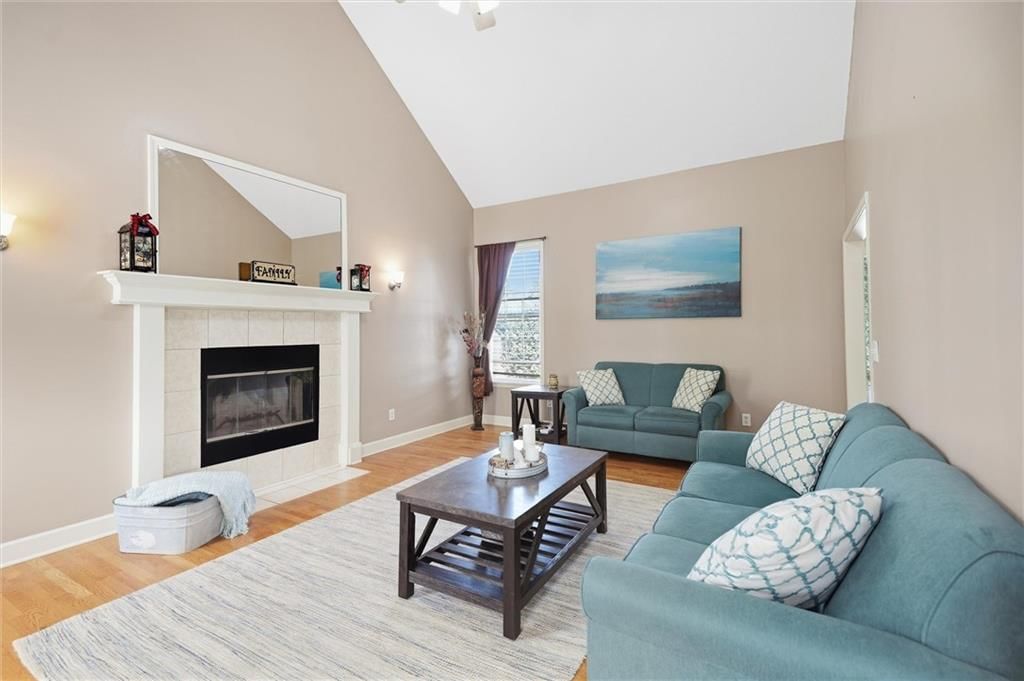
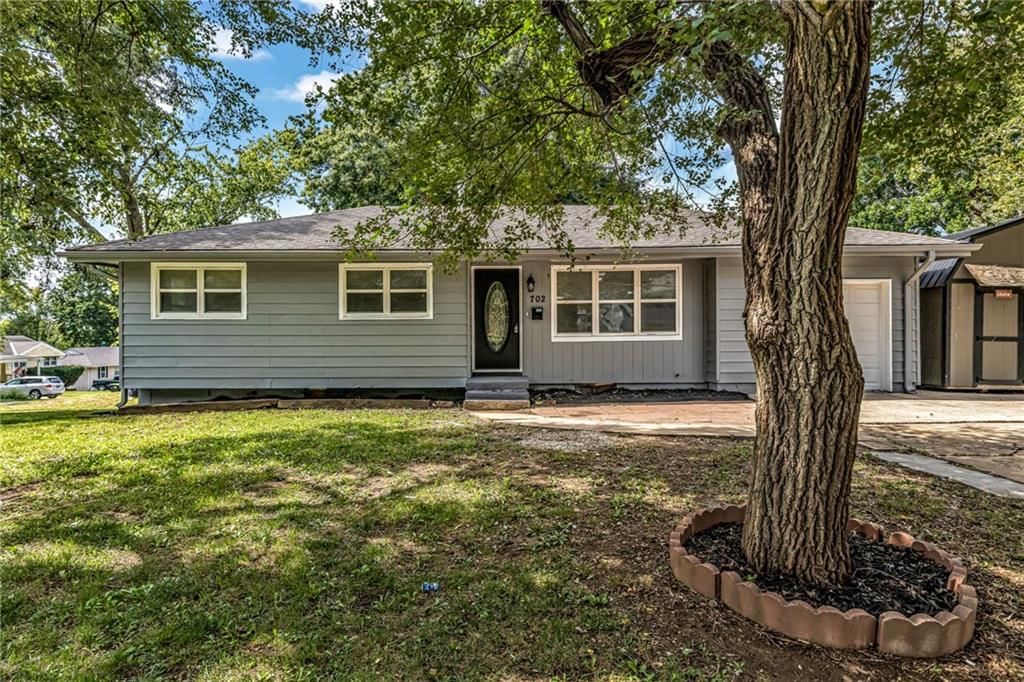
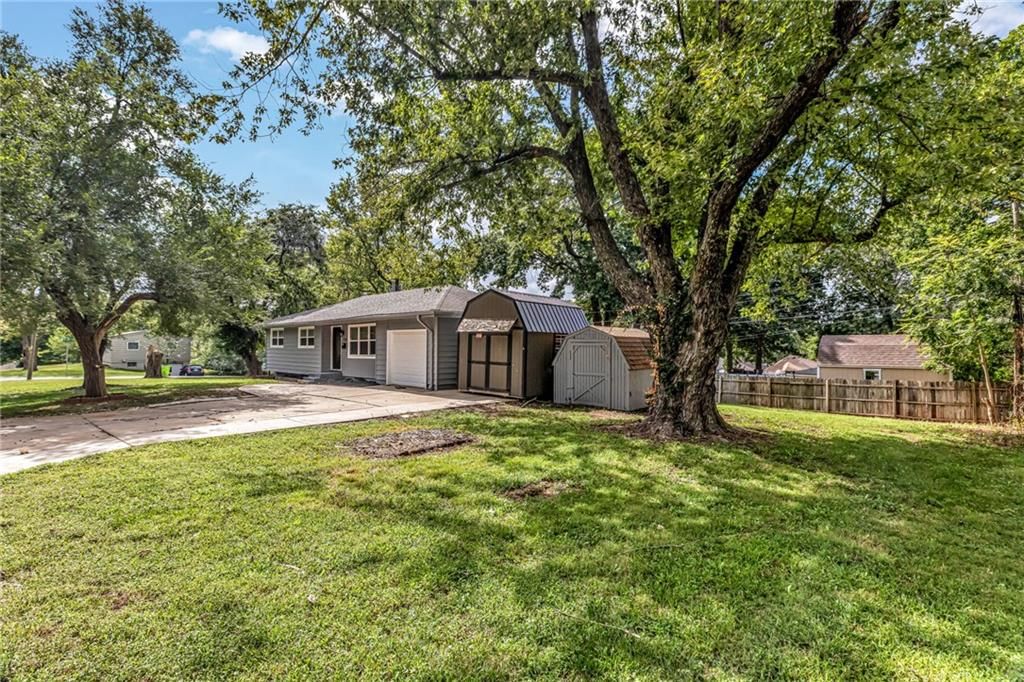
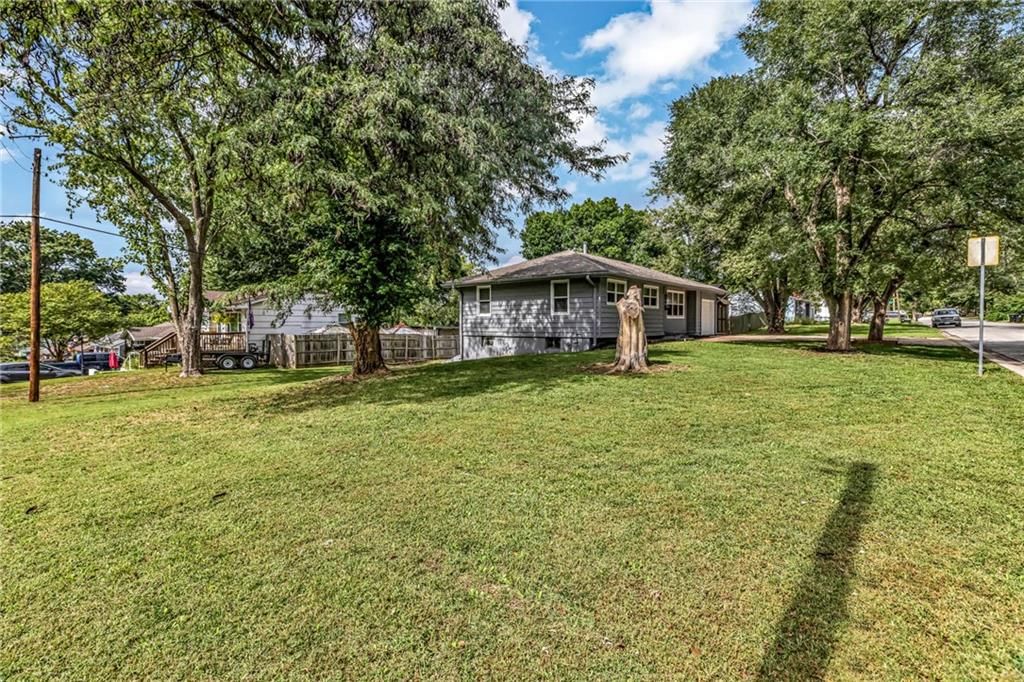
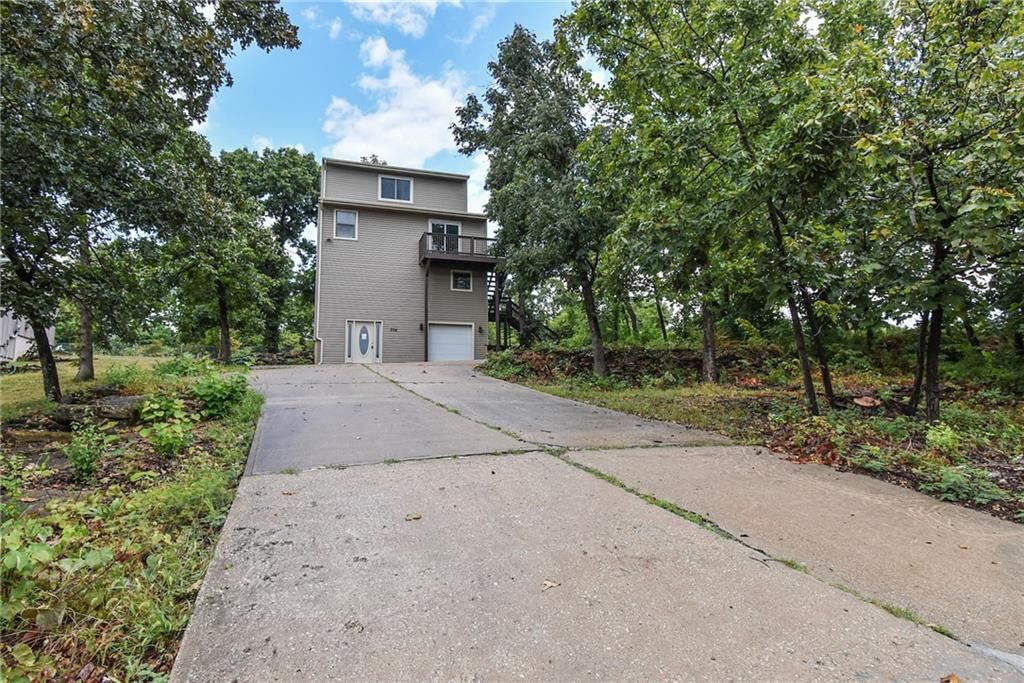
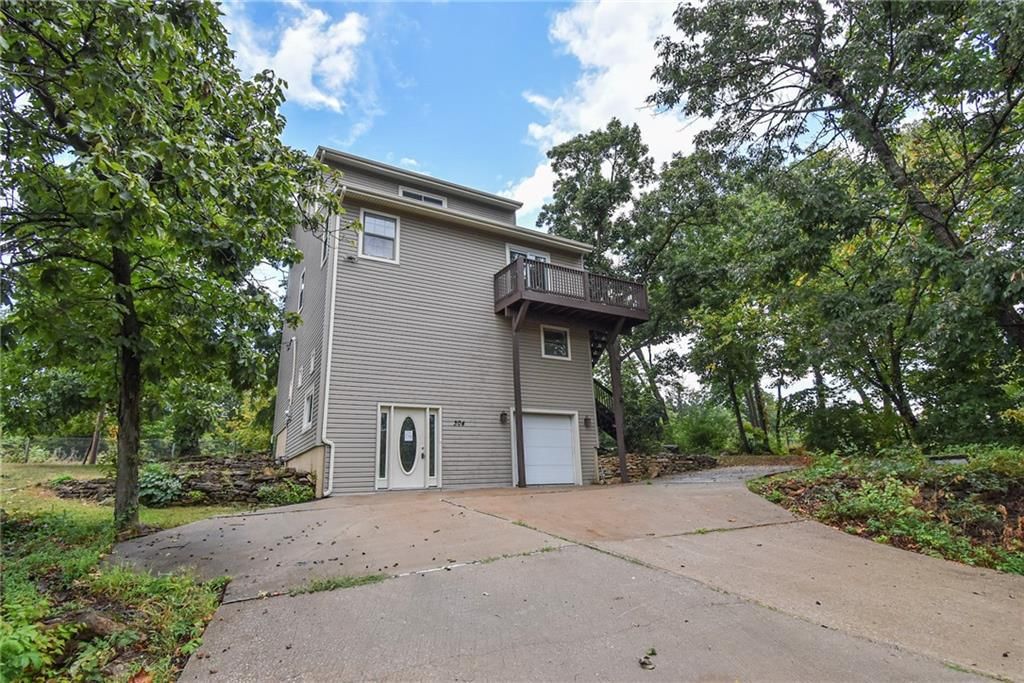
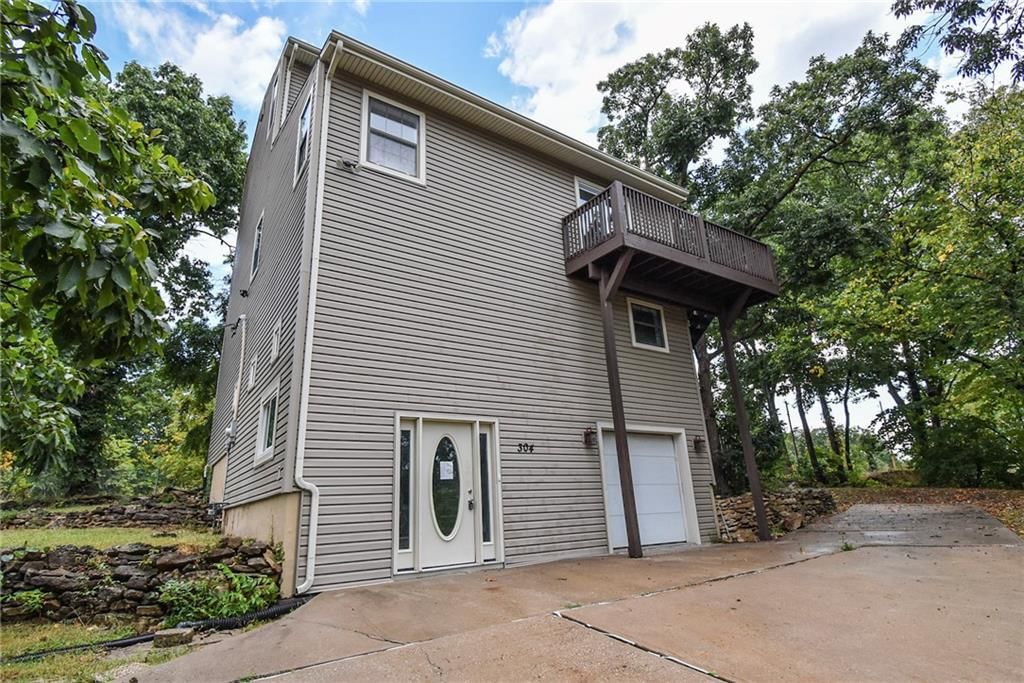
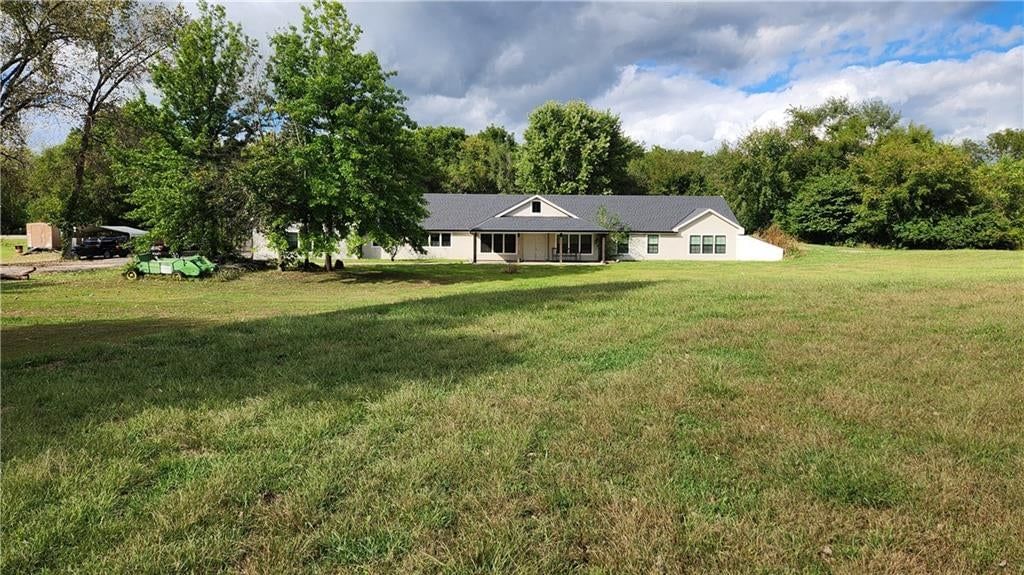
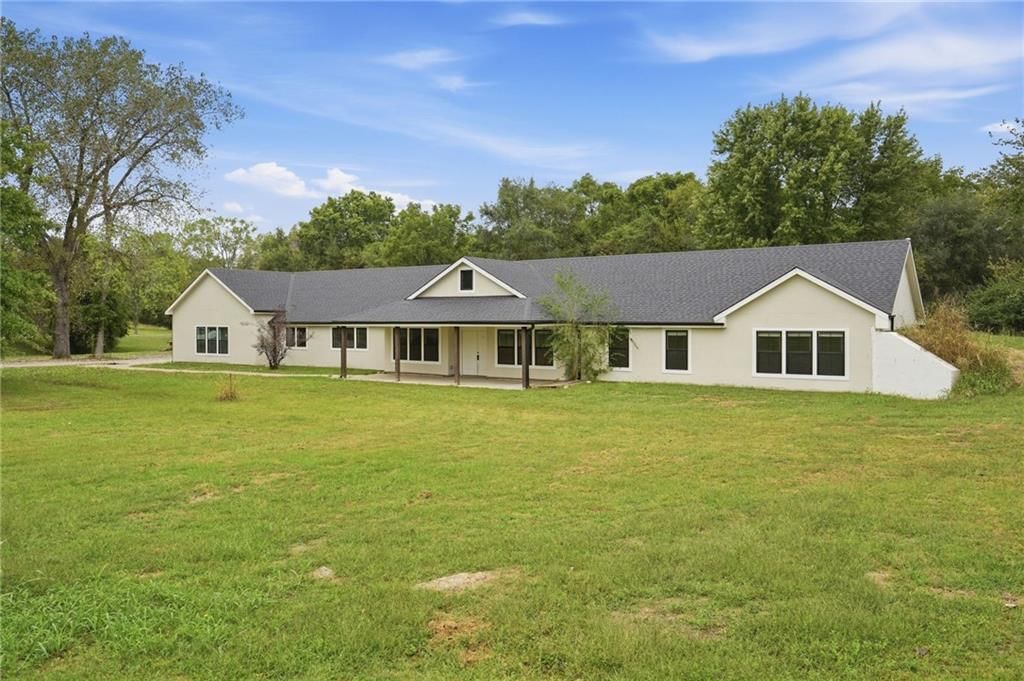
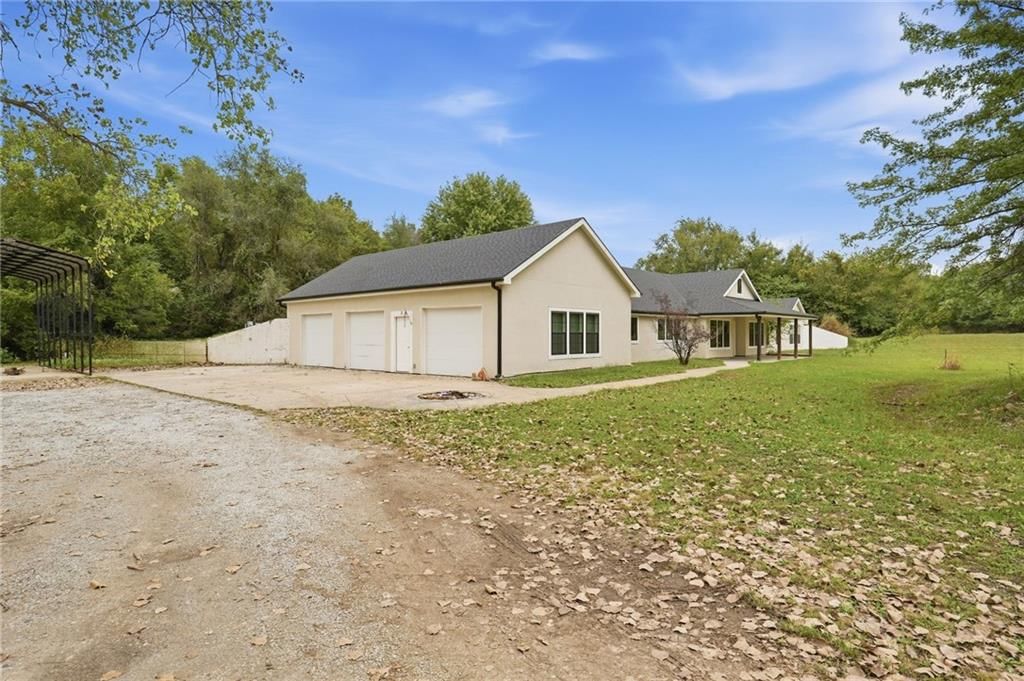
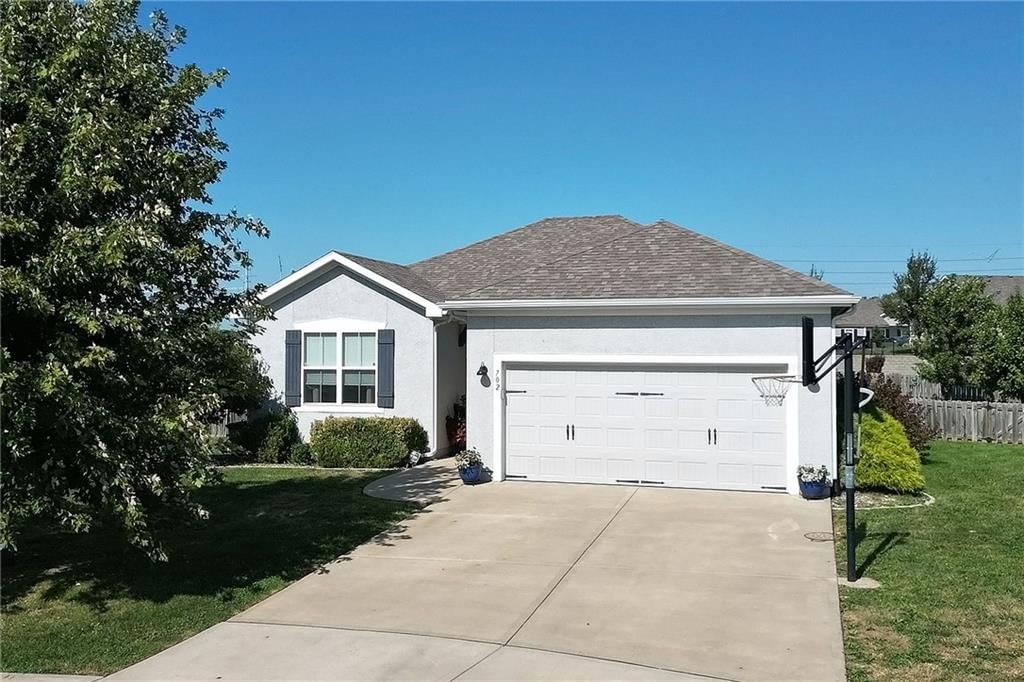
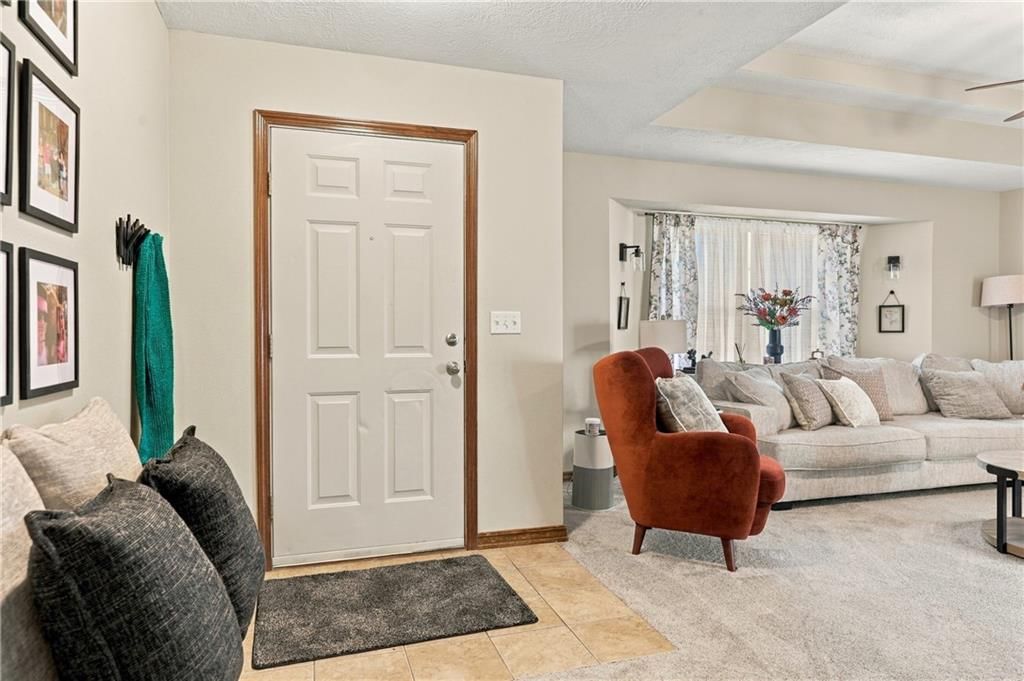
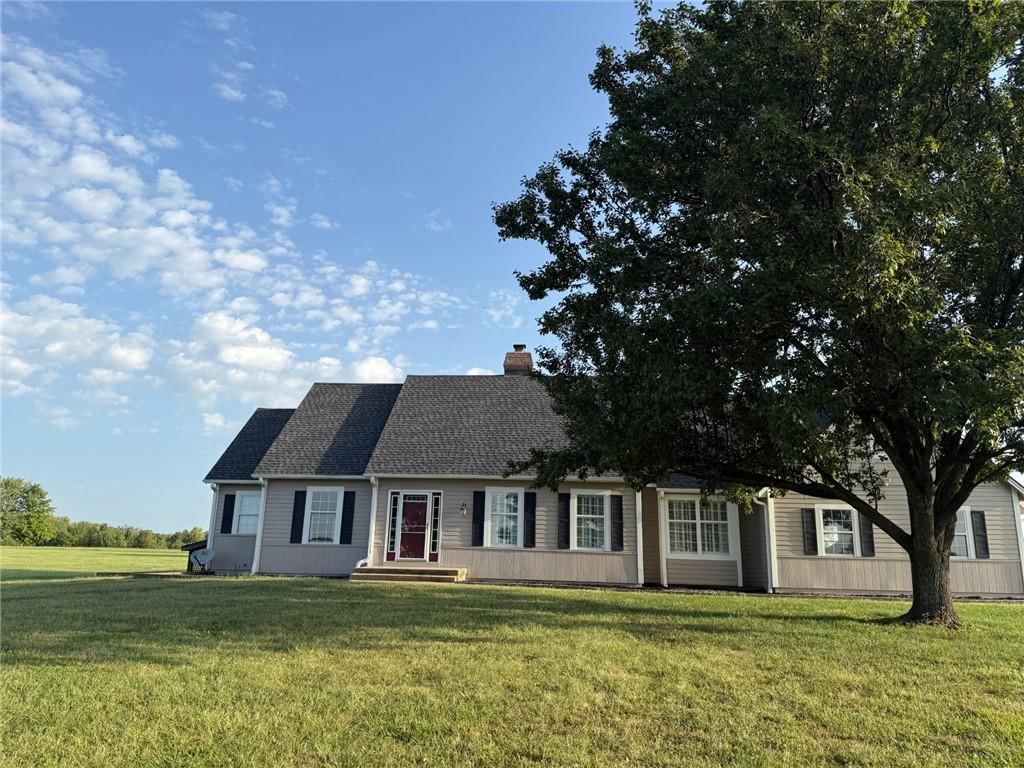
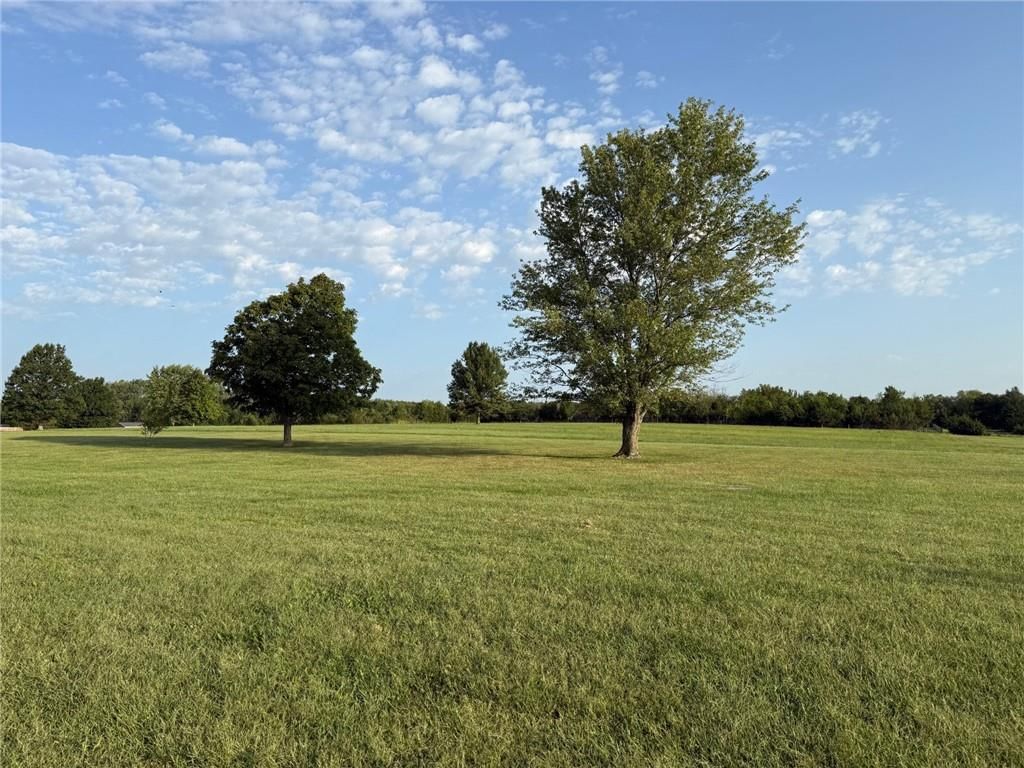
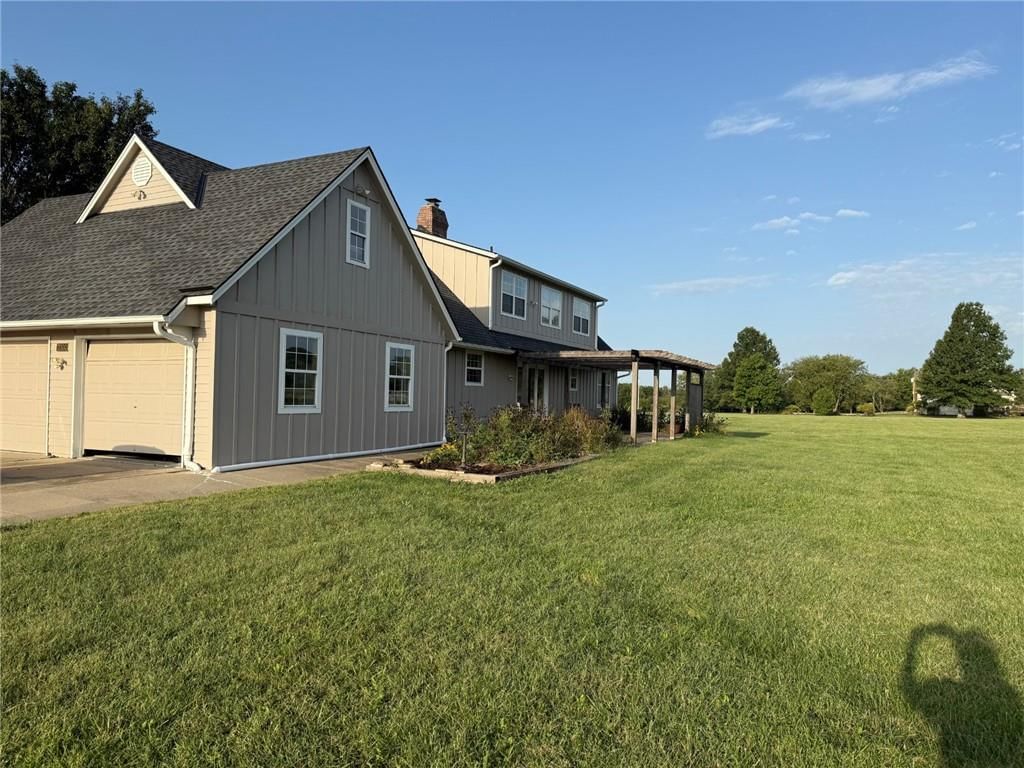
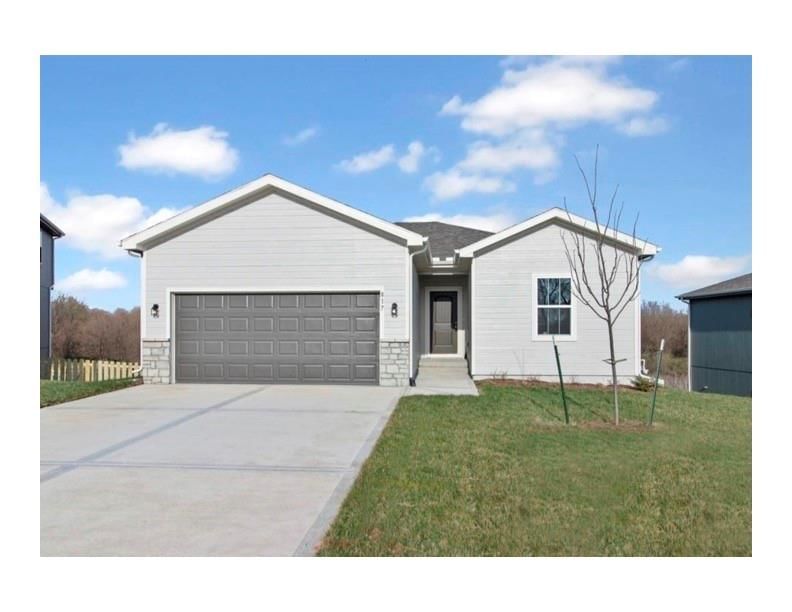
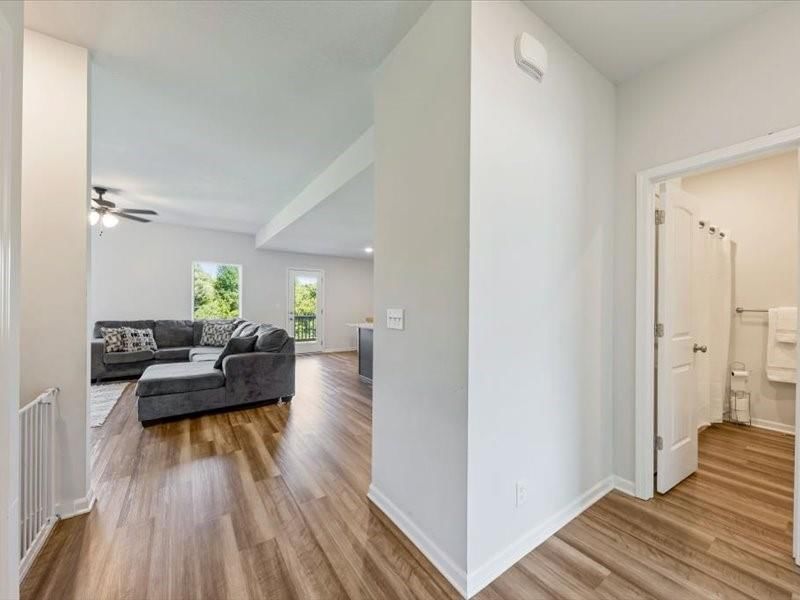
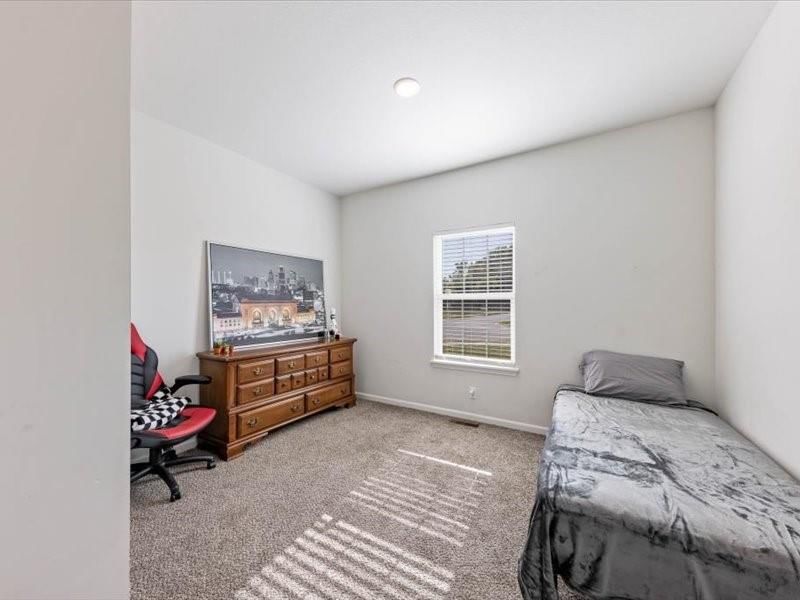
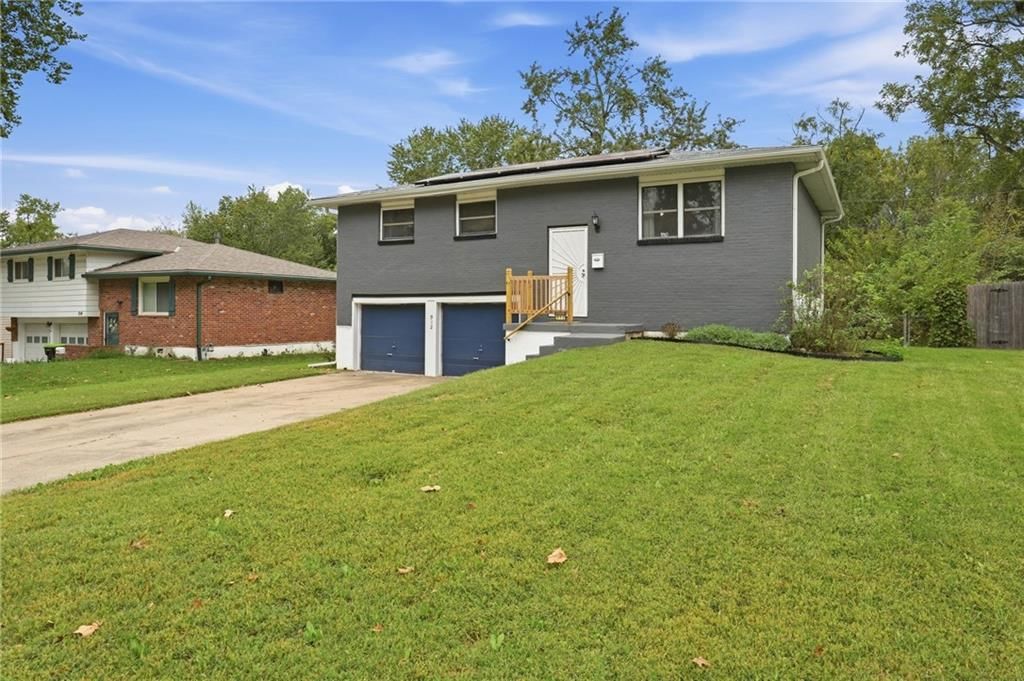
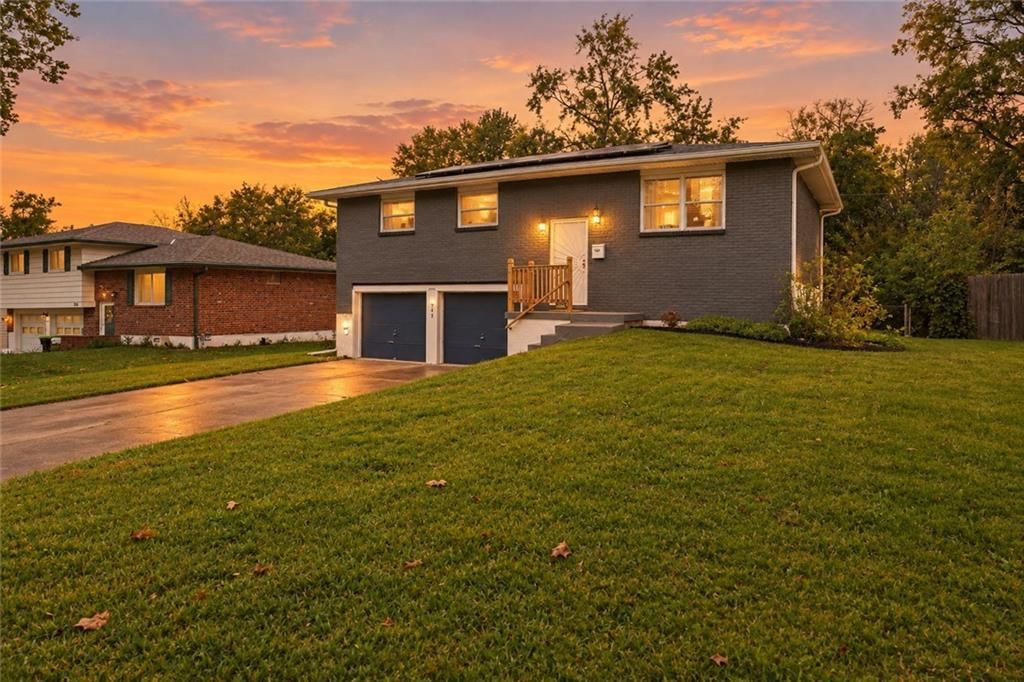
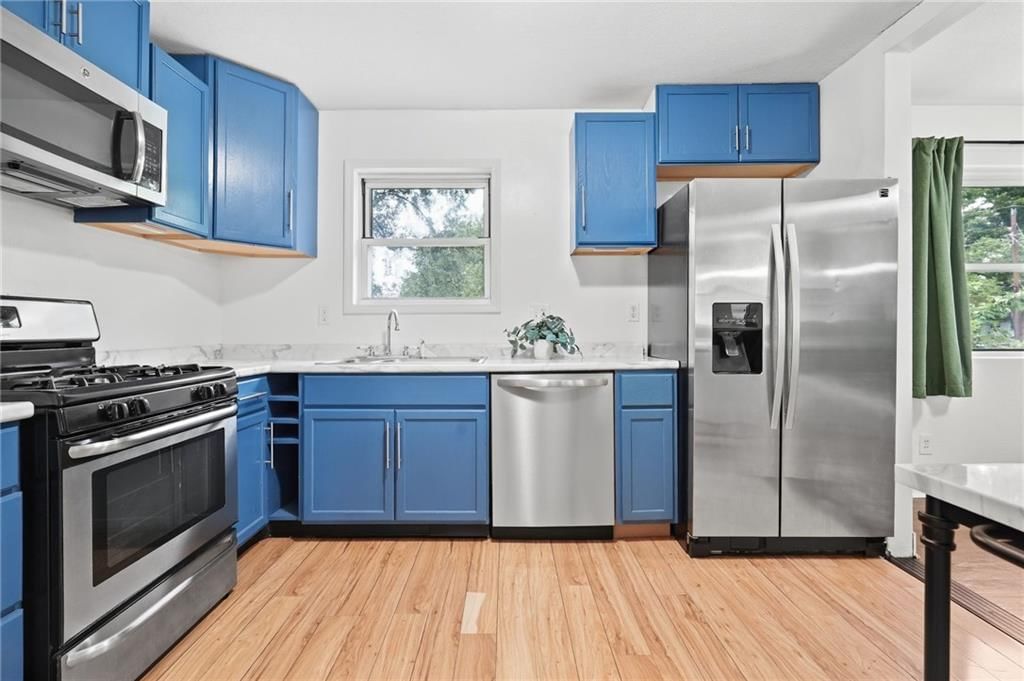
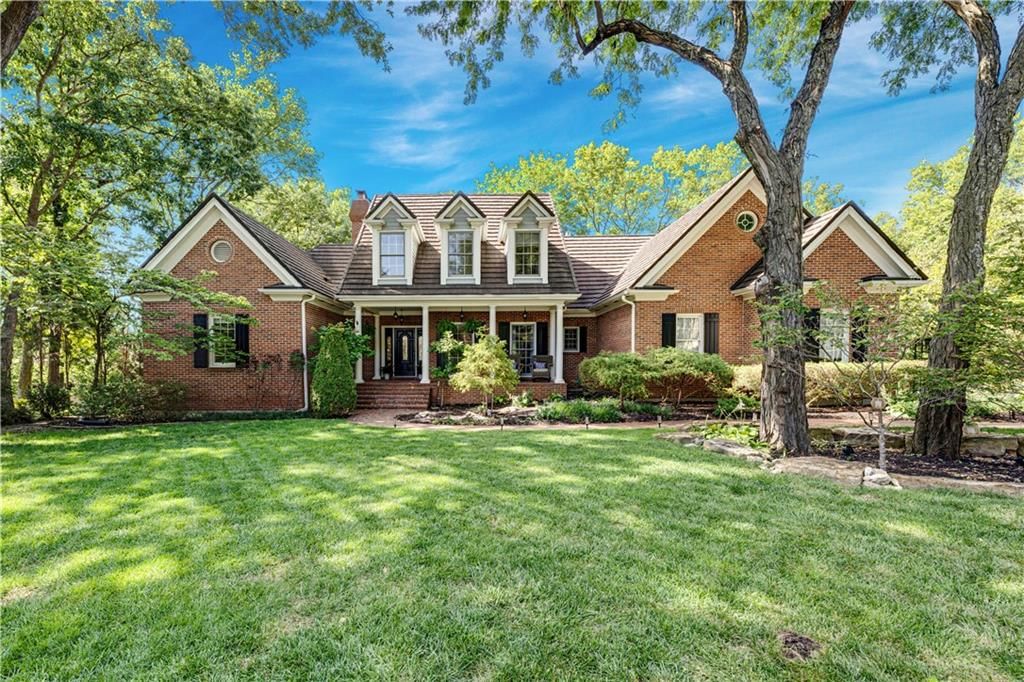
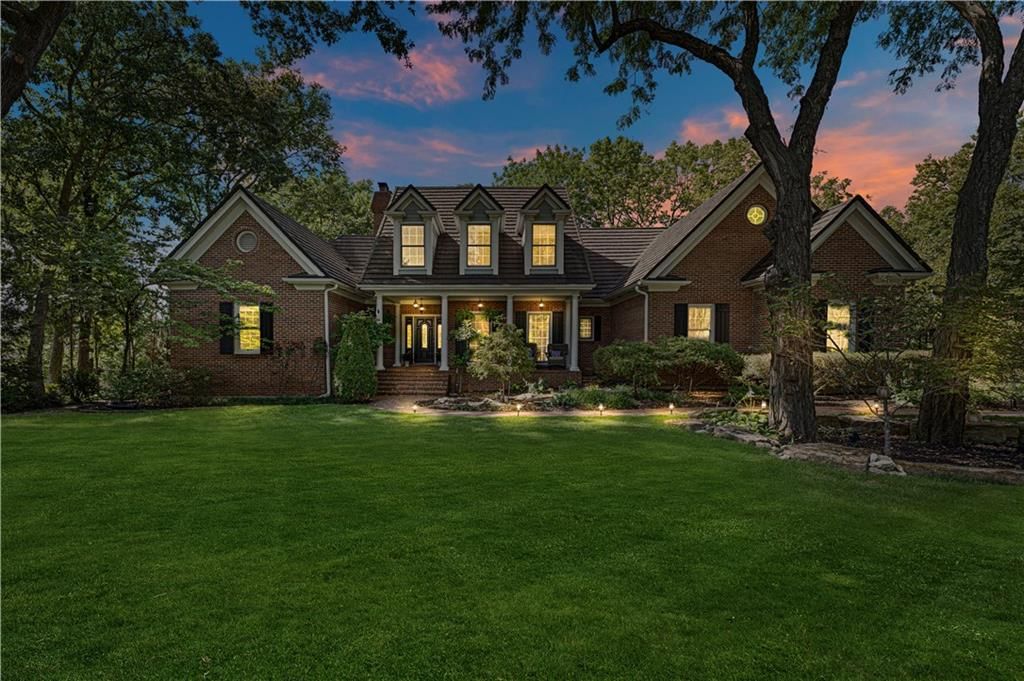
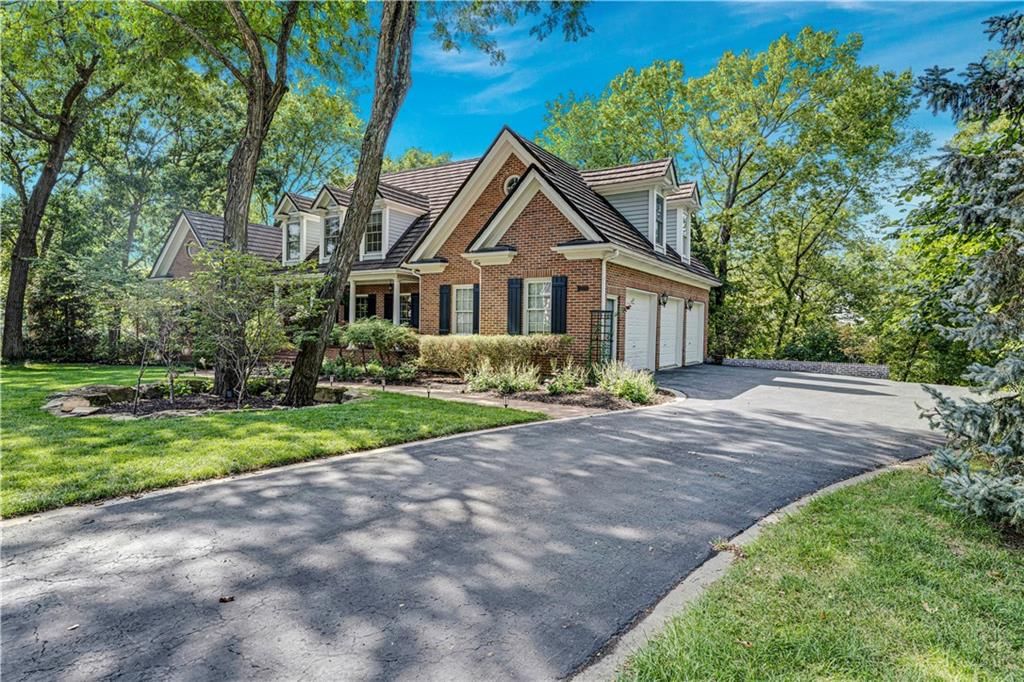
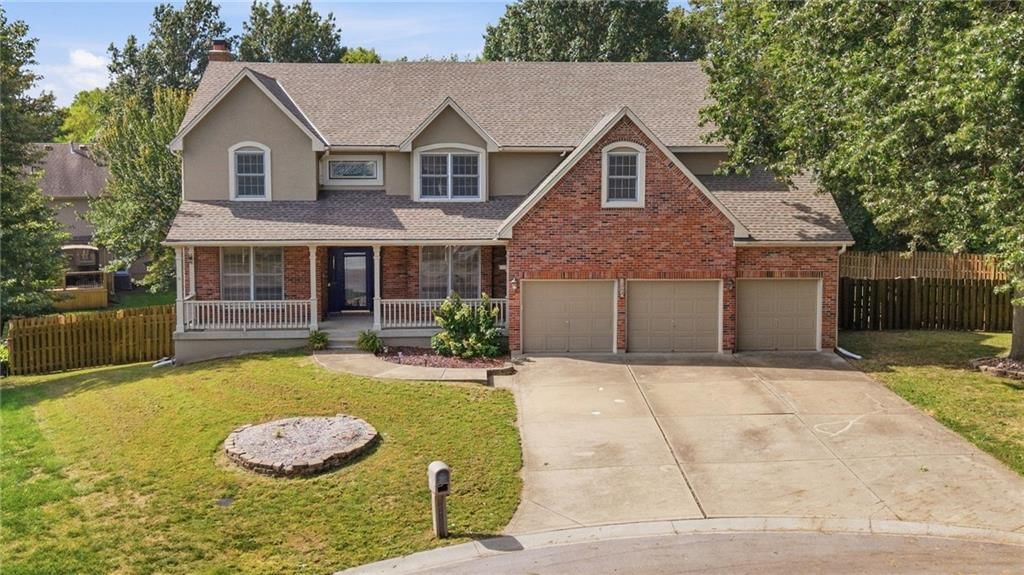
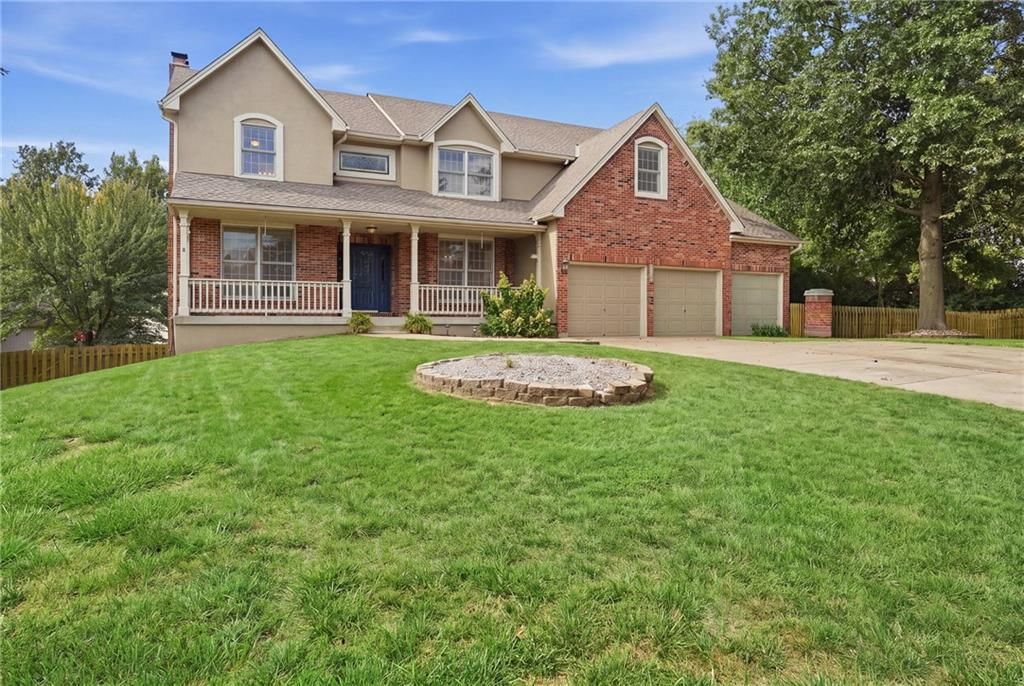
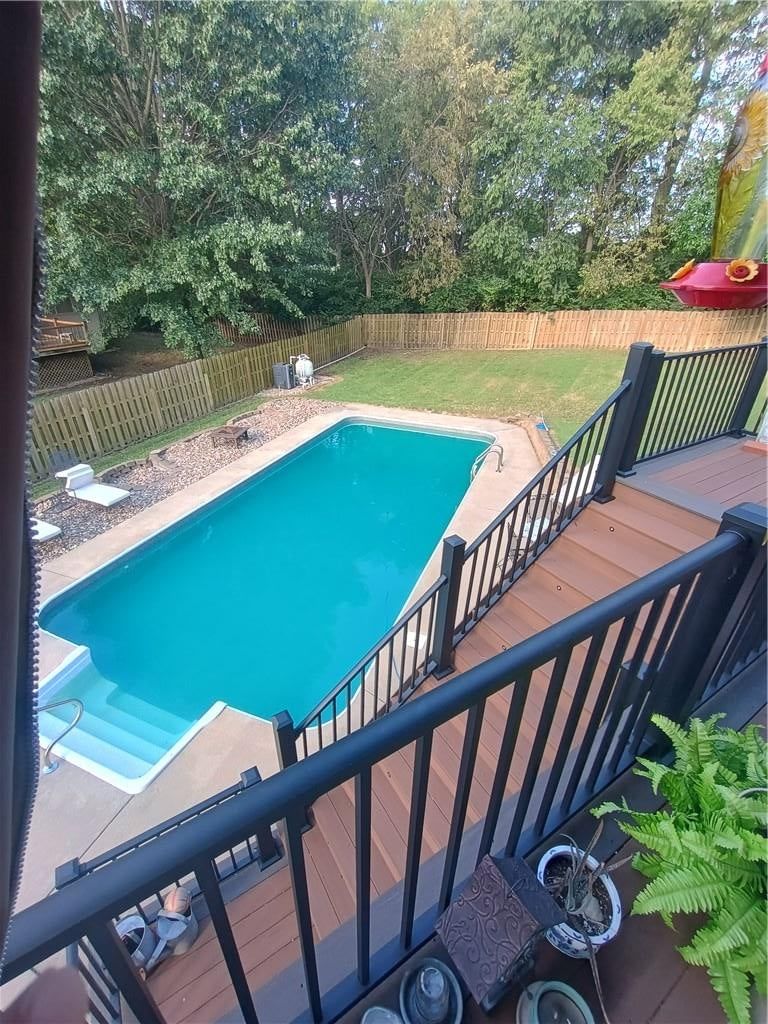
HouseLoop Vision in 64012
As of Nov 7, 2026
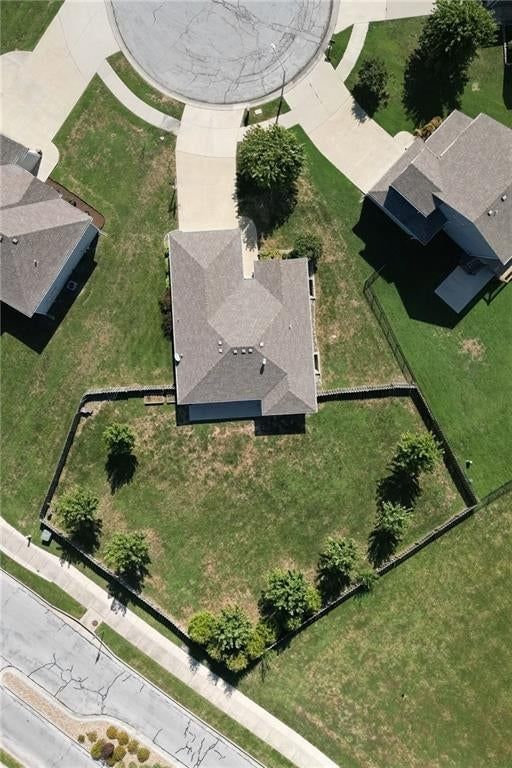
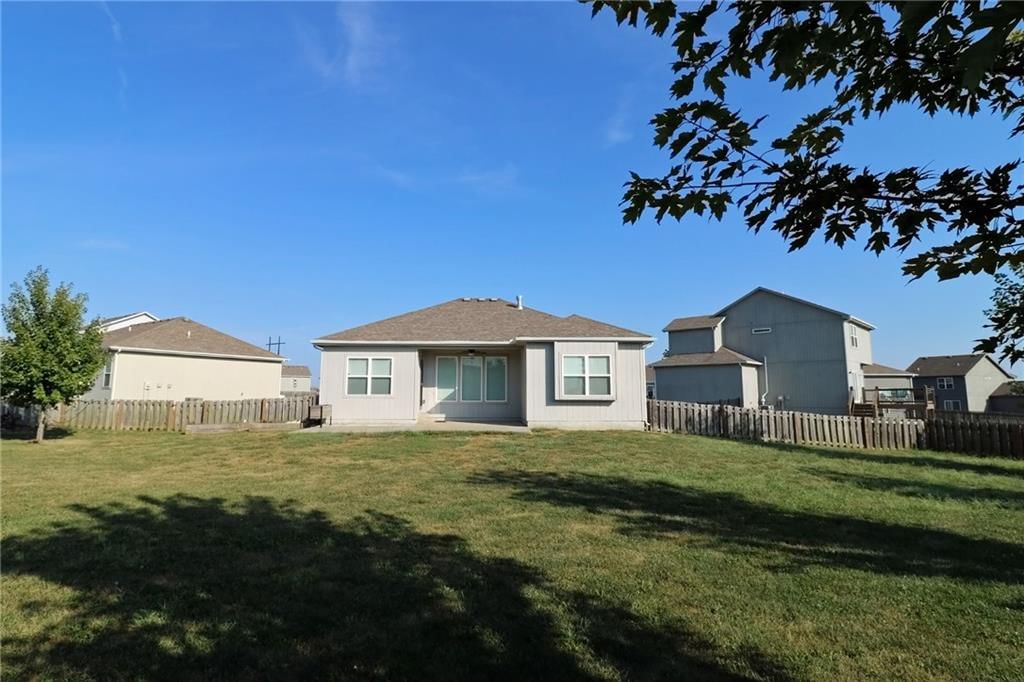
HouseLoop Vision identified 35 homes for sale in 64012 with white kitchen cabinets, 13 with a freestanding tub, 6 with a pool, 5 with a home gym, 64 with a big backyard and 32 with a finished basement, plus 4 more features.
HouseLoop Vision has looked at the photos of 86 of the 88 homes for sale in 64012. 2 haven't been looked at yet.
| HouseLoop Vision feature | Homes for sale | Where HouseLoop Vision saw it |
|---|---|---|
| White kitchen cabinets | 35 | 206-216 E South Avenue (photo 16), 1007 Brentwood Court (photo 5), 17405 MONTGALL Drive (photo 11) |
| Freestanding tub | 13 | 16900 S Stonehaven Drive (photo 30), 16755 Village Drive (photo 14) |
| Pool | 6 | 50 Hever Knoll (photo 5) |
| Home gym | 5 | 810 Logan Avenue (photo 35), 16917 Cross Creek Drive (photo 26) |
| Big backyard | 64 | 117 Nanette Street (photo 1), 528 Indian Trail (photo 26) |
| Finished basement | 32 | 8006 E 163 Terrace (photo 44), 911 McIntosh Circle (photo 27), 411 Catron Avenue (photo 24) |
| Kitchen island | 51 | 701 Fallen Leaf Drive (photo 7), 5905 E 210th Street (photo 12) |
| Two-story living room | 17 | 16413 SLATER Avenue (photo 4), 16207 Spring Valley Road (photo 6) |
| Fenced yard | 34 | 511 Corral Drive (photo 9), 130 Brentwood Drive (photo 11) |
| 3-car garage | 12 | 22701 Shadow Glen Drive (photo 35) |
Key HouseLoop Vision features
- White kitchen cabinets
- Freestanding tub
- Pool
- Home gym
- Big backyard
- Finished basement
- Kitchen island
- Two-story living room
- Fenced yard
- 3-car garage
Questions buyers ask about 64012
- How many homes for sale in 64012 have white kitchen cabinets?
- HouseLoop Vision identified 35 homes for sale in 64012 with white kitchen cabinets. One is 206-216 E South Avenue (photo 16).
- How many homes for sale in 64012 have a freestanding tub?
- HouseLoop Vision identified 13 homes for sale in 64012 with a freestanding tub. One is 16900 S Stonehaven Drive (photo 30).
- How many homes for sale in 64012 have a pool?
- HouseLoop Vision identified 6 homes for sale in 64012 with a pool. One is 50 Hever Knoll (photo 5).
- How many homes for sale in 64012 have a home gym?
- HouseLoop Vision identified 5 homes for sale in 64012 with a home gym. One is 810 Logan Avenue (photo 35).
- How many homes for sale in 64012 have a big backyard?
- HouseLoop Vision identified 64 homes for sale in 64012 with a big backyard. One is 117 Nanette Street (photo 1).
Schools serving 64012
| School | Median list | For sale |
|---|---|---|
| School districts | ||
| Belton School District | Median— | — |
| Raymore-Peculiar School District | Median— | — |
| High schools | ||
| Belton | Median— | — |
| Raymore-Peculiar | Median— | — |
| Middle schools | ||
| Belton | Median— | — |
| Yeokum | Median— | — |
| Raymore-Peculiar South | Median— | — |
| Elementary schools | ||
| Cambridge | Median— | — |
| Kentucky Trail | Median— | — |
| Gladden | Median— | — |
How we compute these
- Median list.
- The middle asking price among the homes for sale right now. Half are listed above it, half below.
- For sale.
- Homes listed as active right now. A live count, not a monthly average.
Homes by feature in 64012
| Feature | For sale |
|---|---|
| Homes with public water | For sale85 |
| Homes with a public sewer | For sale72 |
| 2+ full bathrooms | For sale65 |
| Homes with an attached garage | For sale62 |
How we compute these
- For sale.
- Homes listed as active right now. A live count, not a monthly average.
Nearby neighborhoods to Belton
| Neighborhood | Market (Market type is set by months of supply — how long it would take to sell every home for sale at the current pace. Under ~4 months favors sellers (low inventory, faster sales, homes near or above asking); over ~6 favors buyers (more choice, more negotiating room). 4–6 is balanced.) | Months supply | For sale | Median sale | Sell-to-list | Days to contract | Coming soon | Under contract |
|---|---|---|---|---|---|---|---|---|
| Traditions | Seller's | 2.4 mo | 3 | Median$340,990 | 100% | 38d | 0 | 1 |
| Autumn Ridge | Seller's | 2.5 mo | 8 | Median$383,990 | 100% | 311d | 0 | 4 |
| West Belton | Seller's ▲ | 2.7 mo | 4 | Median$215,250 | 106% | 16d | 0 | 1 |
| Cimarron Trails | Balanced | 5.5 mo | 5 | Median$180,000 | 100% | 16d | 0 | 3 |
| Pickering Place | Seller's | 2.4 mo | 2 | Median$239,500 | 100% | 23d | 1 | 0 |
How we compute these
- Market.
- Market type is set by months of supply — how long it would take to sell every home for sale at the current pace. Under ~4 months favors sellers (low inventory, faster sales, homes near or above asking); over ~6 favors buyers (more choice, more negotiating room). 4–6 is balanced.
- Months supply.
- How many months it would take to sell every home now for sale at the pace of the last 90 days: homes for sale ÷ (closings in the last 90 days ÷ 3).
- For sale.
- Homes listed as active right now. A live count, not a monthly average.
- Days to contract.
- The middle number of days between a home being listed and going under contract, over the last 90 days of closings. It is not days-to-close, and it is not how long today's listings have been sitting. Newly built homes are excluded, because a build finishing is not a market moving.
- Coming soon.
- Homes announced but not yet accepting showings. A live count.
- Under contract.
- Homes with an accepted contract that have not closed yet. A live count.
Search homes nearby 64012
| Place | Market (Market type is set by months of supply — how long it would take to sell every home for sale at the current pace. Under ~4 months favors sellers (low inventory, faster sales, homes near or above asking); over ~6 favors buyers (more choice, more negotiating room). 4–6 is balanced.) | Months supply | Median list | Sell-to-list | Days to contract | For sale | Coming soon | Under contract |
|---|---|---|---|---|---|---|---|---|
| Belton | Seller's | 2.4 mo | Median$327,400 | 100% | 23d | 70 | 1 | 45 |
| Raymore | Balanced | 4.6 mo | Median$379,900 | 96% | 27d | 195 | 7 | 92 |
| Pleasant Hill | Balanced | 4.5 mo | Median$272,400 | 97% | 24d | 86 | 4 | 15 |
| Harrisonville | Balanced | 4.6 mo | Median$330,000 | 93% | 29d | 82 | 0 | 15 |
| Peculiar | Balanced | 4.8 mo | Median$369,990 | 95% | 32d | 79 | 2 | 28 |
How we compute these
- Market.
- Market type is set by months of supply — how long it would take to sell every home for sale at the current pace. Under ~4 months favors sellers (low inventory, faster sales, homes near or above asking); over ~6 favors buyers (more choice, more negotiating room). 4–6 is balanced.
- Months supply.
- How many months it would take to sell every home now for sale at the pace of the last 90 days: homes for sale ÷ (closings in the last 90 days ÷ 3).
- Median list.
- The middle asking price among the homes for sale right now. Half are listed above it, half below.
- Days to contract.
- The middle number of days between a home being listed and going under contract, over the last 90 days of closings. It is not days-to-close, and it is not how long today's listings have been sitting. Newly built homes are excluded, because a build finishing is not a market moving.
- For sale.
- Homes listed as active right now. A live count, not a monthly average.
- Coming soon.
- Homes announced but not yet accepting showings. A live count.
- Under contract.
- Homes with an accepted contract that have not closed yet. A live count.
Nearby ZIP codes
| Place | Market (Market type is set by months of supply — how long it would take to sell every home for sale at the current pace. Under ~4 months favors sellers (low inventory, faster sales, homes near or above asking); over ~6 favors buyers (more choice, more negotiating room). 4–6 is balanced.) | Months supply | Median list | Sell-to-list | Days to contract | For sale | Coming soon | Under contract |
|---|---|---|---|---|---|---|---|---|
| 64102 | Strong Buyer's | 24 mo | Median— | 100% | — | 2 | 0 | 1 |
How we compute these
- Market.
- Market type is set by months of supply — how long it would take to sell every home for sale at the current pace. Under ~4 months favors sellers (low inventory, faster sales, homes near or above asking); over ~6 favors buyers (more choice, more negotiating room). 4–6 is balanced.
- Months supply.
- How many months it would take to sell every home now for sale at the pace of the last 90 days: homes for sale ÷ (closings in the last 90 days ÷ 3).
- Median list.
- The middle asking price among the homes for sale right now. Half are listed above it, half below.
- Days to contract.
- The middle number of days between a home being listed and going under contract, over the last 90 days of closings. It is not days-to-close, and it is not how long today's listings have been sitting. Newly built homes are excluded, because a build finishing is not a market moving.
- For sale.
- Homes listed as active right now. A live count, not a monthly average.
- Coming soon.
- Homes announced but not yet accepting showings. A live count.
- Under contract.
- Homes with an accepted contract that have not closed yet. A live count.