
Homes Under $600K for Sale in Archie, MO
13 homes fit this search · Sorted by Newest Listed


305 S Wilson Street, Archie, MO
New · 7d ago
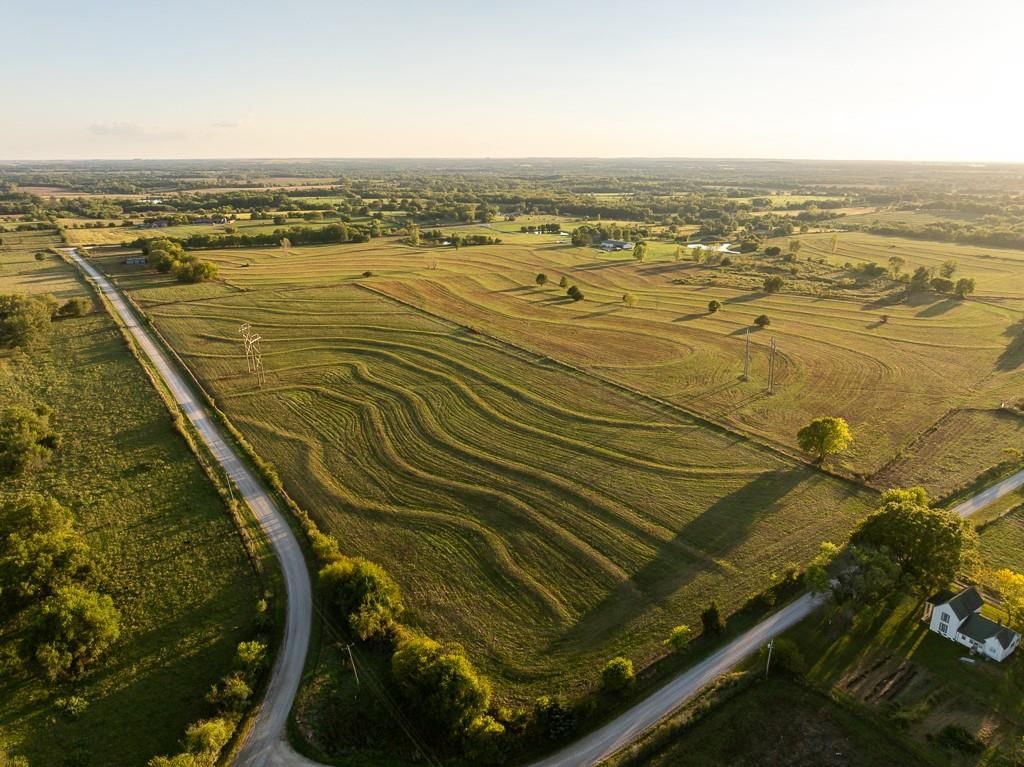
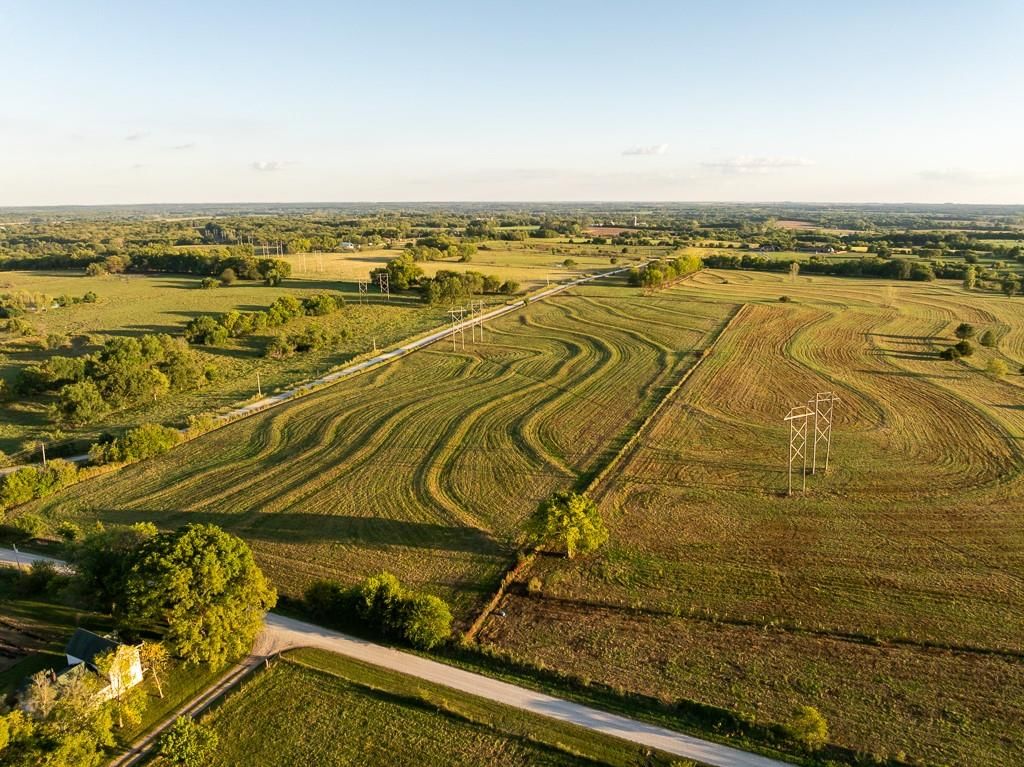
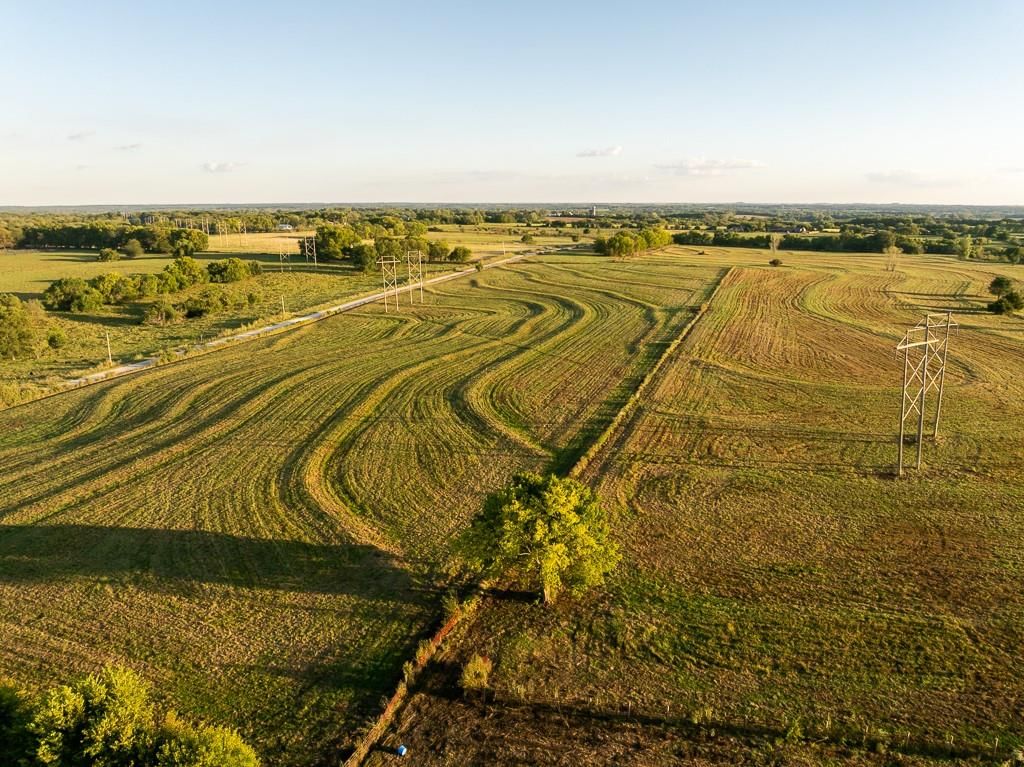
Tract 4 S Rush Road, Archie, MO


TBD West Grace Road, Archie, MO


11504 E 301st Street, Archie, MO


404 S Texas Street, Archie, MO


202 W Redwood Street, Archie, MO
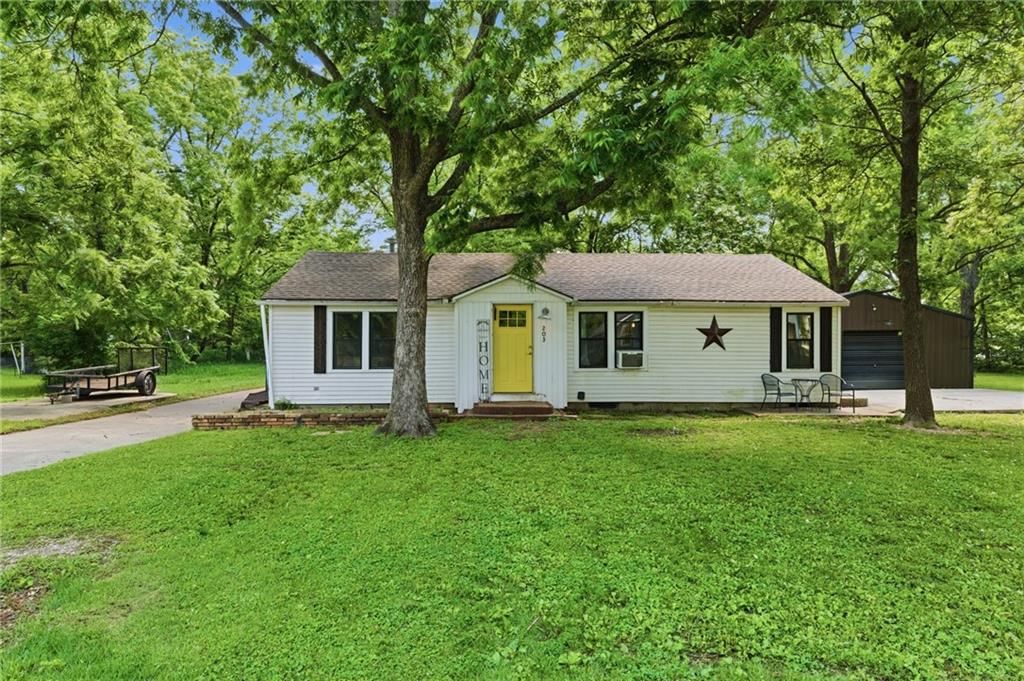


203 S Ohio Street, Archie, MO

504 S West Outer Road, Archie, MO


401 W Chestnut Street, Archie, MO


406 S Jackson Street, Archie, MO


1 Hi View Ridge Drive, Archie, MO


101 N Main Street, Archie, MO


300 E Maple Street, Archie, MO
About Homes Under $600K inArchie, MO
Archie, MO has 13 homes under $600k for sale right now, with a median list price of $264,000 as of Sep 10 These homes under $600k were built between 1900 and 2026, ranging from 1,074 to 3,203 square feet.
Homes Under $600K market trendsArchie, MO
Archie, MO: 14 homes for sale · 2 new in the last 7 days · median asking $244,500 · 7 price reductions · a median of 57 days to contract. 3 homes closed in the last 30 days, at a median of $278,000. At the pace of the last 90 days that is 3 months of supply.
| Measure | Aug 2026 |
|---|---|
| Homes sold | 2 |
| New listings | 3 |
| Went under contract | 1 |
Homes Under $600K FAQsArchie, MO
How many homes under $600k are for sale in Archie, MO?
What is the median list price of homes under $600k in Archie, MO?
Schoolsserving Archie
| School | Median list | |
|---|---|---|
| School districts | ||
| Archie School District | Median— | |
| High schools | ||
| Archie | Median— | |
| Middle schools | ||
| Archie | Median— | |
| Elementary schools | ||
| Archie | Median— | |
How we compute these
- Median list.
- The middle asking price among the homes for sale right now. Half are listed above it, half below.
- For sale.
- Homes listed as active right now. A live count, not a monthly average.
Newly listedin Archie, MO
| Address | Price |
|---|---|
| 305 S Wilson Street | Price$428,000 |
Recently went under contractin Archie, MO
| Address | List price |
|---|---|
| 402 S Delaware Street | List price$215,000 |
| 306 W Walnut Street | List price$139,000 |
| 0000 E Tract 1, 331st Street | List price$370,000 |
| 410 S Main Street | List price$149,900 |
How we compute these
- Under contract.
- Homes with an accepted contract that have not closed yet. A live count.
- Days to contract.
- The middle number of days between a home being listed and going under contract, over the last 90 days of closings. It is not days-to-close, and it is not how long today's listings have been sitting. Newly built homes are excluded, because a build finishing is not a market moving.
Popular home searchesin Archie
| Search | For sale |
|---|---|
| Just listed homes | For sale1 |
| Price-reduced homes | 6 |
| Homes under contract | For sale3 |
How we compute these
- For sale.
- Homes listed as active right now. A live count, not a monthly average.
Homes by pricein Archie
| Price range | For sale |
|---|---|
| Under $200,000 | For sale4 |
| Under $300,000 | For sale8 |
| Under $400,000 | 10 |
| Under $500,000 | 13 |
| Under $600,000 | 13 |
| Under $750,000 | 13 |
| Under $1,000,000 | 13 |
| $300,000 – $400,000 | For sale3 |
| $400,000 – $500,000 | For sale3 |
How we compute these
- For sale.
- Homes listed as active right now. A live count, not a monthly average.
Homes by featurein Archie
| Feature | For sale |
|---|---|
| No HOA | For sale13 |
| Homes with no HOA | For sale13 |
| Homes with a public sewer | For sale9 |
| Two or more stories | For sale7 |
| 2+ full bathrooms | For sale7 |
| Homes with 2+ full bathrooms | For sale7 |
| 1/4 to 1/2 acre | For sale6 |
| Single story | For sale6 |
| 2+ car garage | For sale6 |
| Homes with ceiling fans | For sale6 |
| Homes with public water | For sale6 |
| Main-floor primary homes | 6 |
How we compute these
- For sale.
- Homes listed as active right now. A live count, not a monthly average.
Search by property typein Archie
| Property type | Median sale |
|---|---|
| Single Family | Median— |
| Lots / Land | Median— |
How we compute these
- Market.
- Market type is set by months of supply — how long it would take to sell every home for sale at the current pace. Under ~4 months favors sellers (low inventory, faster sales, homes near or above asking); over ~6 favors buyers (more choice, more negotiating room). 4–6 is balanced.
- Months supply.
- How many months it would take to sell every home now for sale at the pace of the last 90 days: homes for sale ÷ (closings in the last 90 days ÷ 3).
- For sale.
- Homes listed as active right now. A live count, not a monthly average.
- Days to contract.
- The middle number of days between a home being listed and going under contract, over the last 90 days of closings. It is not days-to-close, and it is not how long today's listings have been sitting. Newly built homes are excluded, because a build finishing is not a market moving.
- Coming soon.
- Homes announced but not yet accepting showings. A live count.
- Under contract.
- Homes with an accepted contract that have not closed yet. A live count.
Nearby neighborhoodsto Archie
| Neighborhood | Median sale |
|---|---|
| Meadowbrook Acres | $392,500 |
| Gebhardt Add | $252,000 |
| High School Add | $120,500 |
| Country Aire Estates | $257,500 |
| Austin | $150,000 |
| Hi View Ridge | $254,000 |
How we compute these
- Market.
- Market type is set by months of supply — how long it would take to sell every home for sale at the current pace. Under ~4 months favors sellers (low inventory, faster sales, homes near or above asking); over ~6 favors buyers (more choice, more negotiating room). 4–6 is balanced.
- Months supply.
- How many months it would take to sell every home now for sale at the pace of the last 90 days: homes for sale ÷ (closings in the last 90 days ÷ 3).
- For sale.
- Homes listed as active right now. A live count, not a monthly average.
- Days to contract.
- The middle number of days between a home being listed and going under contract, over the last 90 days of closings. It is not days-to-close, and it is not how long today's listings have been sitting. Newly built homes are excluded, because a build finishing is not a market moving.
- Coming soon.
- Homes announced but not yet accepting showings. A live count.
- Under contract.
- Homes with an accepted contract that have not closed yet. A live count.
Search homesnearby Archie
| Place | Median list |
|---|---|
| Archie | $264,000 |
| Raymore | $393,995 |
| Belton | $327,500 |
| Pleasant Hill | $284,500 |
| Harrisonville | $286,000 |
| Peculiar | $360,000 |
How we compute these
- Market.
- Market type is set by months of supply — how long it would take to sell every home for sale at the current pace. Under ~4 months favors sellers (low inventory, faster sales, homes near or above asking); over ~6 favors buyers (more choice, more negotiating room). 4–6 is balanced.
- Months supply.
- How many months it would take to sell every home now for sale at the pace of the last 90 days: homes for sale ÷ (closings in the last 90 days ÷ 3).
- Median list.
- The middle asking price among the homes for sale right now. Half are listed above it, half below.
- Days to contract.
- The middle number of days between a home being listed and going under contract, over the last 90 days of closings. It is not days-to-close, and it is not how long today's listings have been sitting. Newly built homes are excluded, because a build finishing is not a market moving.
- For sale.
- Homes listed as active right now. A live count, not a monthly average.
- Coming soon.
- Homes announced but not yet accepting showings. A live count.
- Under contract.
- Homes with an accepted contract that have not closed yet. A live count.
NearbyZIP codes
| Place | Median list |
|---|---|
| 64725 | $282,000 |
How we compute these
- Market.
- Market type is set by months of supply — how long it would take to sell every home for sale at the current pace. Under ~4 months favors sellers (low inventory, faster sales, homes near or above asking); over ~6 favors buyers (more choice, more negotiating room). 4–6 is balanced.
- Months supply.
- How many months it would take to sell every home now for sale at the pace of the last 90 days: homes for sale ÷ (closings in the last 90 days ÷ 3).
- Median list.
- The middle asking price among the homes for sale right now. Half are listed above it, half below.
- Days to contract.
- The middle number of days between a home being listed and going under contract, over the last 90 days of closings. It is not days-to-close, and it is not how long today's listings have been sitting. Newly built homes are excluded, because a build finishing is not a market moving.
- For sale.
- Homes listed as active right now. A live count, not a monthly average.
- Coming soon.
- Homes announced but not yet accepting showings. A live count.
- Under contract.
- Homes with an accepted contract that have not closed yet. A live count.
Search homes for salein every city we cover
How we compute these
- Market.
- Market type is set by months of supply — how long it would take to sell every home for sale at the current pace. Under ~4 months favors sellers (low inventory, faster sales, homes near or above asking); over ~6 favors buyers (more choice, more negotiating room). 4–6 is balanced.
- Months supply.
- How many months it would take to sell every home now for sale at the pace of the last 90 days: homes for sale ÷ (closings in the last 90 days ÷ 3).
- Median list.
- The middle asking price among the homes for sale right now. Half are listed above it, half below.
- Days to contract.
- The middle number of days between a home being listed and going under contract, over the last 90 days of closings. It is not days-to-close, and it is not how long today's listings have been sitting. Newly built homes are excluded, because a build finishing is not a market moving.
- For sale.
- Homes listed as active right now. A live count, not a monthly average.
- Coming soon.
- Homes announced but not yet accepting showings. A live count.
- Under contract.
- Homes with an accepted contract that have not closed yet. A live count.
Search for homesin popular markets
| Market | For sale |
|---|---|
| Heritage Ranch | 28 |
| Canyon Lakes | 25 |
| Ruskin Heights | 24 |
| Seven Bridges | 24 |
| Garrett Ranch | 24 |
| Tomahawk Valley | 23 |
How we compute these
- Market.
- Market type is set by months of supply — how long it would take to sell every home for sale at the current pace. Under ~4 months favors sellers (low inventory, faster sales, homes near or above asking); over ~6 favors buyers (more choice, more negotiating room). 4–6 is balanced.
- For sale.
- Homes listed as active right now. A live count, not a monthly average.
Or go wider stillcounty, metro and state
How we compute these
- Market.
- Market type is set by months of supply — how long it would take to sell every home for sale at the current pace. Under ~4 months favors sellers (low inventory, faster sales, homes near or above asking); over ~6 favors buyers (more choice, more negotiating room). 4–6 is balanced.
- Months supply.
- How many months it would take to sell every home now for sale at the pace of the last 90 days: homes for sale ÷ (closings in the last 90 days ÷ 3).
- Median list.
- The middle asking price among the homes for sale right now. Half are listed above it, half below.
- Days to contract.
- The middle number of days between a home being listed and going under contract, over the last 90 days of closings. It is not days-to-close, and it is not how long today's listings have been sitting. Newly built homes are excluded, because a build finishing is not a market moving.
- For sale.
- Homes listed as active right now. A live count, not a monthly average.
- Coming soon.
- Homes announced but not yet accepting showings. A live count.
- Under contract.
- Homes with an accepted contract that have not closed yet. A live count.