
Kansas City 66106 Single-Story Homes for Sale
24 homes for sale in 66106 · Sorted by Newest Listed

4841 Gibbs Road, Kansas City, KS
New · 6d ago


2641 S 51st Terrace, Kansas City, KS
New · 6d ago


5201 Forest Avenue, Kansas City, KS


2721 S 53rd Street, Kansas City, KS


1118 S 36th Street, Kansas City, KS


1537 S 49th Street, Kansas City, KS


4415 August Lane, Kansas City, KS

1605 S 29 Street, Kansas City, KS

1605 S 29 Street, Kansas City, KS


7145 Gibbs Road, Kansas City, KS


4770 Woodend Avenue, Kansas City, KS


4941 Shawnee Drive, Kansas City, KS


2409 Linden Drive, Kansas City, KS


1424 S 37th Street, Kansas City, KS


3701 Gibbs Road, Kansas City, KS


1432 S 38th Street, Kansas City, KS


1017 S 51ST Street, Kansas City, KS


2008 Key Lane, Kansas City, KS


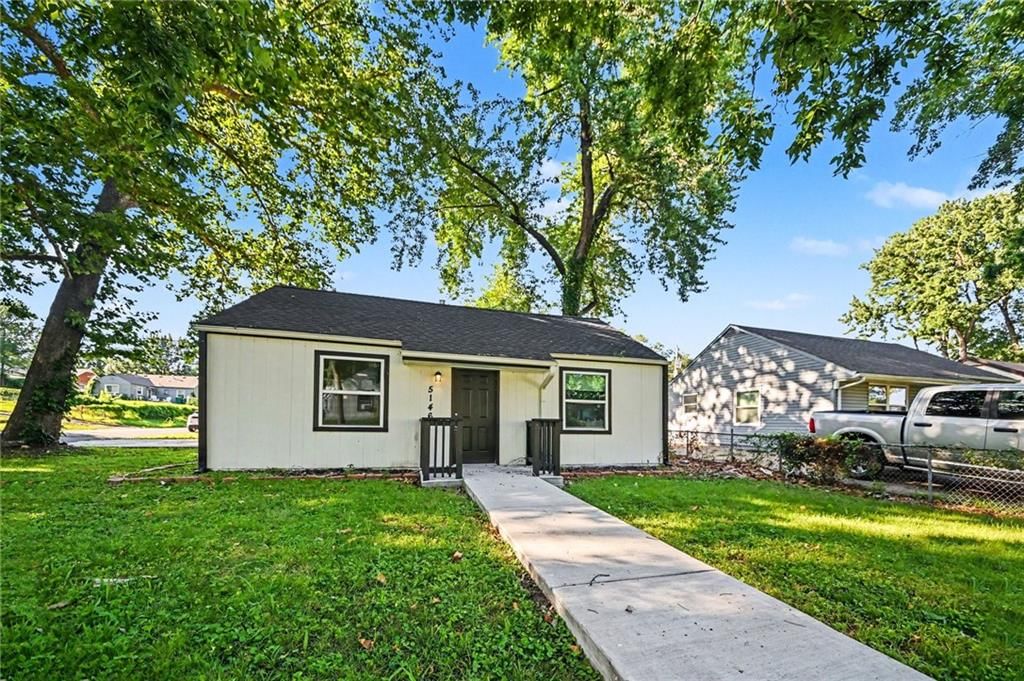
5146 Forest Avenue, Kansas City, KS


5137 HAGEMANN Street, Kansas City, KS


2901 S 26th Street, Kansas City, KS


1108 S 39th Street, Kansas City, KS


2815 S 24 Street, Kansas City, KS


5610 Miami Avenue, Kansas City, KS
About Single-Story Homes in Kansas City 66106
Kansas City 66106 has 24 single-story homes for sale right now, with a median list price of $230,000 as of Sep 30 These single-story homes were built between 1900 and 1960, ranging from 690 to 2,190 square feet.
Single-Story Homes market trends Kansas City 66106
Kansas City 66106: 37 homes for sale · 1 new in the last 7 days · median asking $204,950 · 21 price reductions · a median of 12 days to contract. 17 homes closed in the last 30 days, at a median of $230,125. At the pace of the last 90 days that is 1.76 months of supply.
Single-Story Homes FAQs Kansas City 66106
How many single-story homes are for sale in Kansas City 66106?
What is the median list price of single-story homes in Kansas City 66106?
Schools serving 66106
| School | Median list | |
|---|---|---|
| School districts | ||
| Turner School District | Median— | |
| Kansas City KS School District | Median— | |
| High schools | ||
| Turner | Median— | |
| Harmon | Median— | |
| Middle schools | ||
| Turner | Median— | |
| Argentine | Median— | |
| Elementary schools | ||
| Oak Grove | Median— | |
| Turner | Median— | |
How we compute these
- Median list.
- The middle asking price among the homes for sale right now. Half are listed above it, half below.
- For sale.
- Homes listed as active right now. A live count, not a monthly average.
Newly listed in 66106
| Address | Price |
|---|---|
| 2641 S 51st Terrace | Price$204,950 |
Recently went under contract in 66106
| Address | List price |
|---|---|
| 2800 S 24th Street | List price$285,000 |
| 4008 Strong Avenue | List price$119,000 |
| 1500 Woodland Boulevard | List price$99,900 |
| 1202 E Ridgeway Drive | List price$350,000 |
| 2625 Vista Street | List price$209,000 |
| 3833 Ruby Avenue | List price$80,000 |
| 5215 Douglas Avenue | List price$295,000 |
| 3306 Hagemann Street | List price$259,000 |
| 3108 S 47th Street | List price$230,999 |
| 6412 County Line Road | List price$304,950 |
| 1719 S 23rd Street | List price$285,000 |
| 5724 Miami Avenue | List price$295,000 |
How we compute these
- Under contract.
- Homes with an accepted contract that have not closed yet. A live count.
- Days to contract.
- The middle number of days between a home being listed and going under contract, over the last 90 days of closings. It is not days-to-close, and it is not how long today's listings have been sitting. Newly built homes are excluded, because a build finishing is not a market moving.
Homes by feature in 66106
| Feature | For sale |
|---|---|
| No HOA | 42 |
| Homes with public water | For sale37 |
| Homes with a public sewer | For sale30 |
| Built before 1960 | 27 |
| Under 1,500 sq ft | 26 |
| Single story | 24 |
| Under 1/4 acre | 22 |
| Two or more stories | For sale18 |
| Homes with an attached garage | For sale16 |
| 3 bedrooms | 15 |
| 2+ full bathrooms | 15 |
| 2+ car garage | 15 |
How we compute these
- For sale.
- Homes listed as active right now. A live count, not a monthly average.
Nearby neighborhoods to Kansas City
| Neighborhood | Median sale |
|---|---|
| Highland Crest | $199,500 |
| Wyandotte City | $271,250 |
| Oakgrove Park | $285,000 |
| Western Highlands | $136,000 |
| Delaware Ridge | $239,000 |
| Hunters Glen No 2 | $232,500 |
How we compute these
- Market.
- Market type is set by months of supply — how long it would take to sell every home for sale at the current pace. Under ~4 months favors sellers (low inventory, faster sales, homes near or above asking); over ~6 favors buyers (more choice, more negotiating room). 4–6 is balanced.
- Months supply.
- How many months it would take to sell every home now for sale at the pace of the last 90 days: homes for sale ÷ (closings in the last 90 days ÷ 3).
- For sale.
- Homes listed as active right now. A live count, not a monthly average.
- Days to contract.
- The middle number of days between a home being listed and going under contract, over the last 90 days of closings. It is not days-to-close, and it is not how long today's listings have been sitting. Newly built homes are excluded, because a build finishing is not a market moving.
- Coming soon.
- Homes announced but not yet accepting showings. A live count.
- Under contract.
- Homes with an accepted contract that have not closed yet. A live count.
Search homes nearby 66106
| Place | Median list |
|---|---|
| Kansas City | $249,000 |
| Bonner Springs | $159,950 |
| Edwardsville | $314,950 |
| Shawnee | $554,975 |
| Lake Quivira | $939,000 |
| Basehor | $468,500 |
How we compute these
- Market.
- Market type is set by months of supply — how long it would take to sell every home for sale at the current pace. Under ~4 months favors sellers (low inventory, faster sales, homes near or above asking); over ~6 favors buyers (more choice, more negotiating room). 4–6 is balanced.
- Months supply.
- How many months it would take to sell every home now for sale at the pace of the last 90 days: homes for sale ÷ (closings in the last 90 days ÷ 3).
- Median list.
- The middle asking price among the homes for sale right now. Half are listed above it, half below.
- Days to contract.
- The middle number of days between a home being listed and going under contract, over the last 90 days of closings. It is not days-to-close, and it is not how long today's listings have been sitting. Newly built homes are excluded, because a build finishing is not a market moving.
- For sale.
- Homes listed as active right now. A live count, not a monthly average.
- Coming soon.
- Homes announced but not yet accepting showings. A live count.
- Under contract.
- Homes with an accepted contract that have not closed yet. A live count.
Nearby ZIP codes
| Place | Median list |
|---|---|
| 66104 | $249,000 |
| 66102 | $199,950 |
| 66103 | $219,250 |
| 66112 | $242,500 |
| 66111 | $287,500 |
| 66101 | $165,000 |
| 66105 | $225,000 |
| 66109 | $399,925 |
How we compute these
- Market.
- Market type is set by months of supply — how long it would take to sell every home for sale at the current pace. Under ~4 months favors sellers (low inventory, faster sales, homes near or above asking); over ~6 favors buyers (more choice, more negotiating room). 4–6 is balanced.
- Months supply.
- How many months it would take to sell every home now for sale at the pace of the last 90 days: homes for sale ÷ (closings in the last 90 days ÷ 3).
- Median list.
- The middle asking price among the homes for sale right now. Half are listed above it, half below.
- Days to contract.
- The middle number of days between a home being listed and going under contract, over the last 90 days of closings. It is not days-to-close, and it is not how long today's listings have been sitting. Newly built homes are excluded, because a build finishing is not a market moving.
- For sale.
- Homes listed as active right now. A live count, not a monthly average.
- Coming soon.
- Homes announced but not yet accepting showings. A live count.
- Under contract.
- Homes with an accepted contract that have not closed yet. A live count.
Search homes for sale in every city we cover
How we compute these
- Market.
- Market type is set by months of supply — how long it would take to sell every home for sale at the current pace. Under ~4 months favors sellers (low inventory, faster sales, homes near or above asking); over ~6 favors buyers (more choice, more negotiating room). 4–6 is balanced.
- Months supply.
- How many months it would take to sell every home now for sale at the pace of the last 90 days: homes for sale ÷ (closings in the last 90 days ÷ 3).
- Median list.
- The middle asking price among the homes for sale right now. Half are listed above it, half below.
- Days to contract.
- The middle number of days between a home being listed and going under contract, over the last 90 days of closings. It is not days-to-close, and it is not how long today's listings have been sitting. Newly built homes are excluded, because a build finishing is not a market moving.
- For sale.
- Homes listed as active right now. A live count, not a monthly average.
- Coming soon.
- Homes announced but not yet accepting showings. A live count.
- Under contract.
- Homes with an accepted contract that have not closed yet. A live count.
Search for homes in popular markets
| Market | For sale |
|---|---|
| Heritage Ranch | 28 |
| Canyon Lakes | 27 |
| Seven Bridges | 26 |
| Garrett Ranch | 25 |
| Ruskin Heights | 22 |
| Tomahawk Valley | 22 |
How we compute these
- Market.
- Market type is set by months of supply — how long it would take to sell every home for sale at the current pace. Under ~4 months favors sellers (low inventory, faster sales, homes near or above asking); over ~6 favors buyers (more choice, more negotiating room). 4–6 is balanced.
- For sale.
- Homes listed as active right now. A live count, not a monthly average.
Or go wider still county, metro and state
How we compute these
- Market.
- Market type is set by months of supply — how long it would take to sell every home for sale at the current pace. Under ~4 months favors sellers (low inventory, faster sales, homes near or above asking); over ~6 favors buyers (more choice, more negotiating room). 4–6 is balanced.
- Months supply.
- How many months it would take to sell every home now for sale at the pace of the last 90 days: homes for sale ÷ (closings in the last 90 days ÷ 3).
- Median list.
- The middle asking price among the homes for sale right now. Half are listed above it, half below.
- Days to contract.
- The middle number of days between a home being listed and going under contract, over the last 90 days of closings. It is not days-to-close, and it is not how long today's listings have been sitting. Newly built homes are excluded, because a build finishing is not a market moving.
- For sale.
- Homes listed as active right now. A live count, not a monthly average.
- Coming soon.
- Homes announced but not yet accepting showings. A live count.
- Under contract.
- Homes with an accepted contract that have not closed yet. A live count.