
Wyandotte County KS Real Estate & Homes For Sale
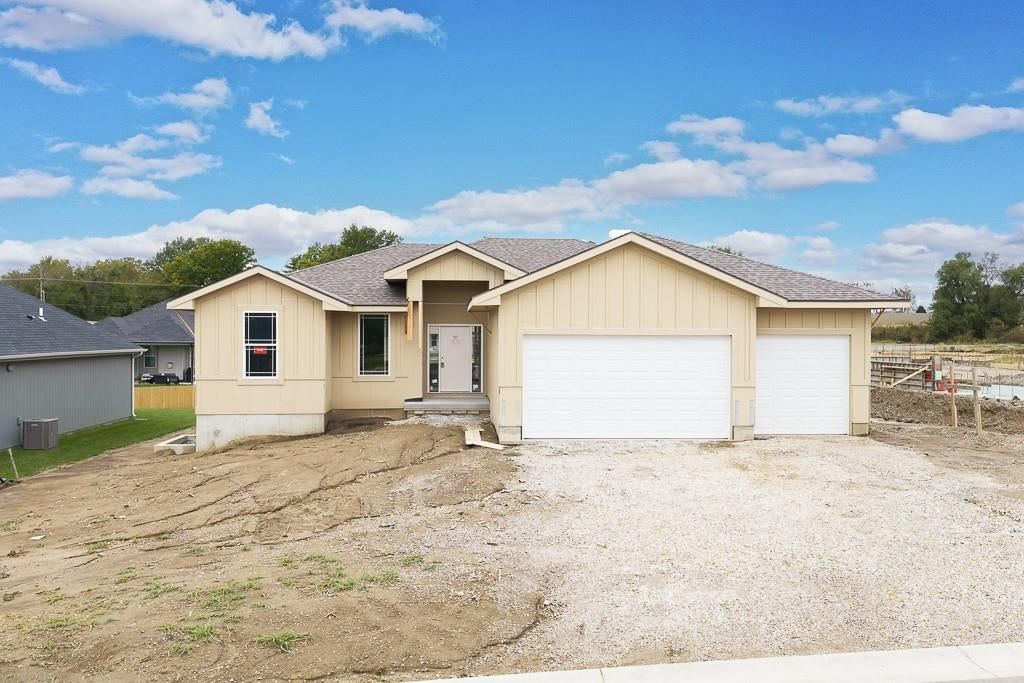
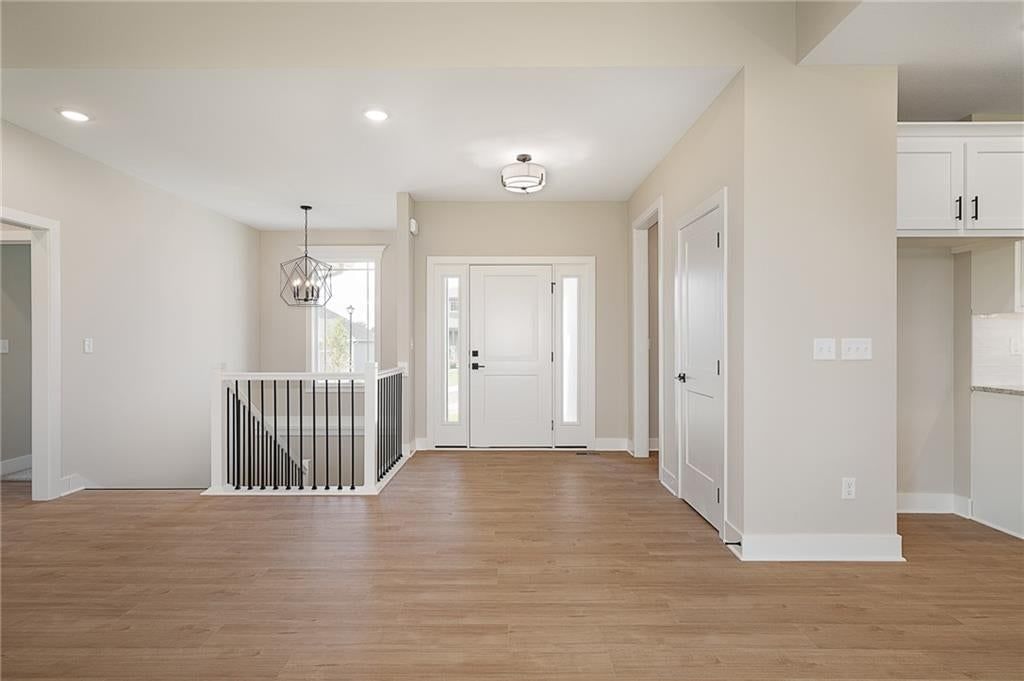
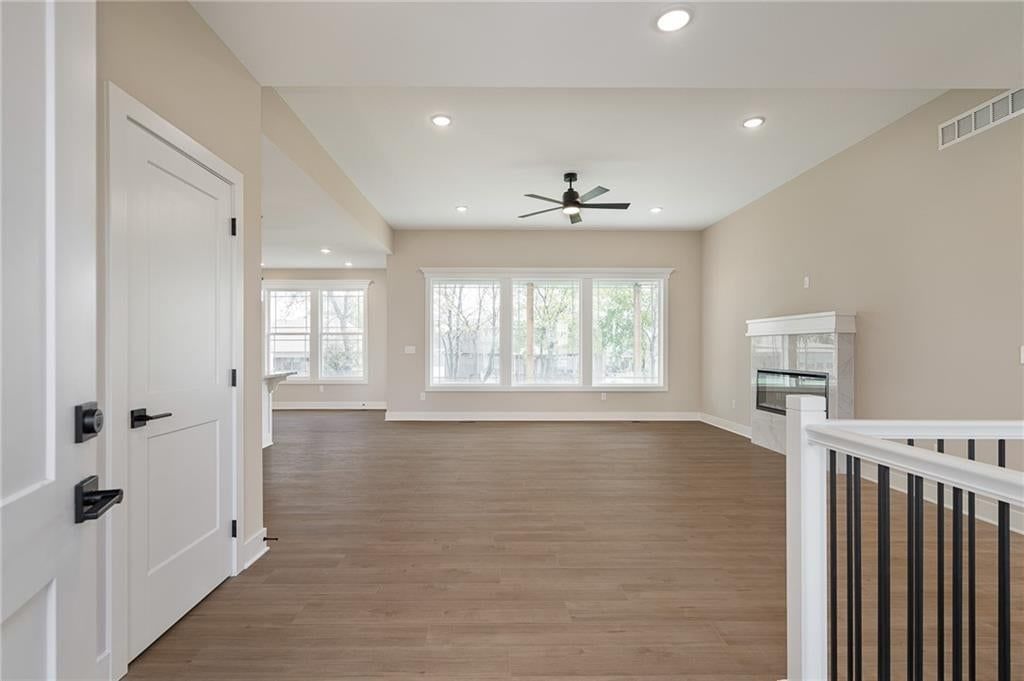
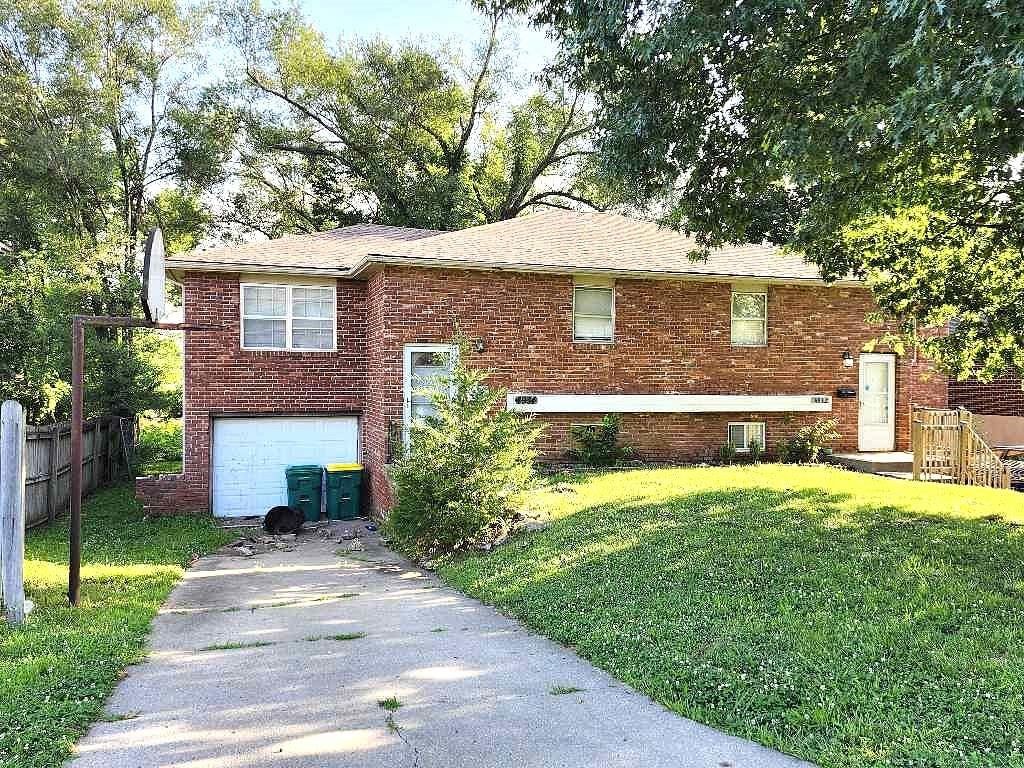
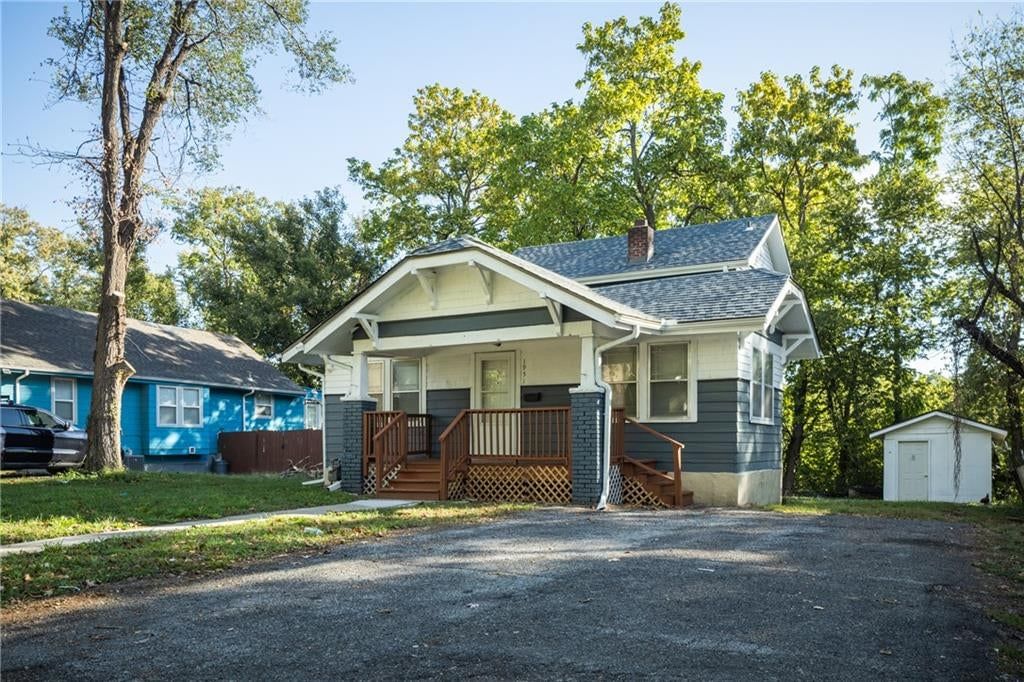
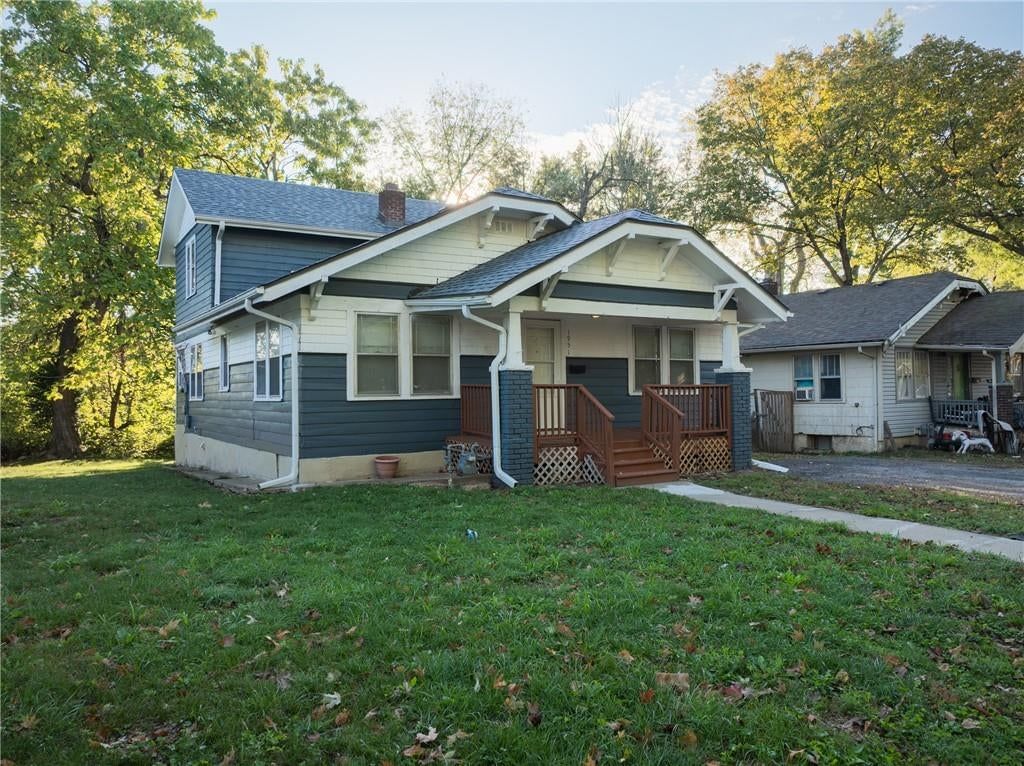
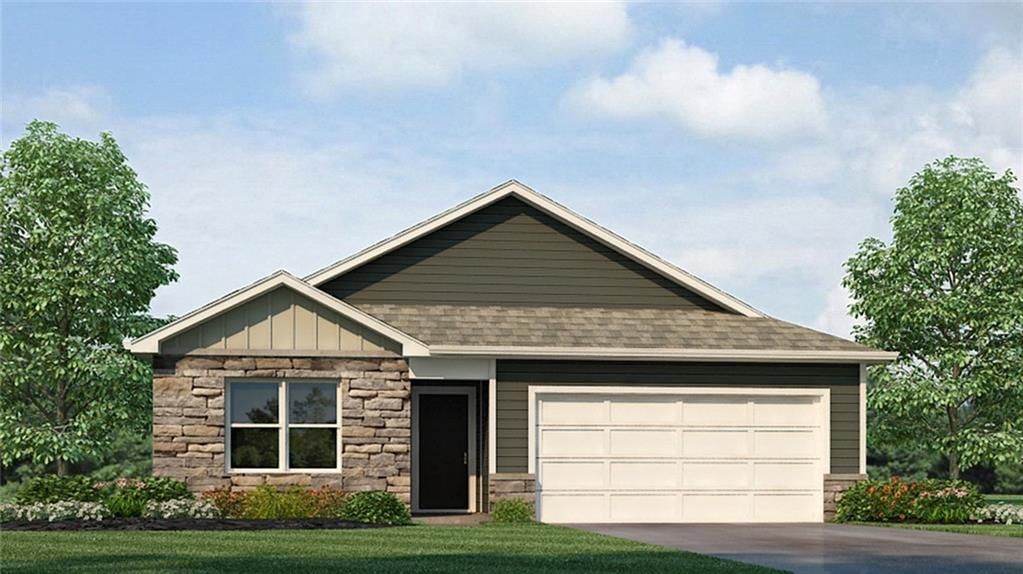
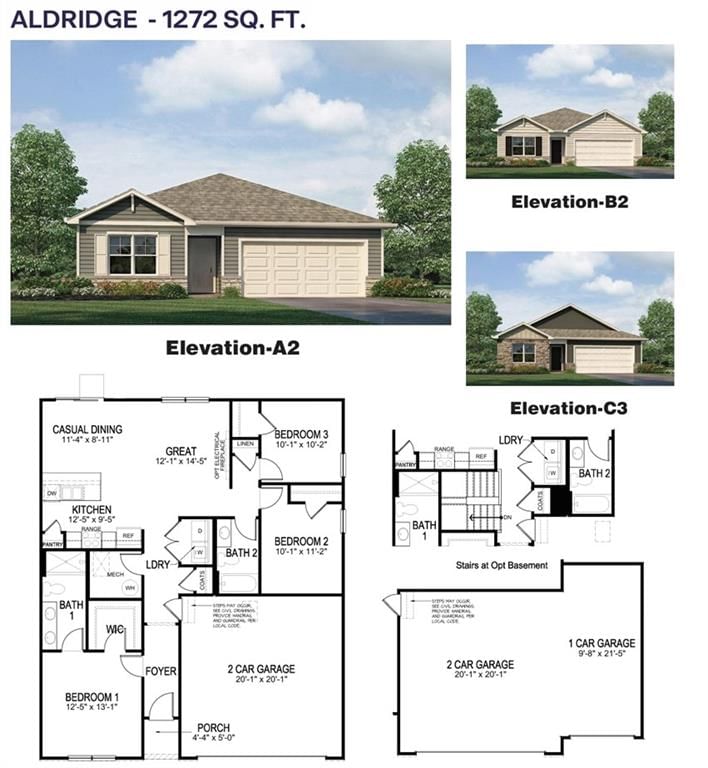
· 498 homes for sale in Wyandotte County498 homes for sale in Wyandotte County · Sorted by Newest Listed
Real estate in Wyandotte County, Kansas
Wyandotte County, KS has about 61,562 households and a median household income of $63,631. Roughly 62% of homes are owner-occupied, the median owner's home value is $172,300, 21% of adults hold a bachelor's degree or higher. The average commute runs 22.3 minutes. About 167,654 people live in Wyandotte County, KS, per the U.S. Census Bureau's American Community Survey 5-year estimate (2020–2024). New construction is still adding supply: 15 building permits were issued in August 2026.
The first thing a buyer or seller needs to know about Wyandotte County is this: it's a slow-moving market right now, and that cuts both ways. Sellers, meanwhile, need to price honestly and prepare for a longer wait — this is not a market where overpriced listings get bailed out by competing offers.
Kansas City, Kansas — which most locals just call KCK — makes up the bulk of the county and carries the county's reputation, for better and worse. It's a city of real character: deeply rooted Latino and Somali communities, a restaurant scene anchored by the legendary barbecue and taqueria strips on Central Avenue, and a working-class housing stock that gives buyers more square footage per dollar than nearly any comparable metro. Buyers should know that neighborhood quality varies block to block, so doing homework on specific streets, not just zip codes, is non-negotiable.
Bonner Springs and Edwardsville sit on the western edge of the county and offer a noticeably different feel. Bonner Springs has a genuine small-town downtown, hosts the annual Renaissance Festival, and attracts buyers who want a slower pace without leaving the metro entirely. Edwardsville is quiet, semi-rural, and tends to draw buyers looking for larger lots or light agricultural use. Both communities have seen steady interest from buyers priced out of Johnson County just to the south, and the commute to corporate campuses in Overland Park or Lenexa is manageable via K-7.
Schools in Wyandotte County are a legitimate consideration. Kansas City, Kansas Public Schools — the USD 500 district — has faced well-documented challenges, and buyers with school-age children should research individual schools rather than assume district-wide performance. Bonner Springs falls under USD 204, which generally earns stronger marks and is a real draw for families settling on the county's western end. Private and charter school options exist throughout the county for families who plan ahead.
The buyers shopping Wyandotte County are often budget-conscious and diligent; they will notice if a home is overpriced.
For buyers, the calculus is more encouraging. Wyandotte County rewards buyers who are willing to look past surface-level impressions and invest in a community that, particularly in KCK's urban core and Bonner Springs, is putting real energy into its future.
Housing market trends in Wyandotte County, Kansas
As of Oct 22, 2026, Wyandotte County, KS: 498 homes for sale · 41 new in the last 7 days · median asking $245,000 · 175 price reductions · a median of 21 days to contract. 141 homes closed in the last 30 days, at a median of $239,900. At the pace of the last 90 days that is 3.29 months of supply.
| Measure | Sep 2026 | Aug 2026 | Sep 2025 |
|---|---|---|---|
| Median sale price | $234,500 | $243,000 | $240,000 |
| Median price per sq ft | $157 | $164 | $155 |
| Median days to contract | 21 | 25 | 20 |
| Sell-to-list ratio | 100% | 100% | 100% |
| Homes sold | 139 | 141 | 117 |
| New listings | 192 | 238 | 135 |
| Went under contract | 154 | 134 | 108 |
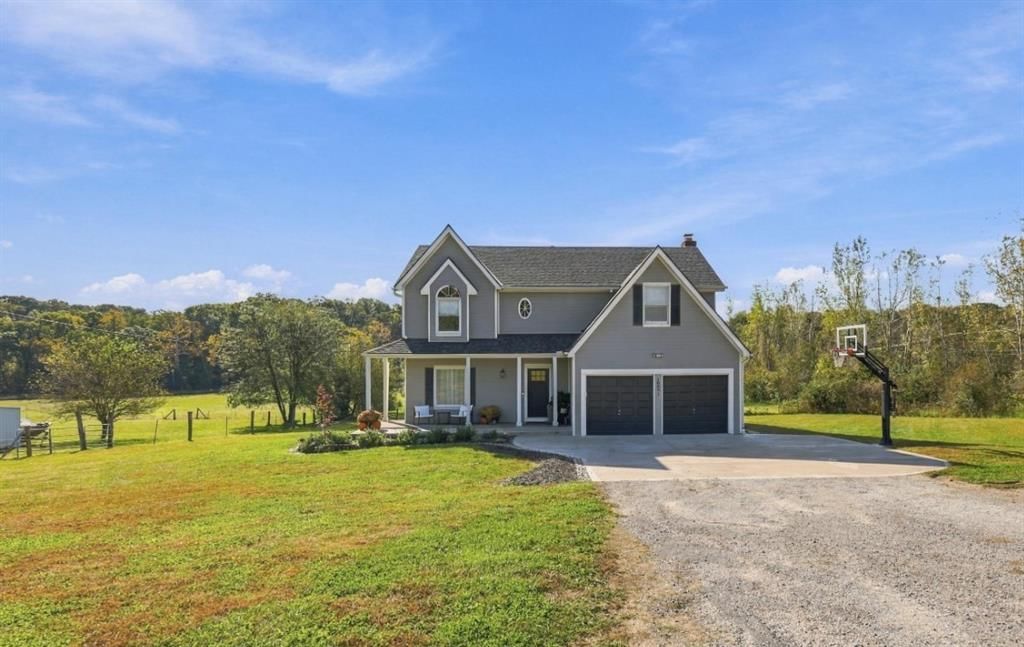
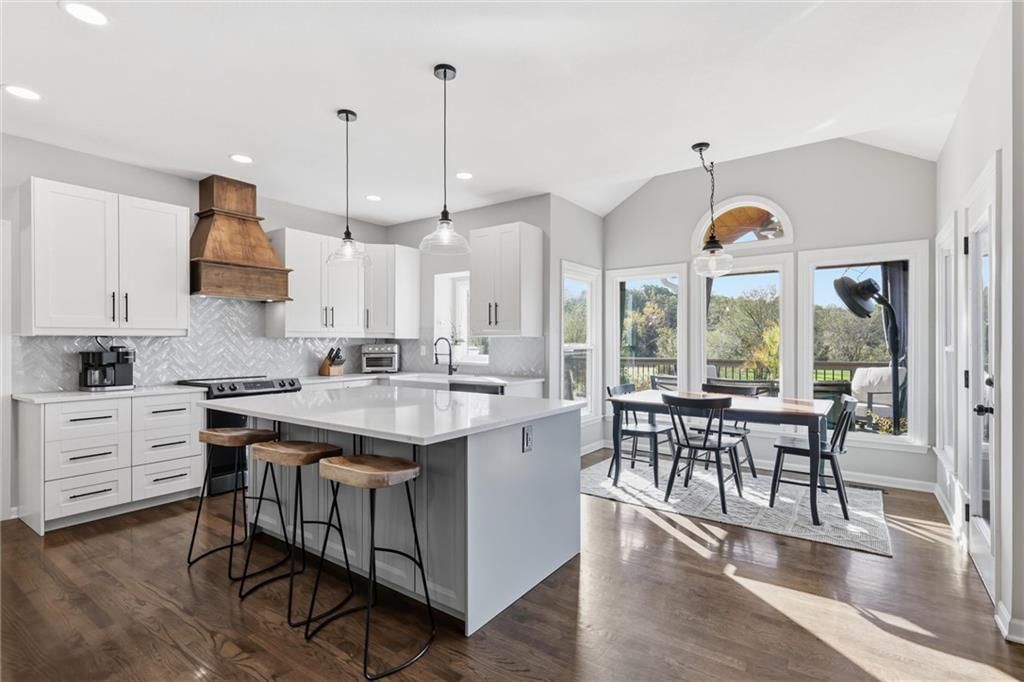
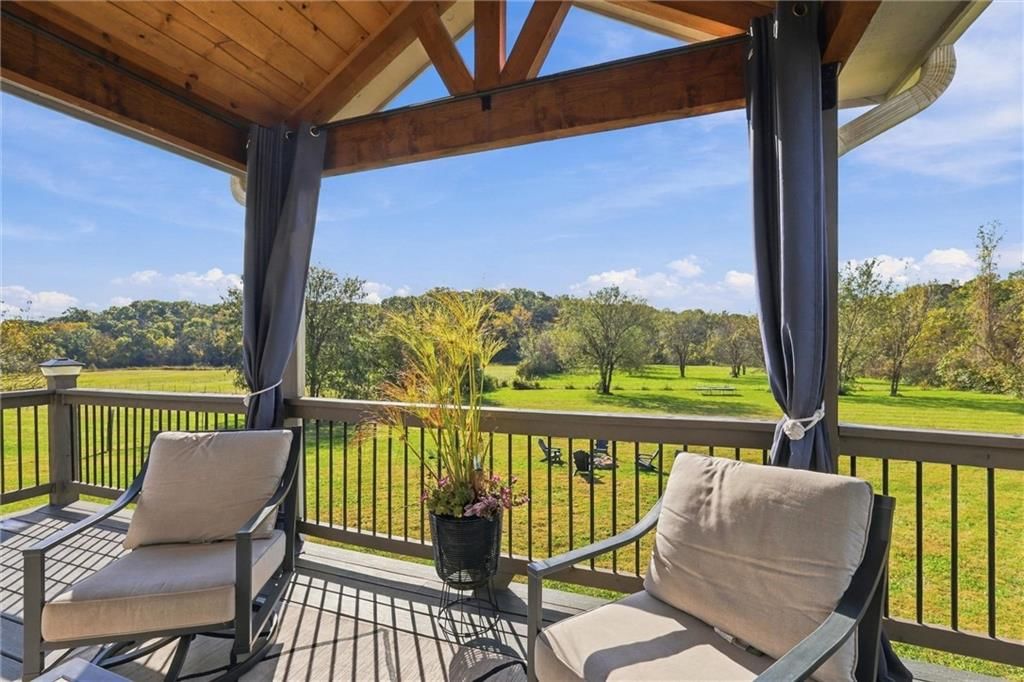
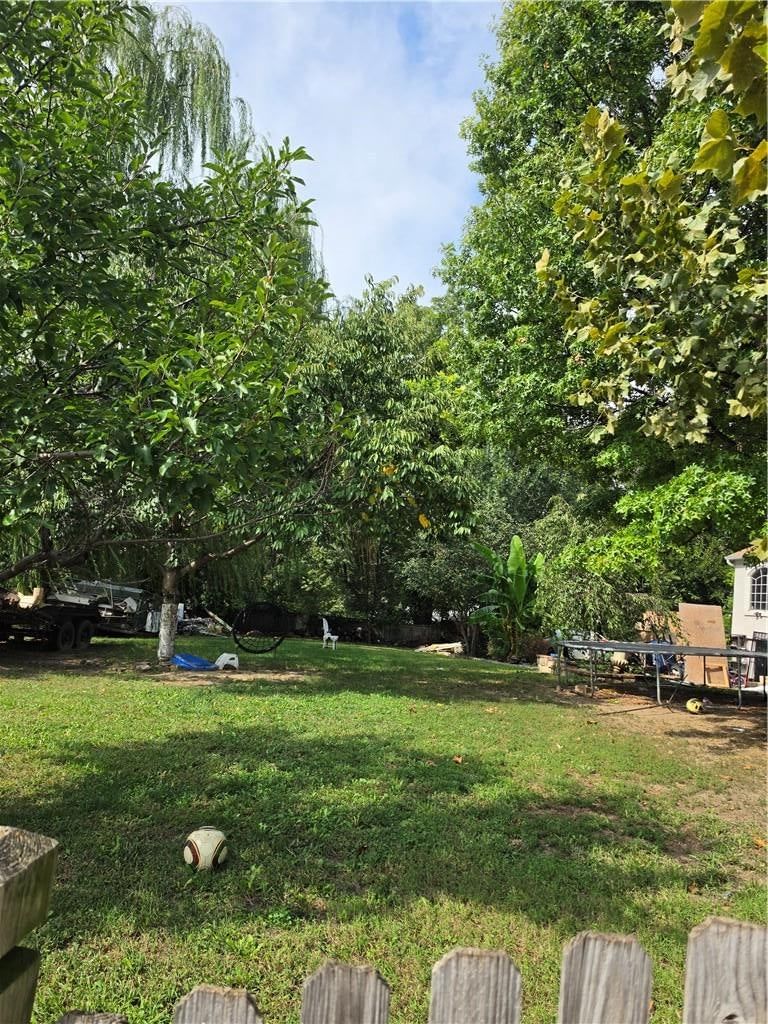
Schools serving Wyandotte County
| School | Median list | For sale |
|---|---|---|
| School districts | ||
| Kansas City KS School District | Median$230,000 | 330 |
| Piper School District | Median$450,000 | 89 |
| Bonner Springs School District | Median$340,000 | 35 |
| Turner School District | Median$244,725 | 34 |
| Kansas City MO School District | Median— | — |
| High schools | ||
| Washington | Median$250,000 | 43 |
| Wyandotte | Median$170,500 | 42 |
| Piper | Median$475,000 | 37 |
| Harmon | Median$230,000 | 23 |
| Bonner Springs | Median$350,000 | 21 |
| Turner | Median— | — |
| F.L. Schlagle | Median$260,000 | 10 |
How we compute these
- Median list.
- The middle asking price among the homes for sale right now. Half are listed above it, half below.
- For sale.
- Homes listed as active right now. A live count, not a monthly average.
Popular home searches in Wyandotte County
| Search | For sale |
|---|---|
| Open houses | For sale14 |
| Luxury homes | For sale13 |
| Just listed homes | For sale41 |
| Price-reduced homes | For sale175 |
| Coming soon homes | For sale31 |
| Homes under contract | For sale171 |
How we compute these
- For sale.
- Homes listed as active right now. A live count, not a monthly average.
Homes by price in Wyandotte County
| Price range | For sale |
|---|---|
| Under $200,000 | For sale180 |
| Under $300,000 | For sale351 |
| Under $400,000 | For sale411 |
| Under $500,000 | For sale443 |
How we compute these
- For sale.
- Homes listed as active right now. A live count, not a monthly average.
Homes by feature in Wyandotte County
| Feature | For sale |
|---|---|
| Homes with no HOA | For sale415 |
| Homes on under a quarter acre | For sale294 |
| Two or more stories | For sale267 |
| Homes with 2+ full bathrooms | For sale260 |
How we compute these
- For sale.
- Homes listed as active right now. A live count, not a monthly average.
Search by property type in Wyandotte County
| Property type | Market (Market type is set by months of supply — how long it would take to sell every home for sale at the current pace. Under ~4 months favors sellers (low inventory, faster sales, homes near or above asking); over ~6 favors buyers (more choice, more negotiating room). 4–6 is balanced.) | Months supply | For sale | Median sale | Sell-to-list | Days to contract | Coming soon | Under contract |
|---|---|---|---|---|---|---|---|---|
| Single Family | Seller's | 2.8 mo | 318 | Median$238,500 | 99% | 22d | 30 | 141 |
| Townhouse | Balanced | 5.6 mo | 14 | Median$229,000 | 100% | 16d | 0 | 6 |
| Villa | — | — | — | Median— | — | — | — | — |
| Condo / Loft | — | — | — | Median— | — | — | — | — |
| Half Duplex | — | — | — | Median— | — | — | — | — |
| Duplex | — | — | — | Median— | — | — | — | — |
| Quadruplex | — | — | — | Median— | — | — | — | — |
| Lots / Land | Strong Buyer's | 21.2 mo | 99 | Median$43,000 | 88% | 90d | 1 | 9 |
How we compute these
- Market.
- Market type is set by months of supply — how long it would take to sell every home for sale at the current pace. Under ~4 months favors sellers (low inventory, faster sales, homes near or above asking); over ~6 favors buyers (more choice, more negotiating room). 4–6 is balanced.
- Months supply.
- How many months it would take to sell every home now for sale at the pace of the last 90 days: homes for sale ÷ (closings in the last 90 days ÷ 3).
- For sale.
- Homes listed as active right now. A live count, not a monthly average.
- Days to contract.
- The middle number of days between a home being listed and going under contract, over the last 90 days of closings. It is not days-to-close, and it is not how long today's listings have been sitting. Newly built homes are excluded, because a build finishing is not a market moving.
- Coming soon.
- Homes announced but not yet accepting showings. A live count.
- Under contract.
- Homes with an accepted contract that have not closed yet. A live count.
Search homes in Wyandotte County
| City | Market (Market type is set by months of supply — how long it would take to sell every home for sale at the current pace. Under ~4 months favors sellers (low inventory, faster sales, homes near or above asking); over ~6 favors buyers (more choice, more negotiating room). 4–6 is balanced.) | Months supply | Median list | Sell-to-list | Days to contract | For sale | Coming soon | Under contract |
|---|---|---|---|---|---|---|---|---|
| Kansas City | Seller's | 3.9 mo | Median$249,000 | 95% | 24d | 467 | 27 | 163 |
| Bonner Springs | Seller's | 3.8 mo | Median$180,000 | 96% | 21d | 39 | 4 | 15 |
| Edwardsville | Balanced | 5.6 mo | Median$320,000 | 96% | 36d | 15 | 2 | 5 |
| Shawnee | Seller's | 2.5 mo | Median$562,000 | 100% | 16d | 175 | 18 | 107 |
| Lake Quivira | Balanced | 4.4 mo | Median$839,611 | 88% | 55d | 4 | 0 | 1 |
| Basehor | Seller's | 3.6 mo | Median$499,950 | 100% | 30d | 89 | 1 | 57 |
How we compute these
- Market.
- Market type is set by months of supply — how long it would take to sell every home for sale at the current pace. Under ~4 months favors sellers (low inventory, faster sales, homes near or above asking); over ~6 favors buyers (more choice, more negotiating room). 4–6 is balanced.
- Months supply.
- How many months it would take to sell every home now for sale at the pace of the last 90 days: homes for sale ÷ (closings in the last 90 days ÷ 3).
- Median list.
- The middle asking price among the homes for sale right now. Half are listed above it, half below.
- Days to contract.
- The middle number of days between a home being listed and going under contract, over the last 90 days of closings. It is not days-to-close, and it is not how long today's listings have been sitting. Newly built homes are excluded, because a build finishing is not a market moving.
- For sale.
- Homes listed as active right now. A live count, not a monthly average.
- Coming soon.
- Homes announced but not yet accepting showings. A live count.
- Under contract.
- Homes with an accepted contract that have not closed yet. A live count.
ZIP codes in Wyandotte County
| Place | Market (Market type is set by months of supply — how long it would take to sell every home for sale at the current pace. Under ~4 months favors sellers (low inventory, faster sales, homes near or above asking); over ~6 favors buyers (more choice, more negotiating room). 4–6 is balanced.) | Months supply | Median list | Sell-to-list | Days to contract | For sale | Coming soon | Under contract |
|---|---|---|---|---|---|---|---|---|
| 66104 | Balanced | 4.6 mo | Median$249,000 | 98% | 24d | 104 | 7 | 31 |
| 66106 | Strong Seller's | 1.9 mo | Median$239,900 | 97% | 20d | 40 | 5 | 24 |
| 66102 | Balanced | 4.3 mo | Median$214,975 | 95% | 25d | 78 | 2 | 29 |
| 66103 | Seller's | 3.1 mo | Median$229,500 | 94% | 21d | 30 | 2 | 10 |
How we compute these
- Market.
- Market type is set by months of supply — how long it would take to sell every home for sale at the current pace. Under ~4 months favors sellers (low inventory, faster sales, homes near or above asking); over ~6 favors buyers (more choice, more negotiating room). 4–6 is balanced.
- Months supply.
- How many months it would take to sell every home now for sale at the pace of the last 90 days: homes for sale ÷ (closings in the last 90 days ÷ 3).
- Median list.
- The middle asking price among the homes for sale right now. Half are listed above it, half below.
- Days to contract.
- The middle number of days between a home being listed and going under contract, over the last 90 days of closings. It is not days-to-close, and it is not how long today's listings have been sitting. Newly built homes are excluded, because a build finishing is not a market moving.
- For sale.
- Homes listed as active right now. A live count, not a monthly average.
- Coming soon.
- Homes announced but not yet accepting showings. A live count.
- Under contract.
- Homes with an accepted contract that have not closed yet. A live count.